

DNY59
Instead of an investment thesis
Since the beginning of September this year, Seeking Alpha’s contributors have already written 16 articles about ZIM Integrated Shipping (NYSE:ZIM) stock – one of those pieces was written by your humble servant [link]. Of those 16 articles, only 4 and 1 have “hold” and “sell” ratings, respectively, while the rest are either bullish or strongly bullish based on fundamentals, market outlook, and more.
At the beginning of the month, I assumed that ZIM stock should show an impressive rebound when it hits a strong local resistance, based on the technical analysis performed. Unfortunately for me as a shareholder of ZIM, this technical picture has not come true – the stock has since fallen 25.89% (the S&P 500 Index fell 10.50% over the same period) due to intense market pressure and the increased risk of a global recession.
This article complements my previous technical view of ZIM’s share price performance and proposes an action plan that I’m going to follow from now on.
My thesis remains unchanged: While I maintain the bulls’ fundamental arguments, I believe ZIM stock is heavily oversold, which creates an excellent opportunity for a speculative rally or even a break of the downtrend price channel in the near future. In this article, however, I will discuss a speculative strategy I have developed for subscribers of Beyond the Wall Investing – a marketplace service that will go online tomorrow, September 27, on Seeking Alpha.
What is the strategy?
Let me warn you right away that technical analysis is not my specialty – high market volatility has made me pay attention to support/resistance levels, trend channels, and more because in the modern world everything changes so fast that the “buy and hold” approach fails very often.
Last time I looked at ZIM’s price action through the prism of a descending price channel that formed clearly discernible swings of 25-30% in 2-3 weeks on the way down. At the time of publishing that article (September 12) ZIM’s price was again approaching the support border of its descending channel, and I expected a rebound to occur shortly, as ZIM remains attractive on all operating metrics to date. But then FedEx’s (FDX) report came out and the entire transportation sector, like the rest of the market, began to drown in blood.
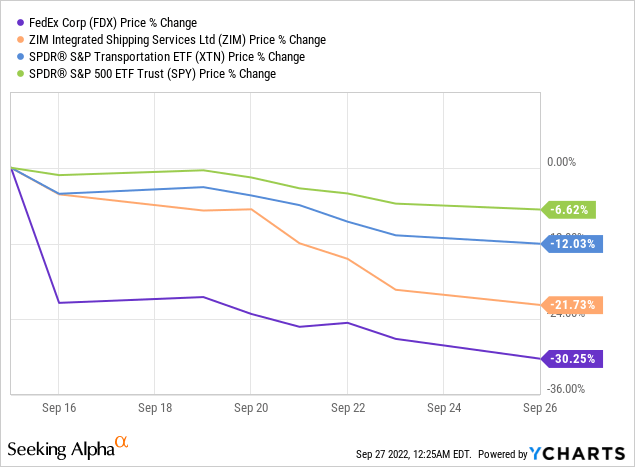
Against this background, the recovery of ZIM’s stock from the lower limit of its price channel was no longer relevant – the price has broken through and plunged to a lower level:
TrendSpider, ZIM, author’s notes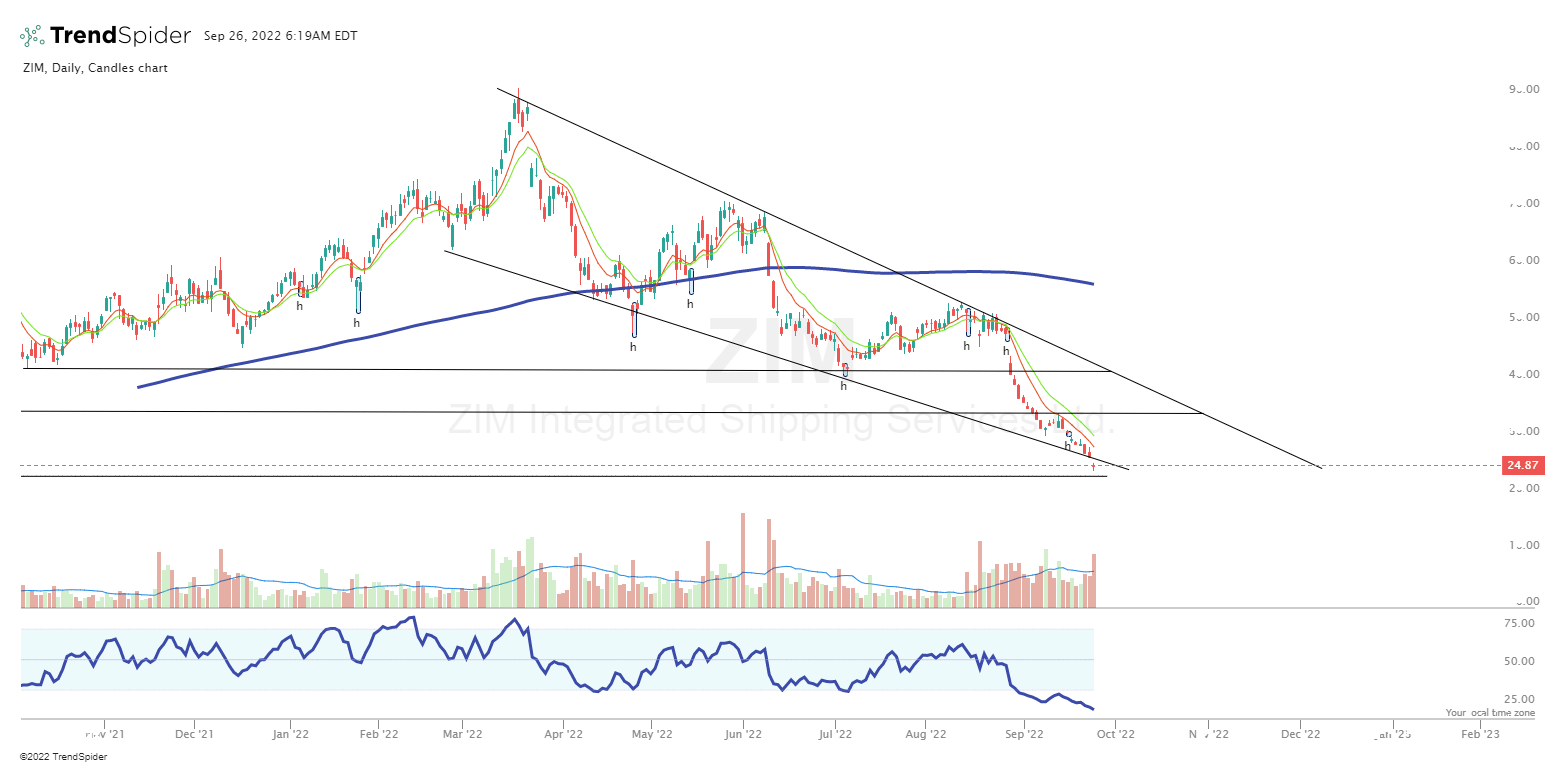
If that signal became no longer relevant, why am I writing about it now?
Because technical analysis and all kinds of patterns are not a crystal ball – we need to look at the big picture to increase our chances of success with tactical positioning. So what I wrote about in the last article is just 1 puzzle to think about. Today I have 2 more technical arguments in favor of the high probability of an imminent recovery of the ZIM.
The 1st argument is oversoldness. ZIM’s RSI broke through 30 at the end of August and has been falling ever since. I decided to backtest a trading strategy to see how typical such cases have been in the past and how investors could manage their ZIM position in such movements. Let’s say there is a hypothetical investor who buys ZIM stock at the next day’s open after it breaks the RSI level of 45. This investor exits his/her position when the RSI reaches 60. This means that the entry and exit from the position do not occur at extreme levels so that the selection of transactions is broader and therefore more representative.
In this case, what is happening now looks anomalous, to say the least – ZIM’s share price should have reversed in early September according to TrendSpider’s AI implied model:
TrendSpider Software, ZIM (daily), RSI strategy (entries/exits) TrendSpider Software, ZIM (daily), RSI strategy performance vs underlying asset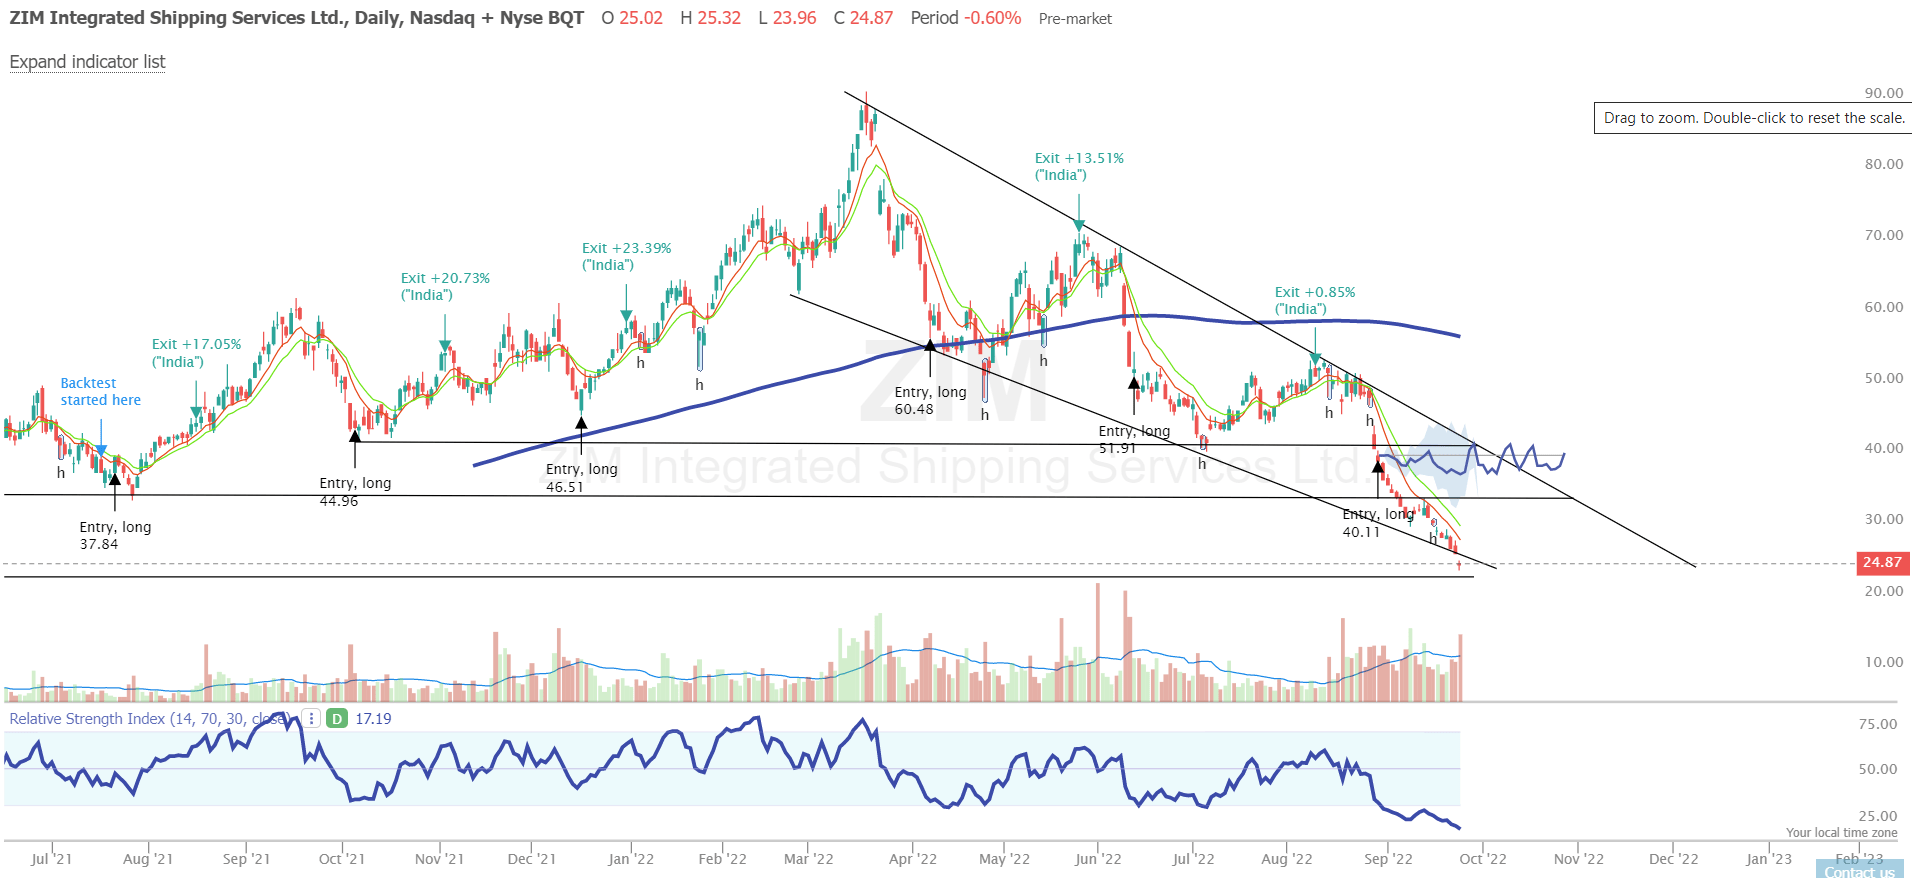
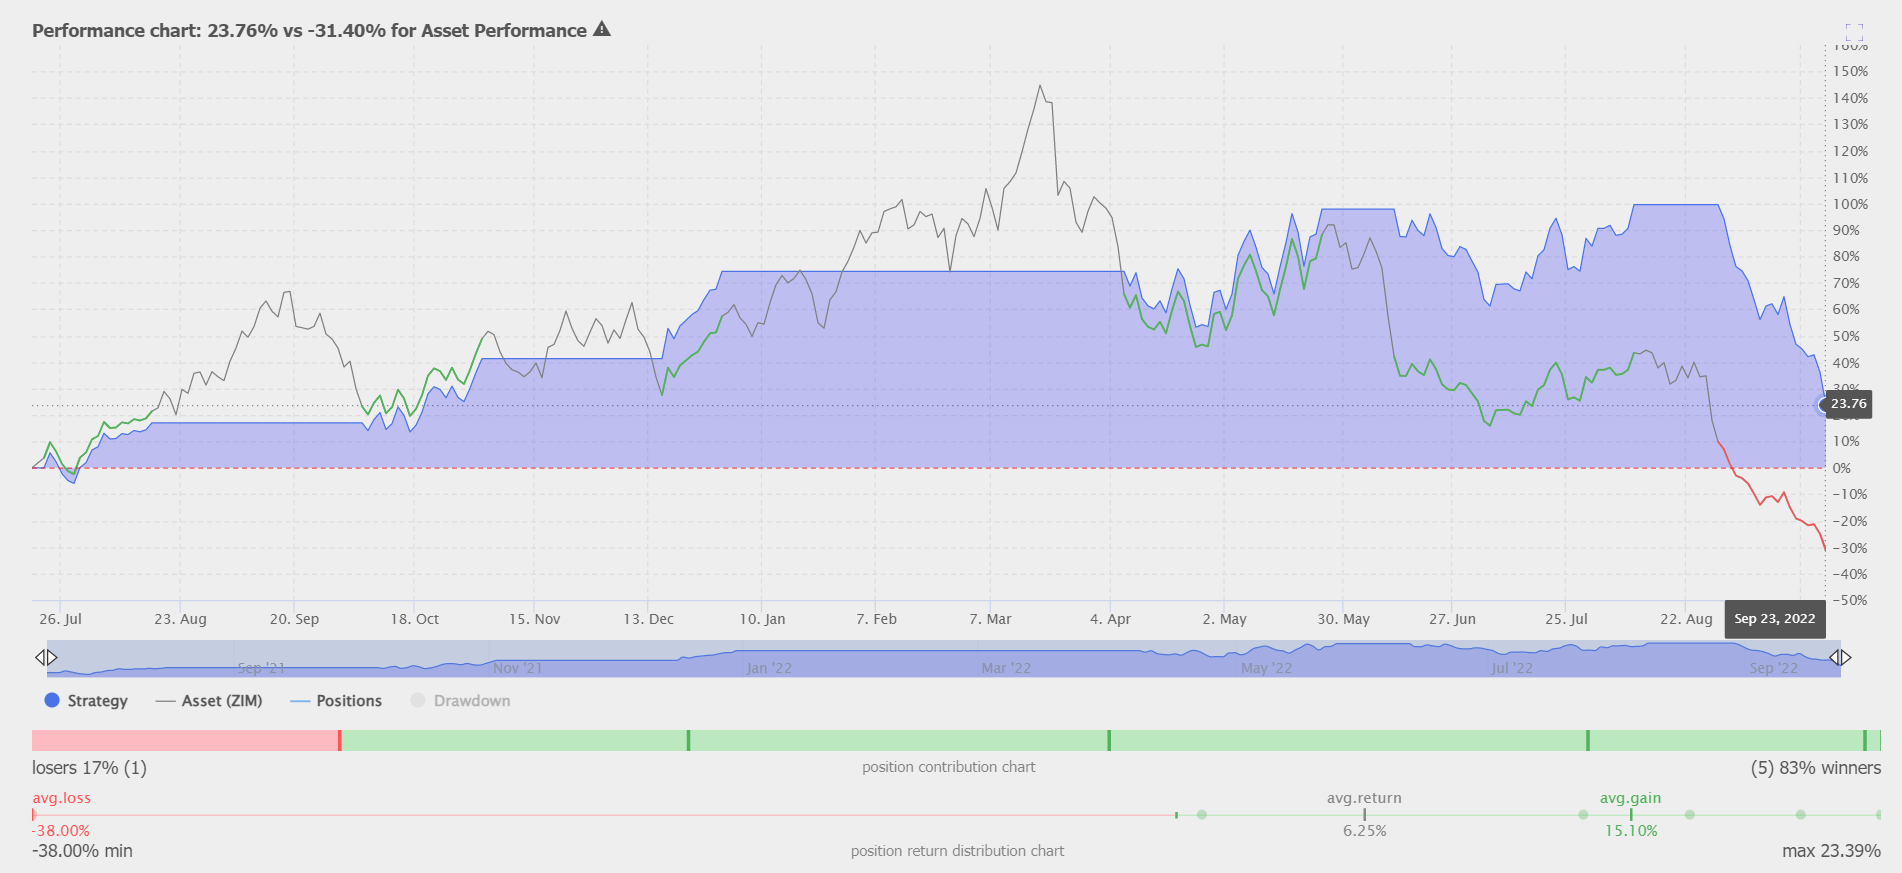
The simulated model for the last 12 months predicted 6 position entries, all of which were successful (from +0.85% to +23.39% on average per month), except for the last one – the position entry based on the oversoldness at the end of August brought 38% loss.
This strategy holds ZIM to this day, as the RSI has not returned to its usual range of 70-30 – let’s remember this moment.
The 2nd argument is the price trend change. The next strategy shows even more impressive results compared to the performance of the underlying asset (ZIM stock). It is based on entering a position when the daily MACD crosses the signal line (below 0) from down to up and exiting the position when the MACD crosses the signal line (above 0) from up to down. These conditions, just as with RSI, allow a potential investor to increase the analyzed sample of trades without the need to set a stop loss during implementation – the MACD movement will do this by itself. Below you can see the results:
TrendSpider Software, ZIM (daily), MACD strategy (entries/exits) TrendSpider Software, ZIM (daily), MACD strategy performance vs underlying asset

This strategy did not provide any more buy signals after the exit from the last position on August 22 (from +11.09%), as the MACD and the signal line did not cross – this saved the second potential investor from terrible losses (sorry I am not such an investor).
Taking these two arguments together, a more colorful picture emerges – an extremely low RSI against the backdrop of a MACD (blue in the chart) strongly approaching the signal line (orange line in the chart) should with higher probability (than without these conditions) lead to a medium-term rebound of the ZIM share.
And the core argument stays the same – it is the pattern of approaching the stock price to the support level (which I wrote about in my last article). In the new history of ZIM (since IPO), the situation when all three conditions occurred simultaneously occurred only 2 times – both times the stock recorded a 20%+ increase at that point (using Take Profit = 20%, Stop Loss = 10%, Reward-to-Risk = 2).
TrendSpider Software, ZIM (daily), RSI + MACD strategy (plus author’s notes)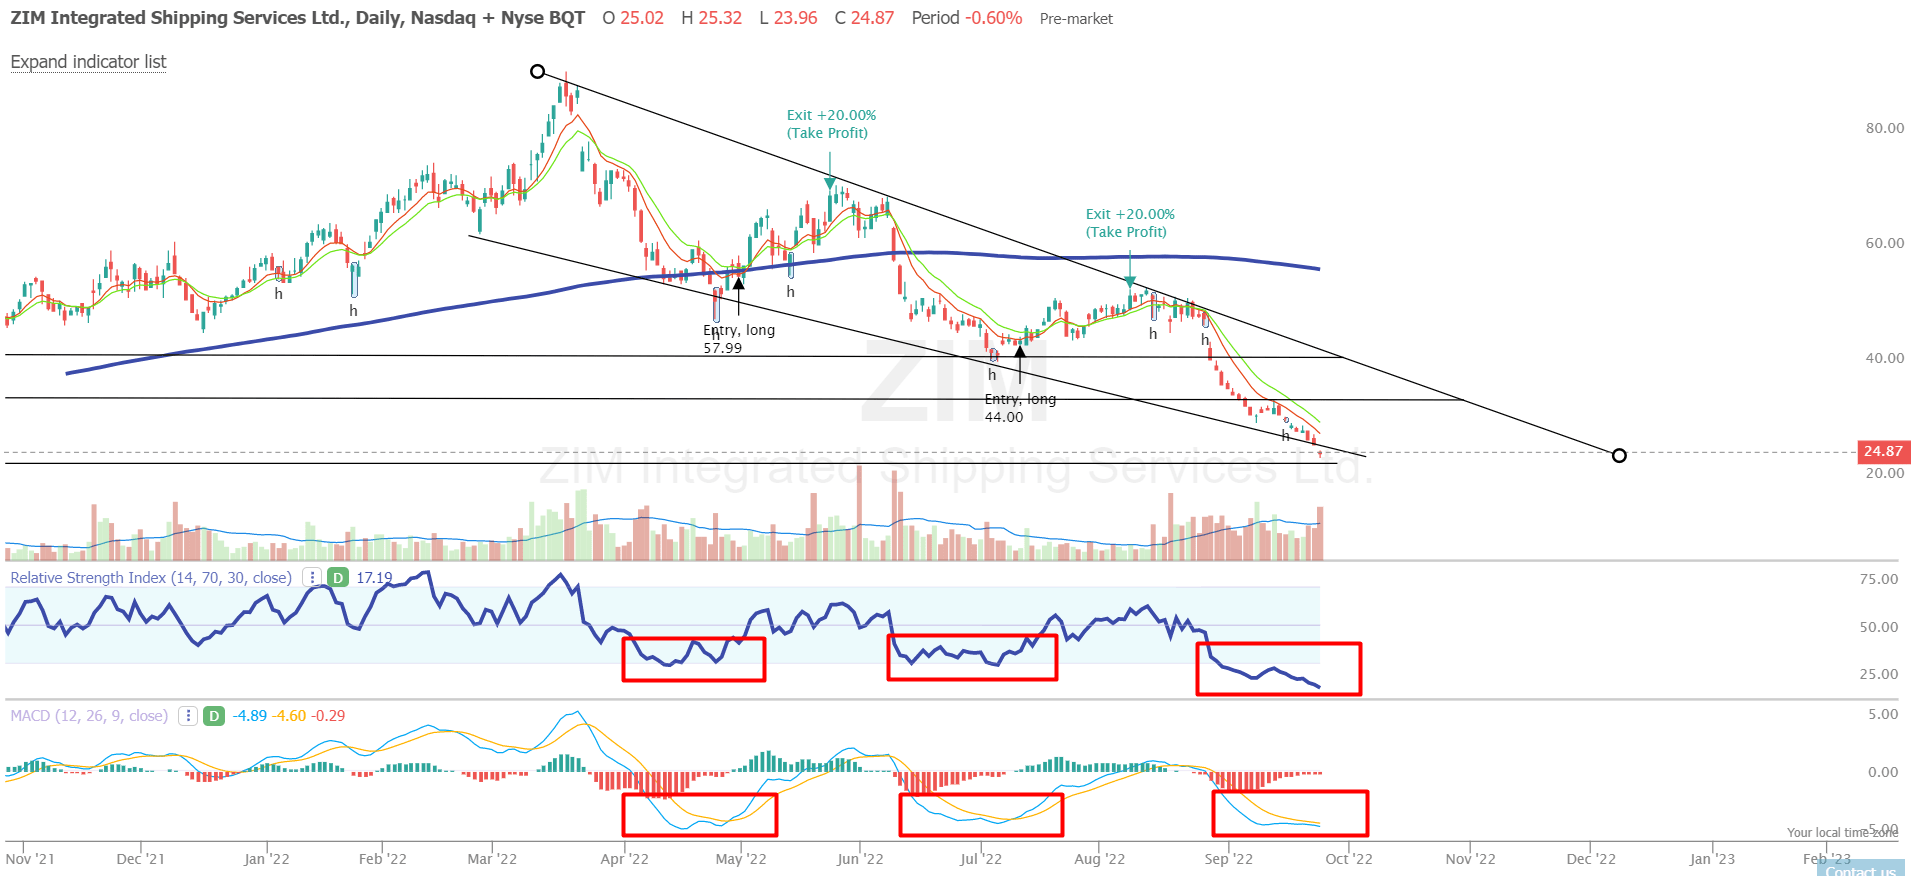
Risks to consider and how I’m going to act
Again – I am not a CMT analyst and technical analysis is not my primary method of analyzing stocks. In the case of ZIM, I am trying to help the Seeking Alpha community in this way, and only because my fundamentally bullish theses have already been detailed in the last 15-30 ZIM articles that appear on the site almost daily. You should consider the bears’ theses before buying ZIM – maybe now is really not the best time in terms of sentiment and prevailing catalysts.
What am I going to do personally? I already have a position in ZIM, which I increased at the time of my last article – as you can guess, it shows a significant loss. But I’m going to “catch the knife” as soon as the MACD crosses the signal line – with an oversold condition and a price channel formed, this will significantly increase the chances of a strong bounce. As you can see from the last chart above, the wait is likely to be short.
Please, share your perspective in the comment section below! Thank you!
Final note: Hey, on September 27, we’ll be launching a marketplace service at Seeking Alpha called Beyond the Wall Investing, where we will be tracking and analyzing the latest bank reports to identify hidden opportunities early! All early subscribers will receive a special lifetime legacy price offer. So follow and stay tuned!
Author’s note: Special thanks to fellow SA contributor Danil Sereda (see our association in my bio description) for running the TrendSpider software to obtain the above information.
Be the first to comment