

Debalina Ghosh
I’d like to start this article off by making it clear that the Global X S&P 500 Covered Call ETF (NYSEARCA:XYLD) is likely going to outperform the S&P 500 (SPY) if market sentiment remains bearish regardless of the ETF’s flaws.
However, compared to peers, namely WisdomTree CBOE S&P 500 PutWrite Strategy ETF (PUTW), XYLD is almost certainly going to underperform, and compared to self-directed options strategies XYLD has significantly worse risk-reward and expected return – especially in volatile markets.
In this article, I will compare XYLD vs alternatives and explain the flaws in the current long-SPY short-premium ETF space. We’ll also go over some actionable strategies investors can implement to improve their positioning in the current macro environment and both the pros and cons of such strategies.
Last 5 Year total return of SPY, XYLD, and SPY (Seeking Alpha)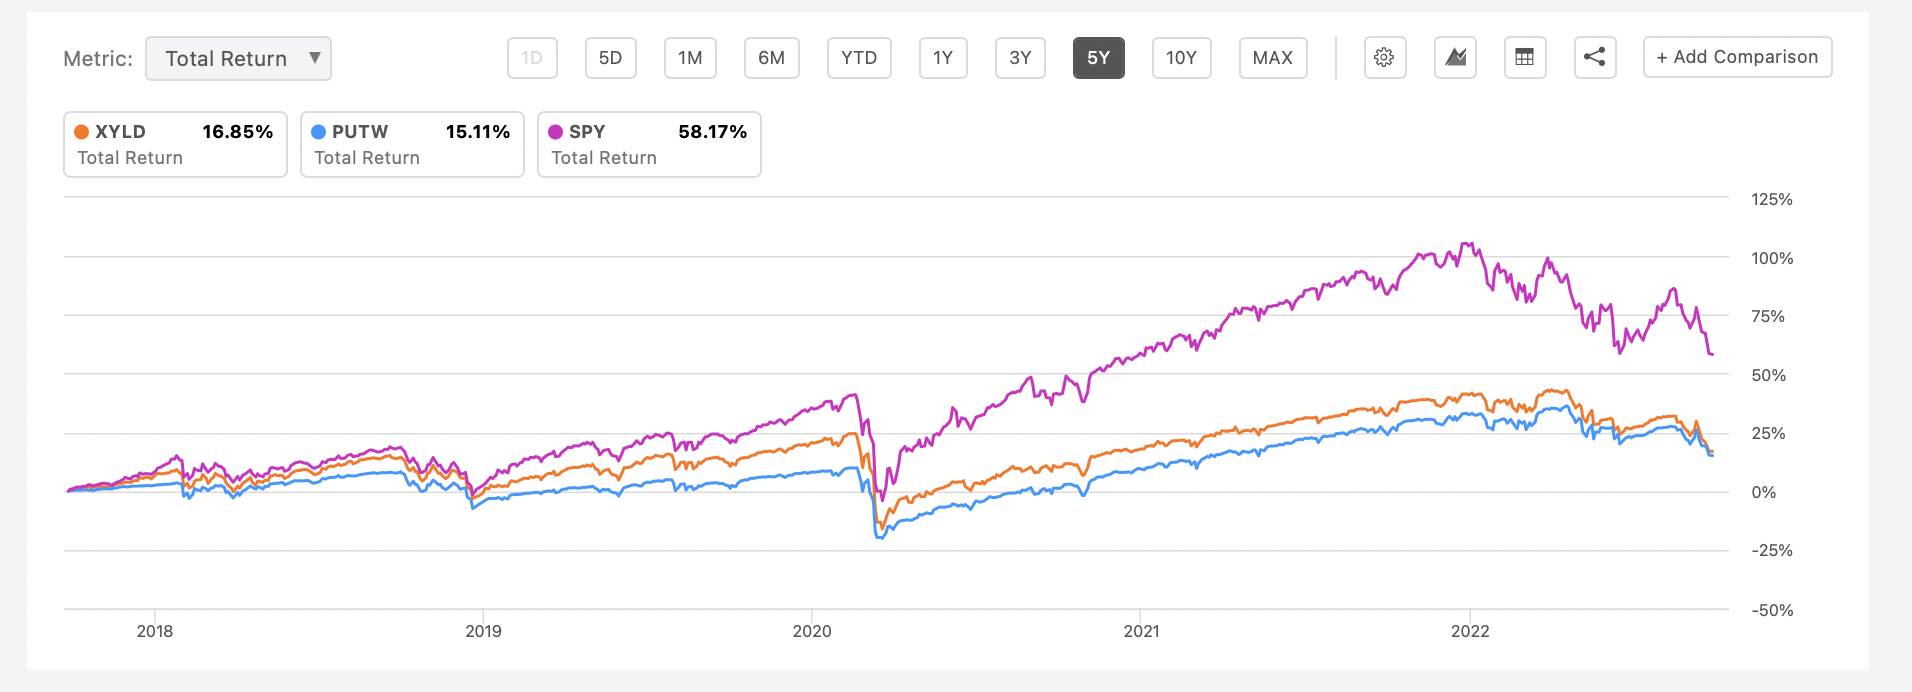
To start I’d like to demonstrate the poor performance and general strategy of XYLD to help everyone understand why it’s not a very good investment vehicle relative to peers, and some flaws in the strategy they use.
Looking at the above chart you can see the last 5 years of performance of XYLD relative to SPY and PUTW accounting for dividends and distributions. This was a particularly bullish time period where the expected moves to the upside were understated so all short-premium funds (like XYLD and PUTW) will underperform. With that being said XYLD returned 16.85%, PUTW returned 15.11%, and SPY returned 58.17%.
This is to say during one-sided markets it’s clear that covered call and covered put ETFs get absolutely destroyed in relative terms to the indexes they track. That should be obvious as these ETFs carry less delta-exposure per dollar invested in them.
Theory: Short-Premium Net-Long ETFs outperform their indexes in bear markets
Inversing the above bullish results, during long bear markets, the opposite should happen – these funds will outperform the long index, but underperform a short index, due to their delta exposure.
But is that really the case? I would think so, but let’s check some other timeframes and see if the theory holds up.
Last 1 Year total return of SPY, XYLD, and SPY (Seeking Alpha)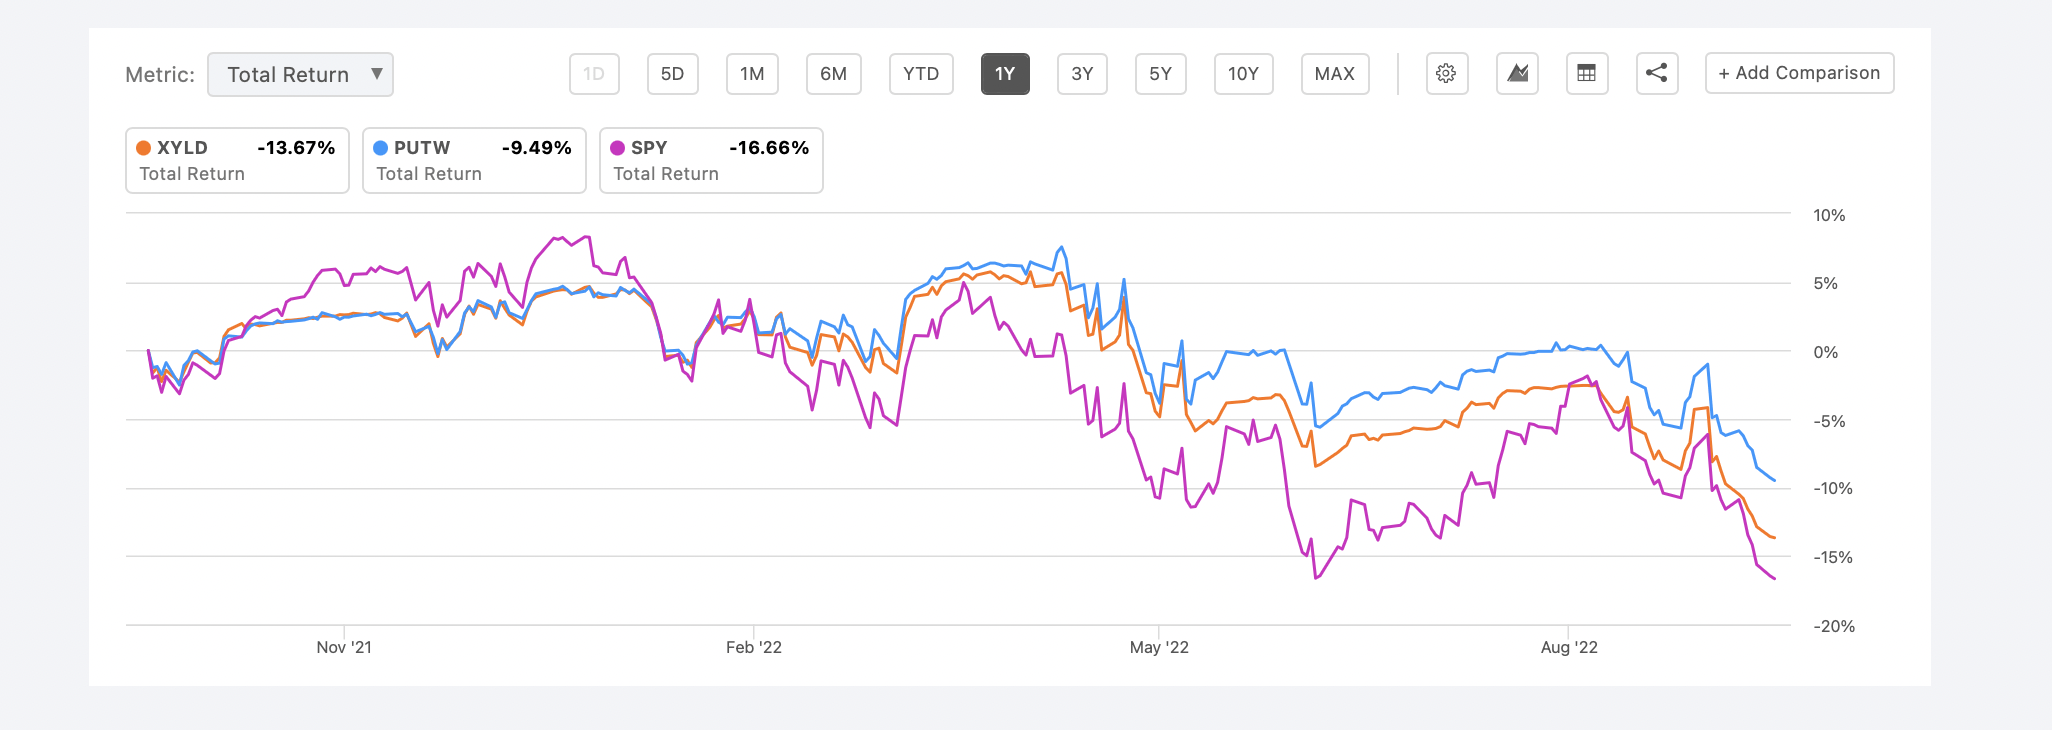
Zooming into the 1-year timeframe for these names (XYLD, PUTW, and SPY) you can see at first glance the theory holds true – with XYLD returning -13.67%, PUTW returning -9.49%, and SPY returning a whopping -16.66%.
I’d like to point out how PUTW has performed briefly, this pattern continues as we check more timeframes.
Last 6 month total return of SPY, XYLD, and SPY (Seeking Alpha)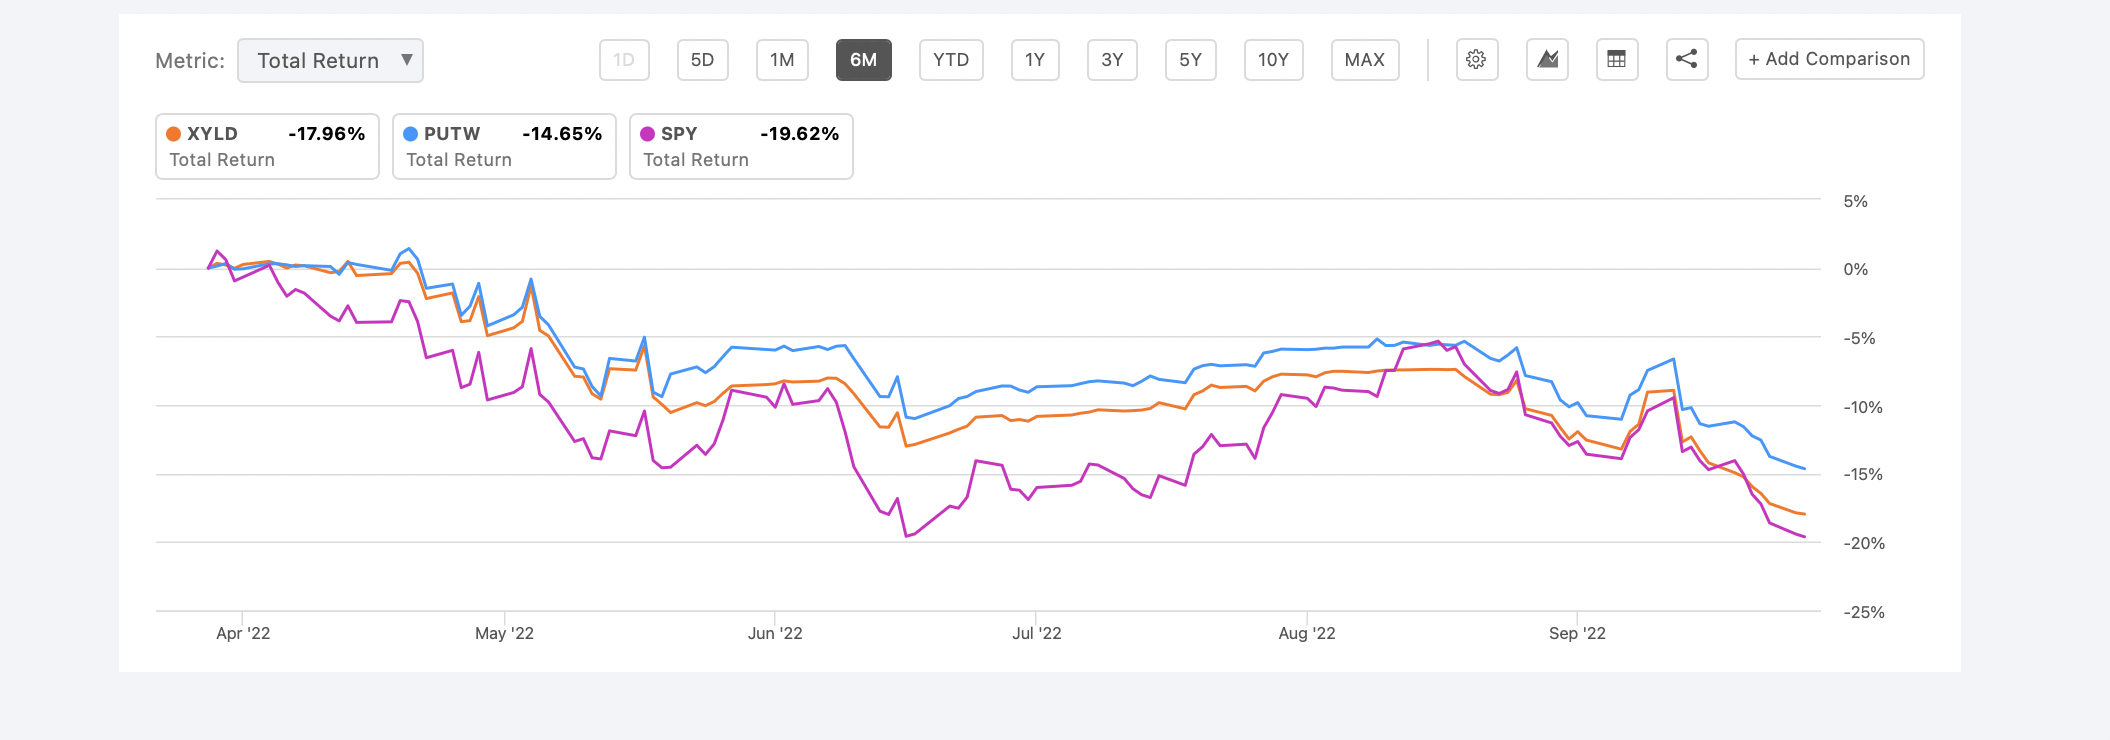
Zooming into the 6-month timeframe you have a similar story, with XYLD returning -17.96%, PUTW returning -14.65%, and SPY returning -19.62%.
This timeframe is important as it’s what I’d argue was the true start of the bear market – it wasn’t the top of the market, but when volatility expanded and issues began manifesting.
This solidifies this theory more, as it appears to be ringing true, does it not? The premium-collecting ETFs that have limited upside are outperforming as markets generally trend down.
Before moving on I’d like to once again point out PUTW has outperformed relative to the others here.
June 17th to September 27th 2022 total return of SPY, XYLD, and PUTW (SeekingAlpha)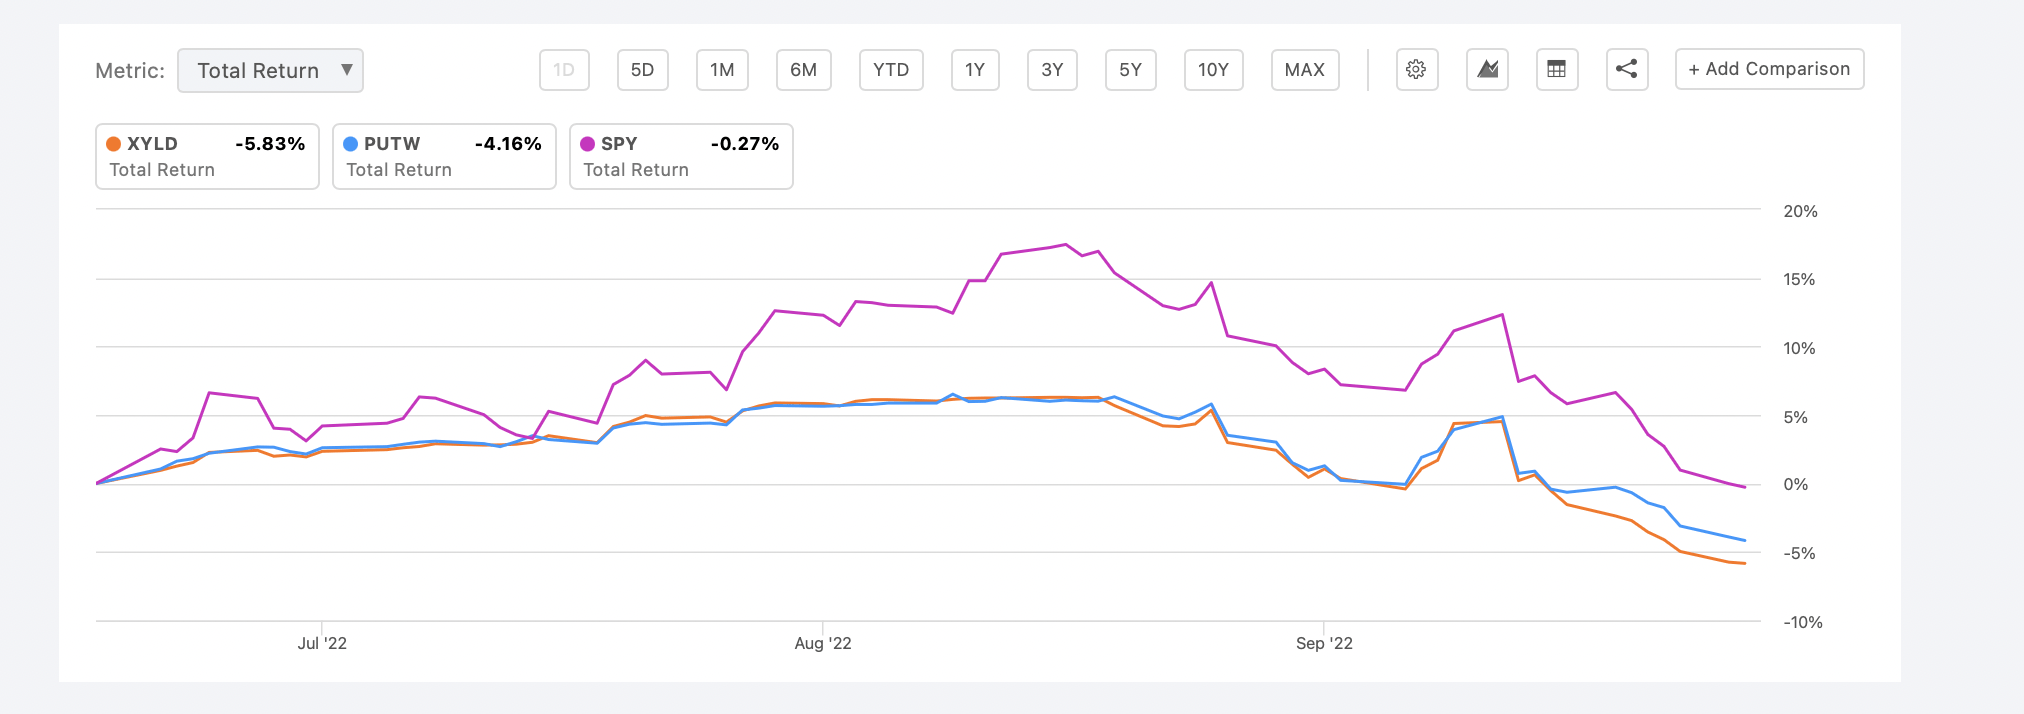
Let’s zoom in one last time – this is looking from the June 17th temporary bottom to our new fresh lows on the 27th of September market-close.
XYLD returned -5.83%, PUTW returned -4.16%, and spy returned -0.27% during this period. This demonstrates the issue with these funds – during periods of increased volatility, particularly during bear market rallies, these funds get eaten alive and actually end up performing worse than the indexes they track.
So does the Theory hold true?
Well, it’s complicated. On the surface the theory, that short-premium net-long ETFs will outperform the indexes they track in down moves is true, but when you zoom in there are clearly some issues.
The most glaring one is in just over 100 days, 102 to be precise, holding these short-premium ETFs (XYLD, PUTW) resulted in a capital loss of around 4-5% greater than that of the index they track.
This represents around 71 days of premium collection at the current IV level of the index paired with the strategy they attempt to replicate (2% OTM short calls). If SPY goes over $370~ during this period, where they’d sell the short call today, they’d once again incur losses relative to SPY.
So does this mean the theory is wrong?
Well, not really. These short-premium net-long ETFs will continue to outperform relative to their index when it comes to one-sided down moves, as they inherently have less delta-risk due to the net exposure you have per dollar invested in the funds due to the premium they collect.
However, in violent markets that have extreme volatility, such as volatile sideways markets or bear market rallies, these funds appear to get eaten up by the market.
Why does this occur?
It’s quite simple really – XYLD was created in 2013, during a time of historically low volatility, and as a result they chose to benchmark and attempt to track a flawed index (buy-write index). Similarly, PUTW was created in 2016, and thus falls into the same trap that XYLD does – selling close to the money puts.
SeekingAlpha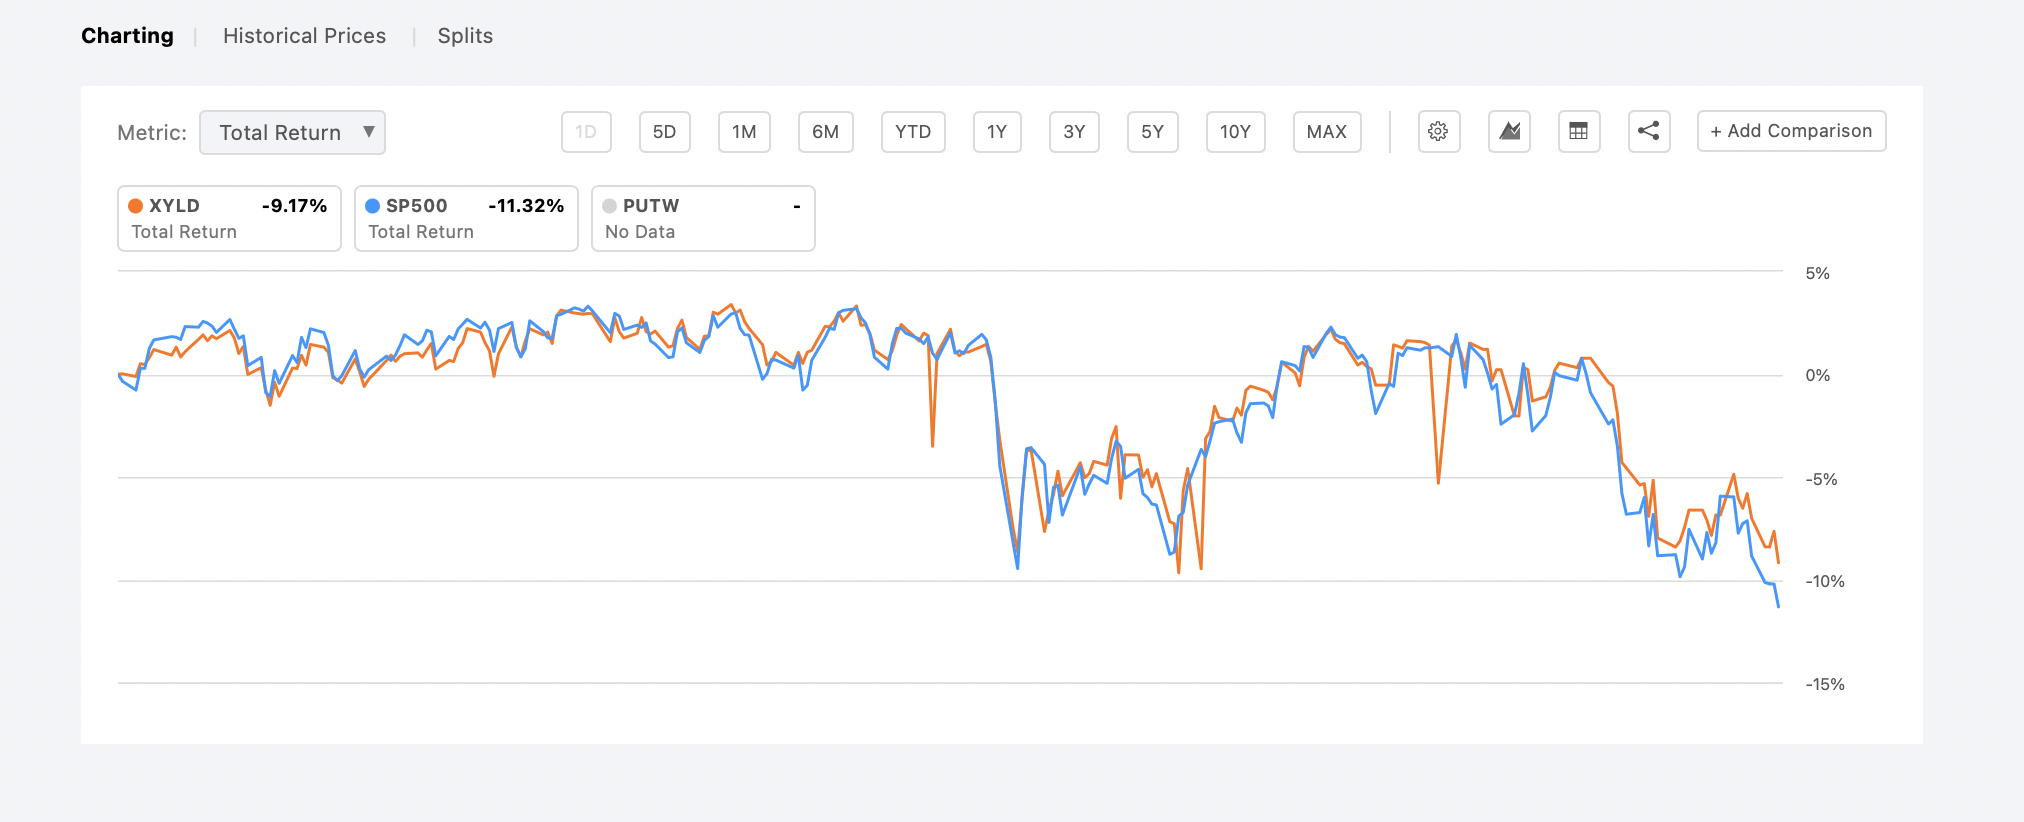
Due to being created during historically low volatility both XYLD and PUTW experience the same issue – they sell calls/puts at only 2% OTM.
While back in 2015 it was a great strategy, as shown above – with XYLD outperforming the SPY in a 1-year period from February 2015 to February 2016, times have changed.
Back then you didn’t have raging inflation, investor fear over the FED and rising rates, a war in Europe, China posturing in the east, looming debt crises in developing markets, etc.
There’s far more uncertainty today, far more risk, and more diverging opinions than ever – some people think we’ll be experiencing deflation by early 2023, and others believe the FED will be unable to get inflation under control for the foreseeable future. As a result markets have more premiums, which is good for these funds, but they also move more than back then.
tastytrade’s September 27th Closing Bell Segment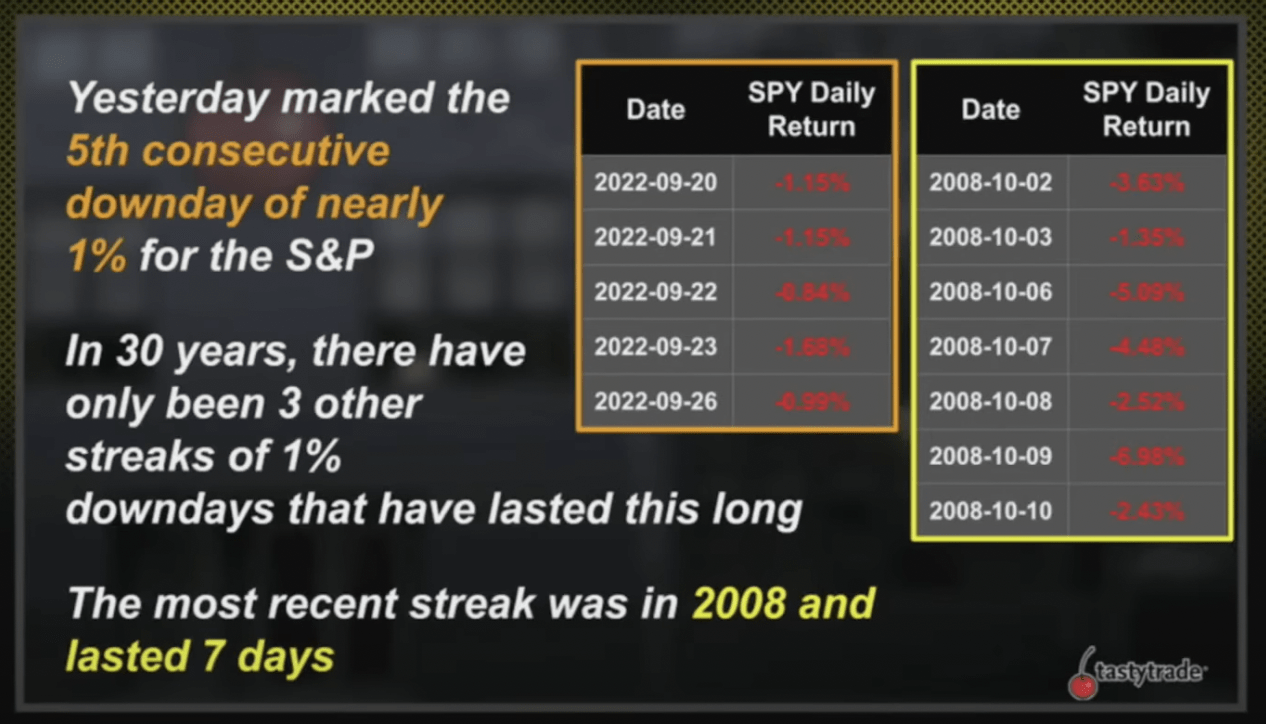
This is demonstrated great by a research piece tastytrade talked about recently, showing how volatile the market is currently. Only three other times in the last 30 years, as of the 26th of September market close, has the S&P 500 declined an average of 1% or greater on these many days consecutively – straight down.
That’s horrible for ETFs like XYLD as the larger the down-move generally the larger the relief rally will be on a percentile basis – and as XYLD operates their call-selling based on % OTM this results in excess upside risk during volatile markets.
Data-based Key Takeaways
So to wrap the presentation before going into actionable information here’s a quick summary/refresher of the points outlined above:
- Both XYLD and PUTW are likely to outperform SPY during market declines
- Both have potential risks during sideways markets and volatile markets
- PUTW seems to outperform XYLD on most timeframes – this is due to put premium generally being greater than call premiums heading prior to hitting new lows
Personal Conclusions & Takeaways
My personal takeaway is both XYLD and PUTW are not very good investment vehicles in the current environment – but if I had to pick one, I’d pick PUTW. To elaborate, say I expect the market to rally or bottom here – they’ll almost certainly underperform the index as they’re selling options well within the expected moves of the underlining holdings.
On the other side of the coin, if I’m bearish here it appears that it’d be a better choice to simply sit in cash, or very short-term T-bills, as these names are still net-long and thus will depreciation in a bearish scenario.
Worst of all, let’s pretend I’m largely market-neutral from here – and expect stocks to be more or less flat from here over the next few months. Due to both XYLD and PUTW selling well within the expected moves of the underlining I could buy in expecting to collect premium/yield only to get cut up on a short-term relief rally as we experienced from late June to August of this year – quickly followed by this move down from August to today down again – closing nearly flat over the few months, but down 4-5% if I invested in these ETFs versus SPY, cash, or short-term T-bills.
Lose-Lose-Lose.
That’s what I take away from investing in these funds. They have a nice yield, but objectively they are bad in the current environment.
So what’s the alternative?
Actionable Takeaways & Conclusions
The basic actionable takeaways from this article would be:
- Consider selling XYLD for PUTW as historically PUTW outperforms in nearly all market environments and timeframes
- Consider exiting both PUTW and XYLD entirely for either cash or SPY as the risk-reward of these ETFs appears bleak
- Consider implementing a more complex options strategy
The first two are straightforward, the last may need some elaboration if you aren’t familiar with options trading. I’ve been trading options for 5+ years and have been using it as the core of my portfolio strategy – and learned a lot so far.
One of the first things you learn is to mind the IV, the implied volatility of the underlining you’re trading and the expected move of the underlining – rather than the % move the underlining.
Why?
Well, that’s what determines your risk – not the percentage move of the stock. During low IV periods SPY may have a 2% expected move in 30 days, while in high IV periods like now SPY may have a 5%+ expected move.
I’d like to redirect those still reading to this article by Stephen Nemo that elaborates a bit on the performance of selling covered calls at specific standard deviations (which are determined by IV/expected move).
To give you the takeaway from it – 0.75-1.0 Standard-deviation moves, meaning selling calls at 75% – 100% of the expected move, have the best risk-adjusted return and CAGR over the last 30 years when he backtested different covered-call selling strategies on the S&P500 Index.
How does this differ from the 2% OTM strategy XYLD implements?
The key difference is it’s dynamic, so during high IV periods you may be selling at 4%-5% OTM while in low IV periods you may be selling at 1.5%-2% OTM. This prevents much of the whip-lash that I outlined above that makes these ETFs largely uninvestable in the current environment – while still allowing you to collect decent premiums.
This is the strategy I personally implement on most of my investments to reduce volatility, risk, and create advantageous positions overall – it has some downsides however in the long-term all the studies (tastytrade has many public on this) it outperforms all other short-premium strategies as well as simply holding the index, historically. This can always change of course.
Are there any managed alternatives?
No publicly traded ETFs or funds that I’m aware of currently implementing this strategy strictly, so if you want to implement it, you’d have to do it on your own or in partnership with your financial advisor manually in your investment account.
With that being said during the construction and fact-checking of this article we came across a solution that may interest some readers – Amplify ETF Trust – Amplify CWP Enhanced Dividend Income ETF (DIVO) which has performed similarly to the S&P500 on all timeframes while outperforming XYLD and PUTW.
The fund has less tech and more dividend stocks, however upon reviewing various timeframes this doesn’t seem to hurt performance during general bullish periods.
For certain investors they may want to research DIVO further if they want a more hands-off approach, as the fund manager decides when to sell covered-calls and at what strikes while attempting (and successfully doing so historically) to outperform the Put-Write index.
We have not thoroughly researched DIVO, so do not constitute this as an endorsement of the fund or its performance – this is merely meant to be an aide for further research.
Notable Risks to Keep in Mind
While I’ve briefly touched on them already, I want to reiterate that before acting on anything mentioned in this article make sure to thoroughly review your tax situation and how any changes will affect it.
The marginal optimizations and tradeoffs outlined in this article may not overcome the potential realization of capital gains if you’ve been holding any of the mentioned assets for a long period of time.
I’d also like to remind everyone that there is no free lunch here – this article isn’t saying there’s a pile of money sitting in the corner waiting to be picked up. It’s simply outlining the negative aspects of certain ETFs/funds strategies, particularly in the current environment, and providing some potential better alternatives. Those alternatives – that I believe are better – such as buying the stock and selling options based on the IV – such as always at 0.75 – 1 SD regardless of the percentage move this implies, are not a secret way to get extra returns.
With such a strategy your tax situation may change (advantageously or non-advantageously) and you generally net fewer premiums per month, and thus a lower yield. This is the tradeoff you pay for less volatility risk and marginally higher upside potential.
Lastly, all the strategies covered here, other than swapping for a better-performing fund, require active management on an ongoing basis and thus aren’t suitable for everyone. If you have trouble separating emotions from your investments and their performance, or simply have a busy life, managing the strategy on your own is likely not worth the risk and time commitment.
Conclusion
With that being said that’s all I can give on this topic.
I rate XYLD a hold, which according to my ratings means I would not invest in it or continue to hold positions in it, but I do not see a short opportunity in the stock relative to the broad market.
Be the first to comment