

Dilok Klaisataporn
Many investors today are looking for high-yielding investments that deliver consistent dividend income. This trend has driven many investors to buy assets, or investment products, with high yields and equally high financial risk. As the U.S. and global economy face growing deterioration, many investors may find these previously “safe” products operate by sacrificing a high yield for high tail-risk exposure.
One investment product that has become very popular among many income investors is covered call ETFs, such as the S&P 500 covered call fund (NYSEARCA:XYLD). On the surface, XYLD and its peers may seem to be a great income strategy, given its 13% TTM yield. However, in the event of a long-lasting bear market, covered call ETFs are likely to hemorrhage capital, potentially until most of their value is lost. Additionally, they should absolutely not be seen as delivering a stable income level, as in the case of most dividend stocks and bonds. Their income level is unstable because option premium yields are tied to capital, so if capital declines in value, option premium earnings will also. In my view, this significant risk factor should be understood by retired investors or those who rely on a steady income stream.
I warned about XYLD’s risk in January in “XYLD: A 9% Yield Is Far From A ‘Free Lunch’ When It Comes To Covered Calls“, as was among a small handful of analysts covering the fund’s risks. XYLD has declined 20% since then, creating 13.2% in total losses after dividends. In my view, XYLD’s falling pattern has only begun and, given XYLD’s mechanics and the economic trend, may face much more considerable losses in the coming months. With this in mind, I believe it is a good time to take a closer look at the ETF to illustrate its risk factors clearly.
Not All Dividends Are The Same
In general, covered call strategy funds are a newer concept and were not popular during the last large bear markets, such as 2000 and 2008. With this in mind, many investors may not understand the risk exposure in covered call strategies. Over the long-run, covered call strategies are expected to deliver similar total returns to the underlying index – in XYLD’s case, the S&P 500. However, it is virtually guaranteed that, in the long run, a covered call strategy will cause capital decay.
XYLD’s capital has been roughly flat since its inception, but there have been no long-term bear markets. A rapid decline, such as that of 2020, is not likely to cause much capital decay, since XYLD loses during bear market rallies. This mechanic can be seen in XYLD over the past year:
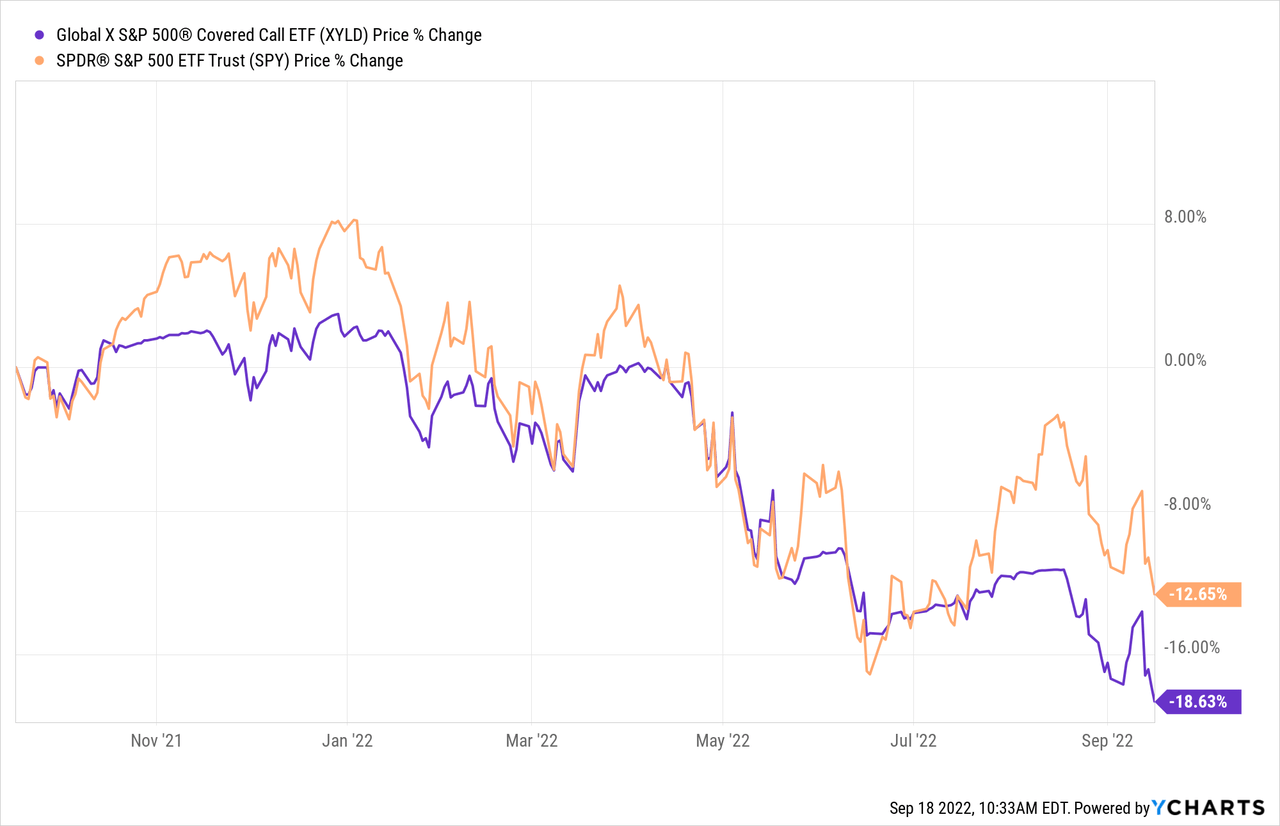
XYLD falls just as much when the market declines, since it has no downside protection against the market. After considering dividends, XYLD has some very moderate downside protection, given premiums temporarily rise during market declines. However, this buffer usually only reduces decreases by 1-2% during a crash (so a rapid 10% decline in the S&P 500 may cause an 8-9% total decline in XYLD after dividends).
More importantly, XYLD’s capital can decay rapidly during prolonged bear markets. As seen in the chart above, XYLD declines with the S&P 500, but does not rise much during bear market rallies. Over time, this factor causes XYLD’s capital to decline. If investors reinvest dividends into XYLD, then total returns should still be near the S&P 500. However, investors who withdraw XYLD’s dividend should expect their capital to decay toward zero eventually. Many may not know this risk since XYLD’s capital has been supported by a rising market. However, if we create a ratio chart of XYLD’s price to the S&P 500, we can see its decaying value:
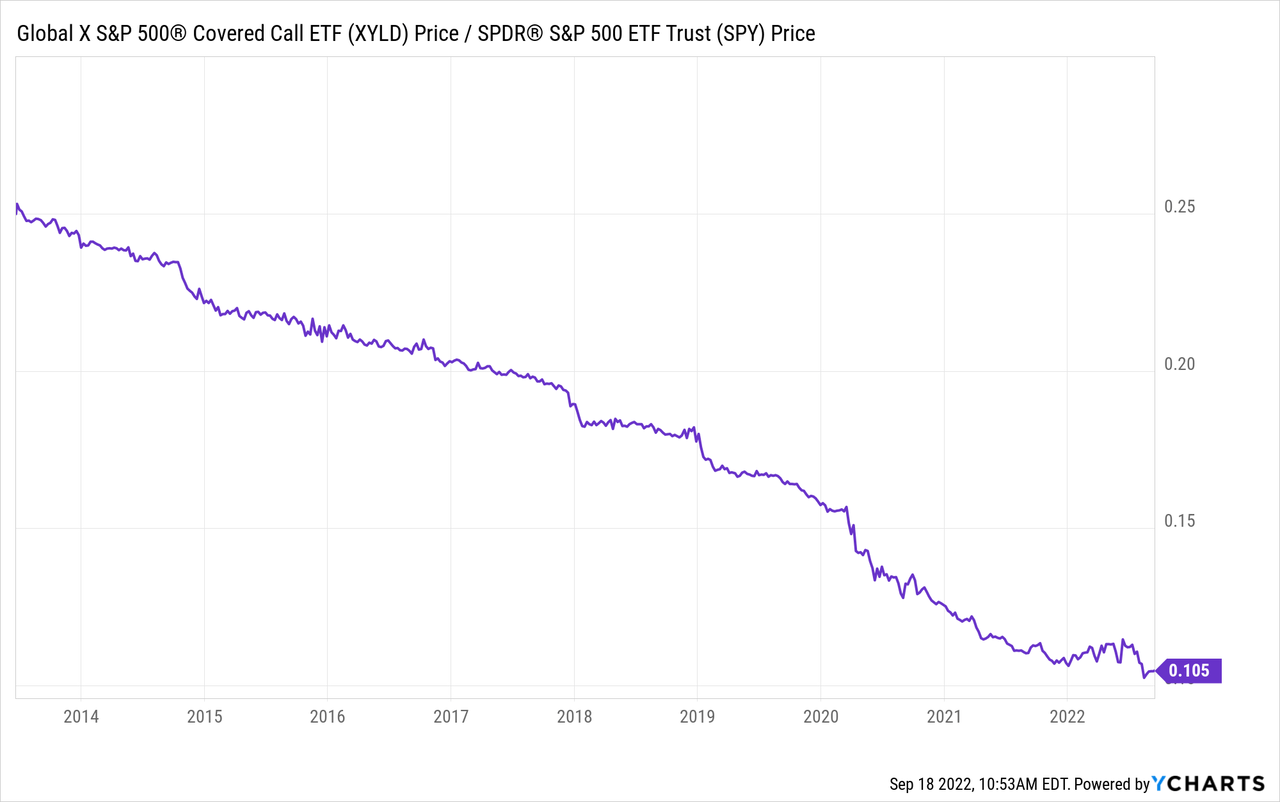
Note that XYLD’s decay pace rises during bear markets such as 2020. Given the nature of covered calls (limiting bear market rallies), the decay pace is likely to be more aggressive during extended bear markets. In my view, given the ongoing bear market, we may begin to see more significant permanent declines in XYLD’s capital.
XYLD’s dividend has remained consistent since the fund has not faced capital decay. However, if there is an extended bear market and XYLD’s price permanently declines, its dividend will eventually drop by the same extent. For example, if XYLD’s price fell from $40 to $20, its annual dividend would likely decline from $5 to $2.5. This is because monthly option premiums are usually 1-2% of invested capital (depending on volatility and strike price), so if invested capital declines, the received premium will also. This factor makes XYLD different than a bond, preferred stock, or high-quality dividend stock, which usually sees dividends remain flat if asset prices decline.
These factors are not necessarily crucial for those investors planning to reinvest dividends into XYLD. However, many investors in XYLD may retire or depend on a steady income stream. XYLD may have a substantial income stream during bull markets, but its dividend (and price) are likely to decline permanently during extended bear markets, unlike traditional stock ownership. In my view, it is crucial that XYLD investors fully understand these risk factors and do not buy the fund simply due to its historical performance – mainly because it has not been tested during an extended bear market.
Stocks Are Likely In An Extended Bear Market
There are no certainties in markets, but a plethora of data and trends point to a lower stock market. Stocks fell during the first half of 2022 and rose over recent months as the inflation outlook moderated with lower crude oil prices. However, stocks have faced another wave of declines following August’s CPI data that suggested inflation may be more sticky than previously expected. Additionally, many long-term economic indicators have very negative signals, including consumer sentiment, the yield curve, and the manufacturing PMI:
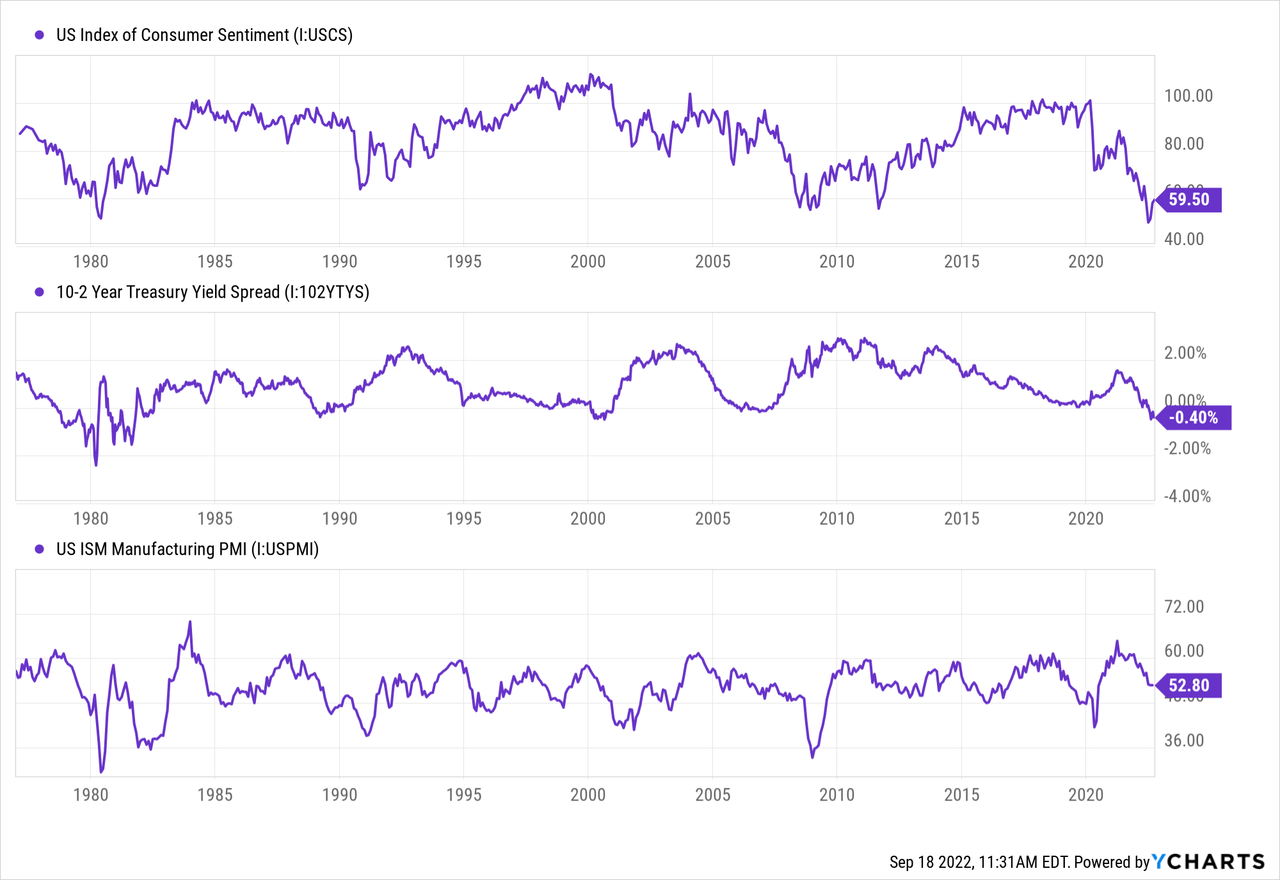
Consumer sentiment tells us about consumer strength, the manufacturing PMI informs us about business strength and the yield curve signals banking strength. It is historically rare for all these measures to have an unfavorable position. In the case of 2008, consumer sentiment was weak while the Federal Reserve stimulus caused a rapid curve steepening, which benefited banks and businesses. Banks and other companies had a more difficult time in the 2000 recessionary period, but consumer sentiment was strong as internet innovation proliferated. Consumer sentiment was also high around 2017-2020 (pre-lockdown) while there was a slowdown in banks and businesses. Still, as in 2008, Fed stimulus during the lockdown created a rapid recovery, but there was no lasting recovery in consumer sentiment.
The beneficial impact of the immense Federal Reserve stimulus seems to be over as the yield curve rapidly returned toward inversion after 2020 steepening, and the manufacturing PMI has declined. With the pace of quantitative tightening accelerating in September and beyond, I expect deterioration to continue to grow for banks and businesses. Consumer sentiment has risen slightly from extreme lows, but is unlikely to recover more due to sticky consumer price inflation.
Overall, this situation is very similar to the late 1970s and early 1980s – the last period in which all three indicators were negative. Unsurprisingly, this was also the last period where inflation was near (or above) double-digits and was driven predominately by supply-side factors. During that period, the Federal Reserve’s efforts to lower consumer demand (to end shortages) had to become very aggressive. Importantly, there is very little the Fed, or government in general, can do to fix declines in overseas production, meaning it must act to reduce consumption in order to moderate prices.
In my view, this economic situation does not bode well for the stock market, since rising costs make it difficult for companies to maintain profit margins. Initially, companies were able to pass costs onto customers, but the collapse in real wages and savings implies people are unlikely to pay higher prices – meaning many companies will likely see margins or sales decline. Stock prices are ultimately tied to earnings outlooks. I do not believe most investors or analysts have priced in the potential long-term earnings decline that may occur as a wage-price spiral grows or if interest rates remain higher for longer.
The Bottom Line
I believe XYLD is a generally poor investment that may be unsuitable to many income investors. XYLD’s dividend and capital will likely face permanent declines if the stock market’s bear market lasts much longer, as covered calls “cap” gains from bear market rallies. This factor may not be essential for XYLD investors who plan to reinvest dividends, but those withdrawing dividends may soon find the income-stream declines dramatically.
The stock market may face a lasting rebound that protects XYLD’s capital and dividend. That said, looking at economic and financial trends facing consumption, business activity, and banking, I believe it is clear that the economy is in a stagflationary environment. This environment usually means employment levels may remain higher even as the economy slows, and profit margins collapse (see wage-price spiral). Even more, if global events cause shortages to continue growing, this trend may become more aggressive. In my view, this economic situation is necessary for the U.S. economy’s long-term health (since inflation reduces debt indirectly and promotes domestic manufacturing) but will likely cause a long-term decline in financial asset valuations. Additionally, I believe the mechanics of covered-call investing give XYLD greater negative exposure to this potential.
Be the first to comment