

Luke Chan/iStock via Getty Images
Investment Thesis
- XP Inc. (NASDAQ:XP) is the largest independent broker in Brazil, providing a comprehensive financial service platform.
- Since writing about XP back in April, the company’s stock has decreased by 27.81%.
- I continue to rate XP as a buy: the company has managed to create its own ecosystem and has established a strong brand image within the Brazilian Investment Banking and Brokerage Industry. Although XP has shown relatively low growth rates in 2Q22 as compared to 2Q21, I remain optimistic in regards to its future growth prospects. Furthermore, I consider the current valuation of the company to be attractive.
- However, due to relatively high risk factors, for example in regards to currency risk, I would limit my XP position to a maximum of 1.5% of a total investment portfolio.
- The HQC Scorecard demonstrates that XP is only moderately attractive in terms of risk and reward: XP receives an overall rating of 49/100. In terms of Growth (100/100), the company is rated as very attractive. It achieves an attractive rating in the categories of Valuation (68/100) and Expected Return (60/100). For Economic Moat (43/100) and Profitability (50/100), XP is rated as moderately attractive. When it comes to Financial Strength (35/100), the company receives an unattractive rating.
Industry Overview
In a previous article about XP, I gave an industry overview of the Brazilian banking sector and mentioned that the following five largest banks divide the market share among themselves: Itaú Unibanco (ITUB), Bradesco (BBD), Banco do Brasil (OTCPK:BDORY), Caixa Econômica Federal, and Banco Santander Brasil (BSBR).
Furthermore, I explained that:
“According to Reuters, these banks hold 82% of all assets in Brazil. Comparatively, the five largest banks in the U.S. hold just 43% of all assets in the country. These percentages show the extreme concentration of the Brazilian banking sector. Through its expansion strategy, XP is directly expanding into the business of traditional banks.”
XP’s Competitive Advantages
In my previous analysis on the company, I also explained in more detail that XP’s creation of its own ecosystem and the strong brand image it has managed to establish in Brazil contribute to the company’s competitive advantages over its opponents:
“XP seeks to integrate further individual clients, institutional clients, corporations, and independent brokerage firms on its investment platform. In this way, the company creates a network effect, which will help them to increase their revenue. XP has managed to build a strong brand in Brazil. According to Interbrand, XP is currently the 11th most valuable brand in Brazil.”
XP 2Q22 Results
XP’s total gross revenue grew by 13% when comparing the results of 2Q22 (R$3.6 billion in revenue) with 2Q21 (R$3.2 billion in revenue). This growth was primarily driven by its Retail business, while showing a growing contribution from Fixed Income products and Float revenues.
However, the adjusted EBITDA decreased by 2% YoY, which was mainly driven by higher selling, general and administrative (SG&A) expenses due to investments in new verticals as well as internal advisors.
Andre Martins, XP’s Head of Investor Relations, said the following in response to the company’s 2Q22 results:
“We know we are in a tough macro environment with the bear markets, and that has an impact on the investment business, especially, but despite this tough macro environment, we were able to deliver our all-time high record quarterly revenues,”
XP has a 1 Year Price Performance of -58.97% while the Sector Median is -4.04%.
XP’s 2Q22 results strengthen my belief that you should only invest a very limited amount of your total investment portfolio if investing in the company.
Overview: XP
|
XP |
|
|
Sector |
Financials |
|
Industry |
Investment Banking and Brokerage |
|
Market Cap |
$11.03B |
|
Revenue [TTM] |
$2.44B |
|
Revenue 3 Years Growth Rate [CAGR] |
60.54% |
|
Revenue 5 Years Growth Rate [CAGR] |
57.00% |
|
EPS Diluted 5 Years Average Growth Rate [FWD] |
35.69% |
|
Gross Profit Margin |
71.94% |
|
Return on Equity |
25.57% |
|
P/E GAAP [FWD] |
15.41 |
|
EPS [FWD] |
1.23 |
|
Dividend Yield [FWD] |
0% |
Source: Seeking Alpha
XP’s Valuation
Discounted Cash Flow [DCF]-Model
In terms of valuation, I have used the DCF Model to determine the intrinsic value of XP. The method calculates an intrinsic value of $22.72 for the company. The current stock price is $19.69, which results in an upside of 15.40%.
XP’s Average Revenue Growth [FWD] Rate over the last 5 Years is 39.19%. I’ve made more conservative assumptions for the company with my DCF Model by assuming a Revenue Growth Rate of 20% and EBIT Growth Rate of 25% over the next 5 years. Furthermore, I assume a Perpetual Growth Rate of 4%. I have used its current discount rate [WACC] of 5.99% and Tax Rate of 18%. Furthermore, an EV/EBITDA Multiple of 11x was used, which is the company’s latest twelve months EV/EBITDA.
Based on the above, I calculated the following results:
Market Value vs. Intrinsic Value:
|
Market Value |
$19.69 |
|
Upside |
15.40% |
|
Intrinsic Value |
$22.72 |
Source: The Author
Relative Valuation Models
XP’s P/E [FWD] Ratio
XP’s P/E Ratio is 15.41, which is 39.38% above the sector medium (11.05), which provides us with an indicator that the company is currently overvalued.
Hypothetical Dividend Projections
XP currently doesn’t pay a dividend. In the table below you can see what the company’s annual dividend and dividend yield would be if it was to pay one. The annual dividend and dividend yield are based on XP’s next fiscal year EPS estimate multiplied by hypothetical payout ratios:
|
EPS [FWD] |
Payout Ratio |
Annual Dividend |
Dividend Yield |
|
1.23 |
10% |
0.12 |
0.62% |
|
1.23 |
20% |
0.25 |
1.25% |
|
1.23 |
30% |
0.37 |
1.87% |
|
1.23 |
40% |
0.49 |
2.50% |
|
1.23 |
50% |
0.61 |
3.12% |
Source: Seeking Alpha
XP According to the Seeking Alpha Factor Grades
According to the Seeking Alpha Factor Grades, XP is rated with a D- in terms of Valuation and a B+ in regards to Growth. For Profitability, the company gets a D- rating. For Momentum, it gets an F and for Revisions a C-.
Source: Seeking Alpha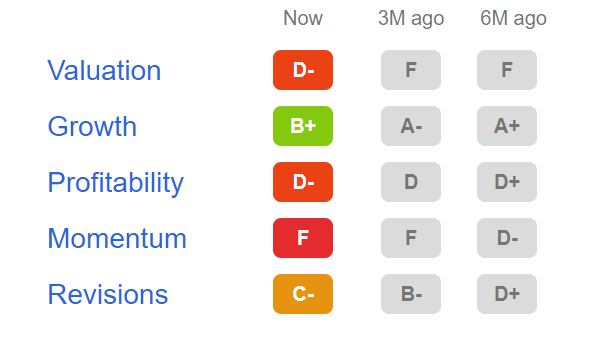
XP According to the Seeking Alpha Quant Ranking
The Seeking Alpha Quant Ranking puts XP in 24th position (out of 25) within the Investment Banking and Brokerage Industry, and 639th (out of 651) within the Financials Sector.
Source: Seeking Alpha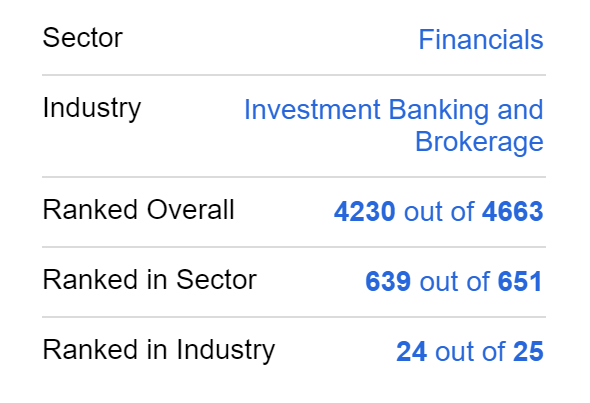
This low ranking as according to the Seeking Alpha Quant Ranking, backs up my theory of only investing a very limited portion of your investment portfolio in XP if you decide to invest in the company.
XP According to the Seeking Alpha Quant Rating
According to the Seeking Alpha Quant Rating, XP is rated as a sell.
Source: Seeking Alpha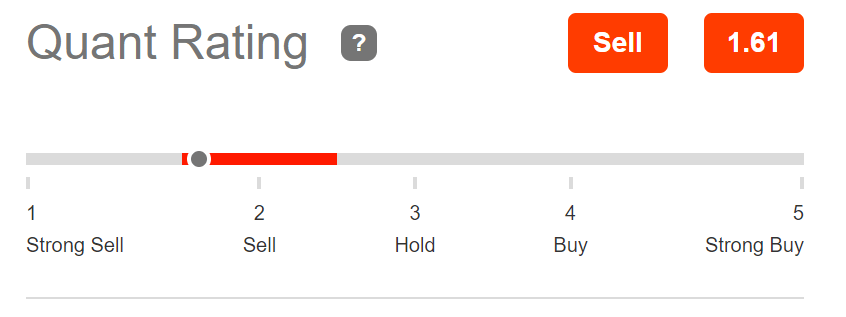
The High-Quality Company [HQC] Scorecard
“The HQC Scorecard aims to help investors identify companies which are attractive long-term investments in terms of risk and reward.” Here, you can find a detailed description of how the HQC Scorecard works.
Overview of the Items on the HQC Scorecard
“In the graphic below, you can find the individual items and weighting for each category of the HQC Scorecard. A score between 0 and 5 is given (with 0 being the lowest rating and 5 the highest) for each item on the Scorecard. Furthermore, you can see the conditions that must be met for each point of every rated item.”
Source: The Author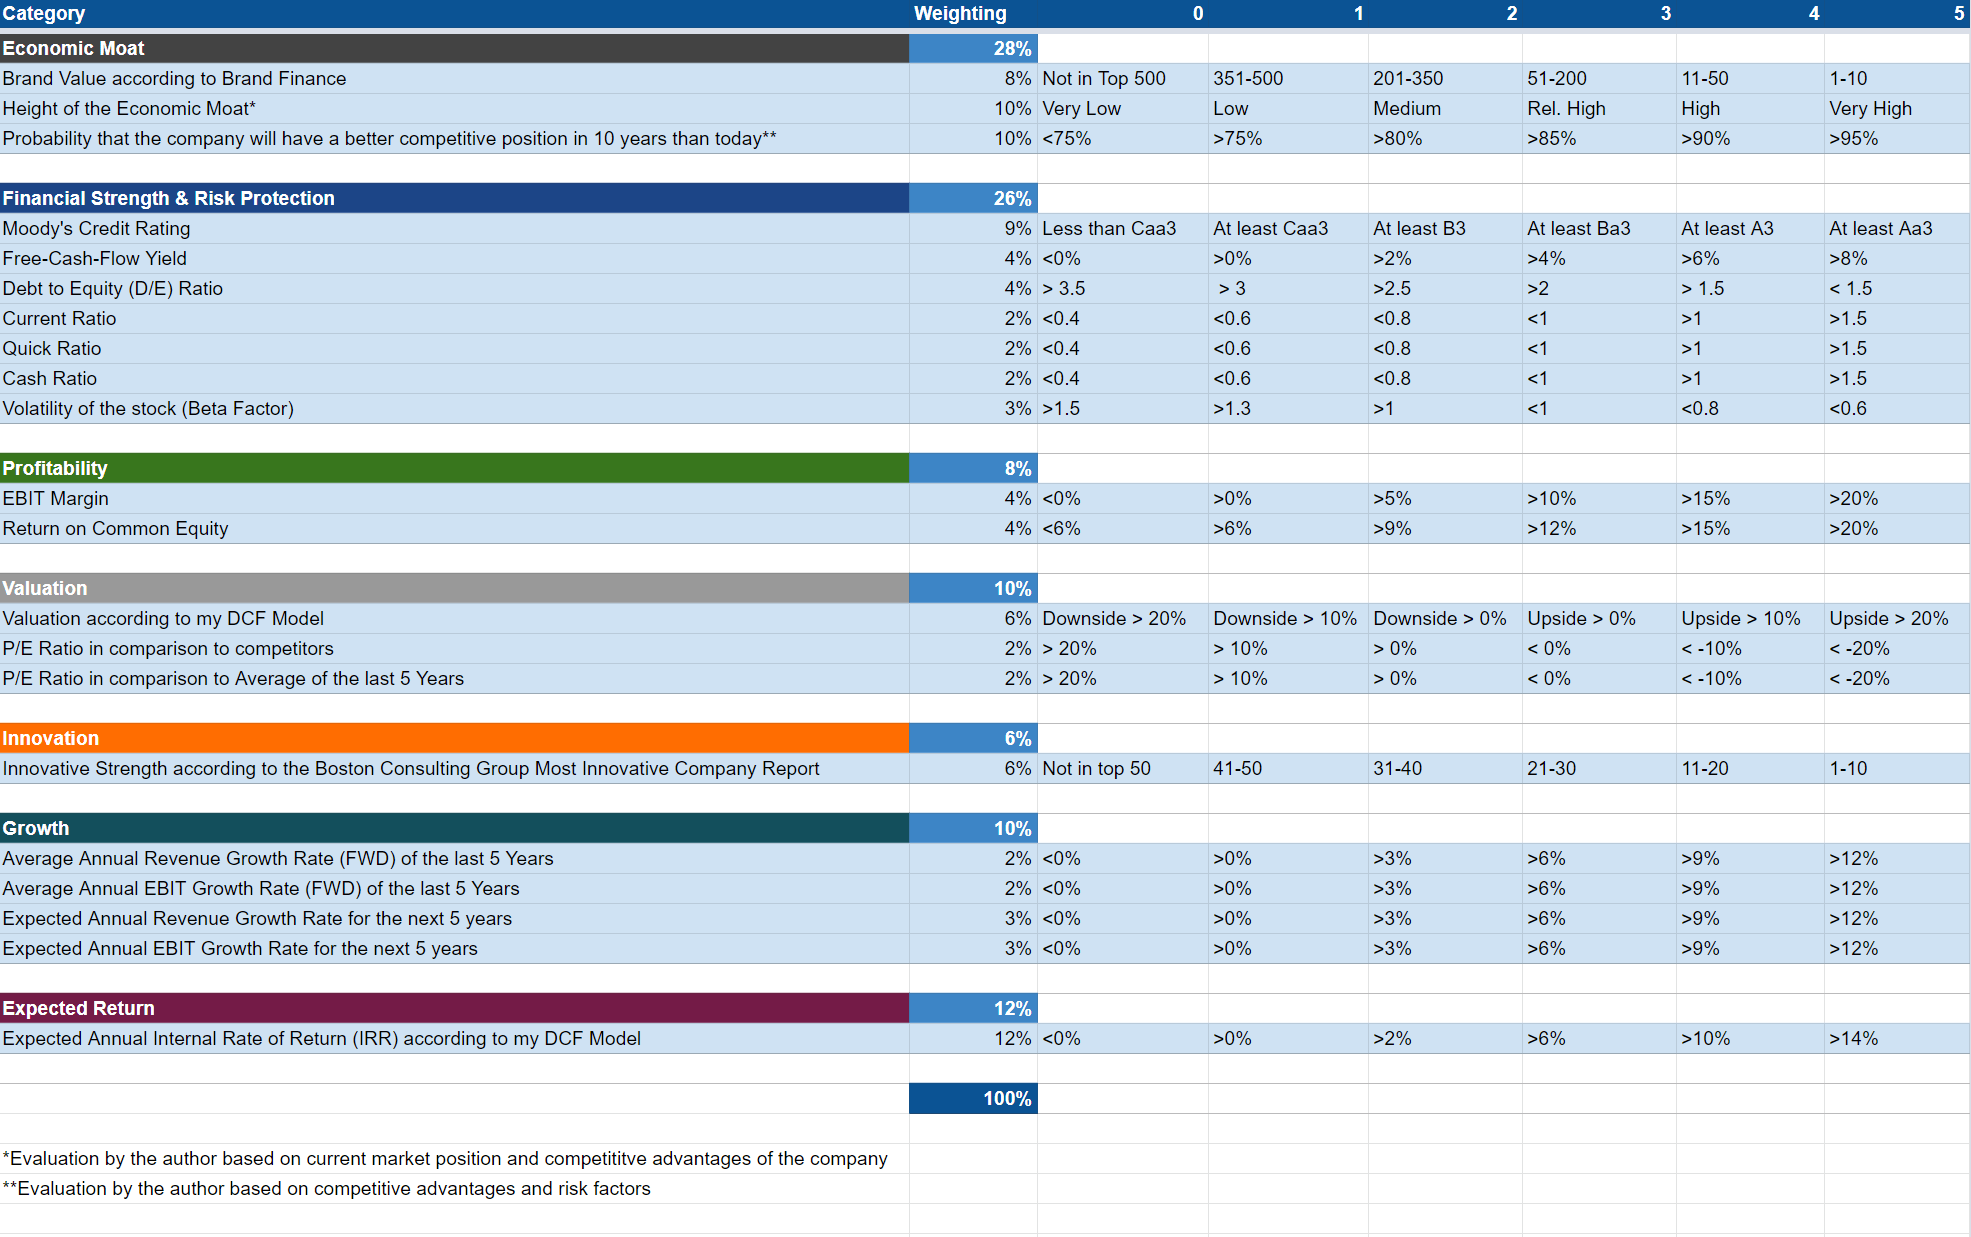
XP According to the HQC Scorecard
Source: The Author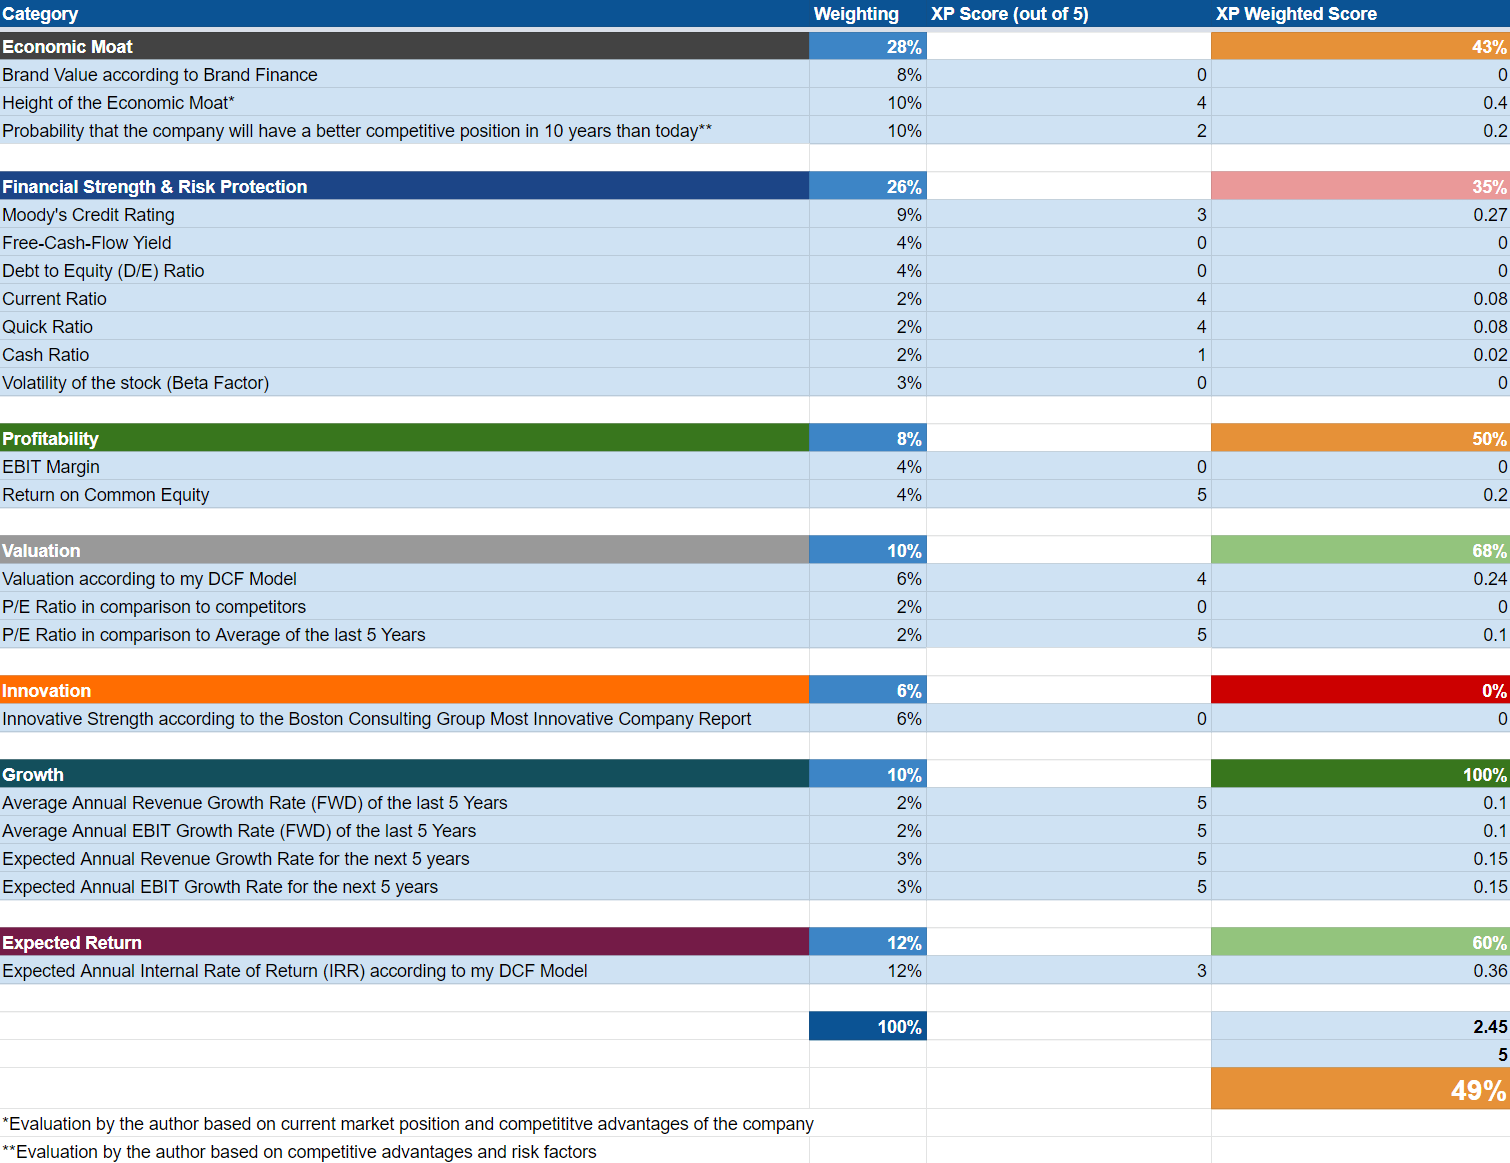
According to the HQC Scorecard, XP receives an overall score of 49 out of 100 points. This overall score means that the company can currently be classified as moderately attractive in terms of risk and reward.
The HQC Scorecard indicates that XP is rated as very attractive in the category of Growth (100/100). In the categories of Valuation (68/100) and Expected Return (60/100) the company is rated as attractive. For Economic Moat (43/100) and Profitability (50/100), XP is rated as moderately attractive. For Financial Strength (35/100), XP receives an unattractive rating.
Despite XP’s overall rating being only moderately attractive in terms of risk and reward; the very attractive rating for Growth along with an attractive rating for both Valuation and Expected Return, contribute to my buy rating on the XP stock. However, the only moderately attractive rating for Economic Moat and Profitability as well as an unattractive rating for Financial Strength, bolster my belief that I would not overweight the XP position in an investment portfolio.
Risk Factors
In my previous analysis on XP, I explained that I see the following as being one of the main risks regarding an investment in the company:
“A potential depreciation of the Brazilian real represents a risk for the investor. In particular, continued elevated inflation in Brazil could cause the real to depreciate against the dollar in the future. According to the Brazilian Institute of Geography and Statistics (IBGE), the inflation index of the country was 10.06% in 2021. This was the highest inflation rate in Brazil since 2015, when it was at 10.67%, in accordance with the IBGE.”
Furthermore, I explained that I see the intense competition with fintech companies and with companies such as BTG Pactual, one of its main competitors, as additional risk factors to consider when investing in XP:
“In my opinion, the increasing competition from digital banks and fintech companies is one of the major threats to XP. The digital bank Nubank (NYSE:NU), backed by Warren Buffett, has more than 40 million customers and also offers a zero-fee credit card, directly competing with XP’s own credit card. One of XP’s main competitors in the brokerage business is BTG Pactual, which has been growing continuously in recent years and is investing strongly in its digital retail bank. In 2021, BTG Pactual generated revenues of BRL 13.9 billion, up 49% compared to 2020, making the company a strong and rapidly growing competitor.”
All of the risk factors mentioned above solidify my opinion in regards to limiting the XP position to a maximum of 1.5% of a total investment portfolio.
The Bottom Line
Depending on which valuation method is used, the results of the method can vary. As according to my DCF Model, XP is currently slightly undervalued. This model shows an intrinsic value of $22.72 for the company, resulting in an upside of 15.40%. However, Relative Valuation Methods such as the P/E Ratio show us that XP is currently overvalued: XP’s P/E Ratio is 15.41, which is 39.38% above the sector medium (11.05).
The HQC Scorecard demonstrates that XP is currently moderately attractive in terms of risk and reward. The Scorecard rates the company as very attractive in the category of Growth and attractive in the categories of Valuation and Expected Return. In terms of Economic Moat and Profitability, XP is rated as moderately attractive. Finally, in the category of Financial Strength, an unattractive rating is given.
I continue to rate XP as a buy: the company has built an economic moat by establishing a complete ecosystem and developing a strong brand image in Brazil. However, due to the relatively high risk factors (such as currency risk and the intense competition with digital banks and other fintech companies), I would recommend only investing a maximum of 1.5% of your investment portfolio in XP.
Be the first to comment