

ArtistGNDphotography/E+ via Getty Images
If we pull up a long-term chart of SPDR S&P Oil & Gas Exploration & Production ETF (NYSEARCA:XOP), we see that the crossing over of the 10-month moving average above the corresponding 50-month average earlier this year confirmed a bull market. However, with shares being unable to take out long-term overhead resistance (as we see below) in this bull run over the past 2.5+ years, and with the 10-month moving average being tested once more in this recent down move, sentiment all of a sudden has gotten very bearish in this play.
We see this through the very high short-interest ratio in the fund at present. Despite the fact that investors are betting on a sustained down move happening in the fund over time, contrarians on the other hand may interpret the high ratio as a bullish sign. Suffice it to say, any up-move in XOP from present levels could result in short-sellers having to repurchase their shares back (bullish) at an accelerated clip.
XOP Technical Chart (Stockcharts.com)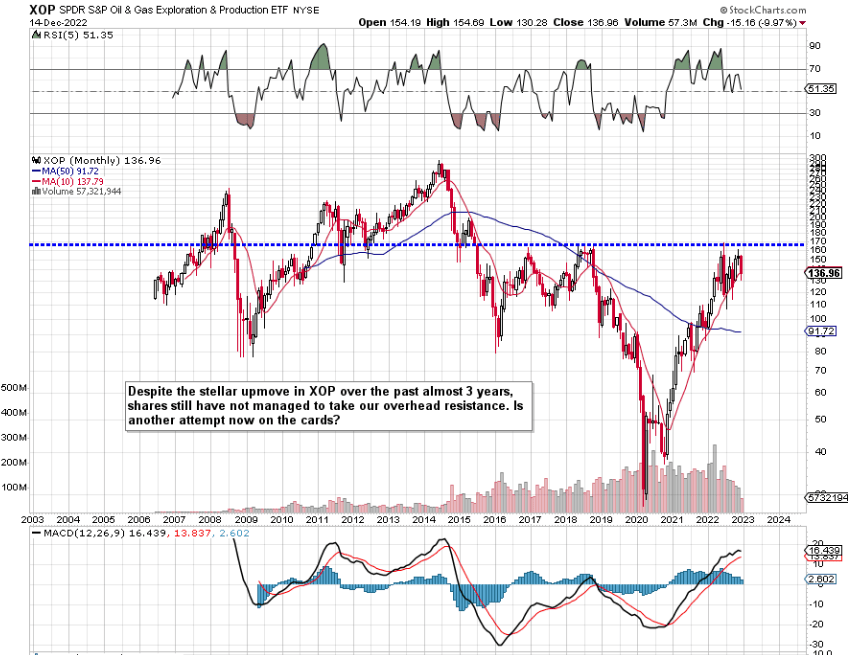
Suffice it to say, to reiterate the above point, the only issue regarding the long-term technicals at present is that overhead resistance has not been taken out. We actually decided not to play the recent downside move in XOP for this very reason (We only swing trade in the direction of the underlying trend). If we continue on to a more near-term chart, we see that shares bottomed last week close to $130 a share. Bulls now need shares to push on from present levels where a crossover of the MACD moving average followed by an ADX buy signal would definitely add weight to the continuation of the bull run in XOP.
XOP Daily Chart (Stockcharts.com)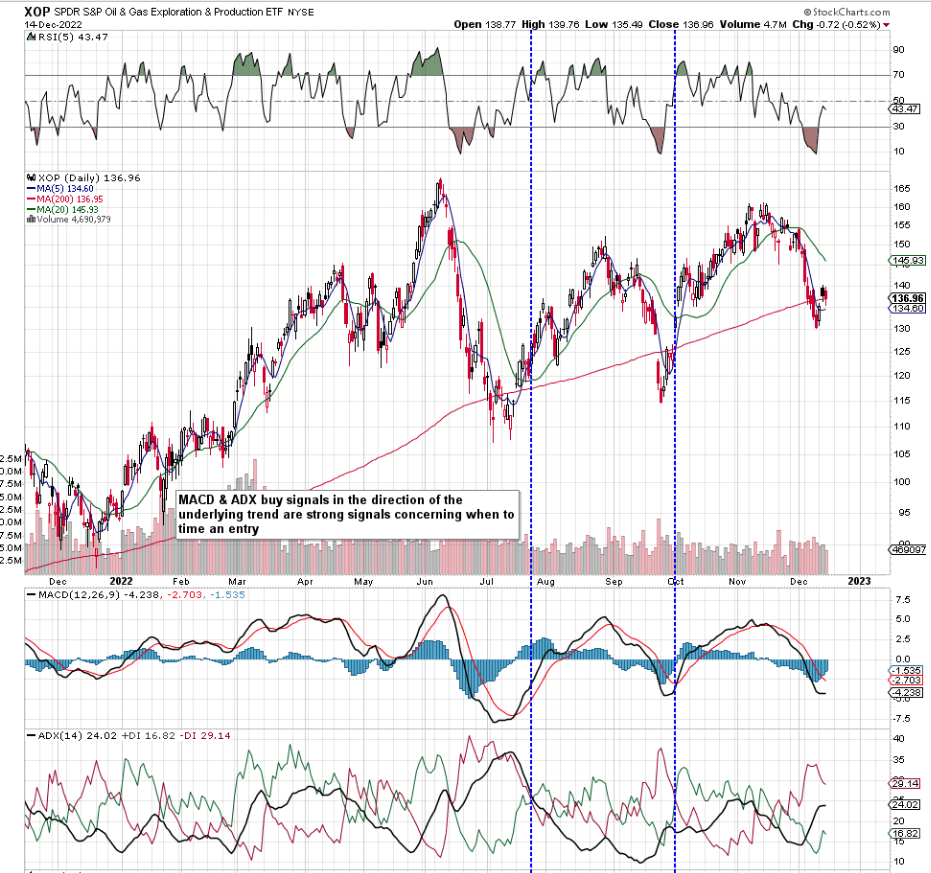
Therefore, if we can get more traction here over the near term, we may put on something like a debit call spread for the portfolio which is a direction-based option strategy. Why we would favor this strategy over buying stock? Here are some reasons why.
Vega
The first reason is implied volatility. As we can see below from XOP’s implied volatility chart, IV is trading well below its 52-week average at present and slightly off its 52-week lows. Since a debt spread involves the purchase of options, it is beneficial for option traders to buy options when IV is low because the value of options increases when IV rises all things remaining equal. This means we could be directional wrong (XOP could go lower) but we could still make money on any potential position due to the fund’s implied volatility working in our favor.
XOP: Low 52-week IV Rank (Interactive Brokers)
Theta
The other reason is theta or time decay. By buying a call spread, we are selling a call option that is higher that the purchased strike price. Now, the trick here is to collect more extrinsic value on the sold call as opposed to the amount of extrinsic value we buy with the purchased call. How does this benefit us? Well, extrinsic value or time value is the percentage of the options premium that is not intrinsic. Suffice it to say, the only way an XOP option or debit spread has value at expiration is if it has intrinsic value. Therefore by collecting extrinsic value in a debit spread instead of paying for it, we essentially have time working for us due to the time premium consistently coming out of those options the closer we get to expiration.
The Directional Lie
The thing though is that most swing traders try to ascertain where shares of a fund like XOP are headed by focusing on the technicals (which we have done above) and fundamental factors such as recent asset flows. Incidentally, asset flows have increased by 23%+ over the past 30 days which is well ahead of the average increase funds have seen over the same time frame (13%+).
However, trying to predict direction is very difficult consistently even if one gets the timing right with their entry. In the options world, movements in the share price correspond with moves in Delta but this greek is not the only way to make money EVEN in directionally-based trades. In fact, one can be directionally wrong but still can come out winning because the losses from the delta component of the trade can be made up for through gains from the likes of the Vega & Theta greeks.
Conclusion
Although short interest is sky-high in XOP at present, shares of the fund are trying to regain their 200-day moving average at approximately $136 a share. There still has not been long-term technical damage afflicted to the fund despite the recent downtrend. We look forward to continued coverage.
Be the first to comment