

Tom Werner/DigitalVision via Getty Images
Investment thesis: The ETF has sold-off in reaction to a bearish Fed. Sell this ETF for now.
Due to the rise of data showing that active management performs poorly over the long term, investors now use ETFs as the backbone of most portfolios. These funds allow investors to target broad sectors of the market, like the XLY, which tracks the consumer discretionary sector. The NYSEARCA:XLY is issued by State Street Global Investors and is the largest ETF tracking the consumer discretionary sector. Here are the ETF’s 10 largest holdings:
XLY 10 largest holdings (State Street Global Investors)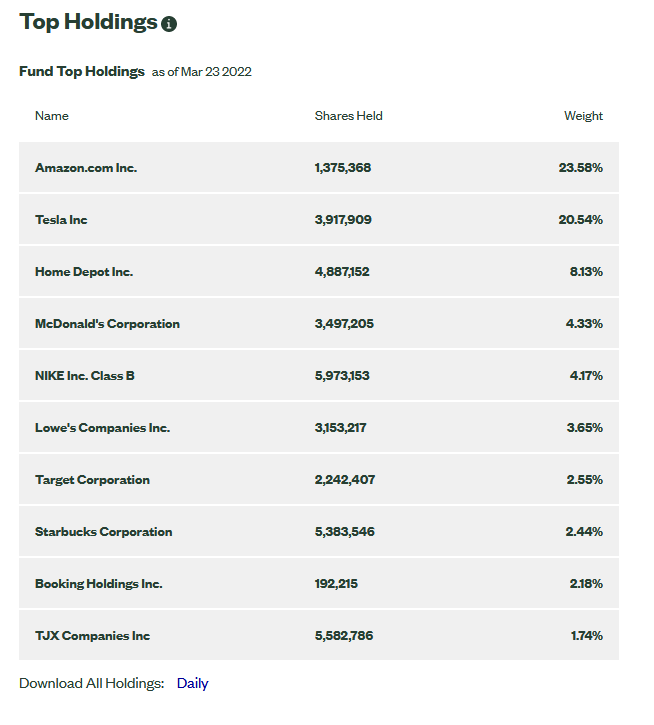
My standard methodology when looking at a sector-specific ETF is to first look at the macroeconomic backdrop for the industry, followed by a look at the ETFs performance relative to its peers and, finally, an analysis of the ETF’s charts.
The macroeconomic backdrop is generally positive.
Payroll employment and the unemployment rate (FRED)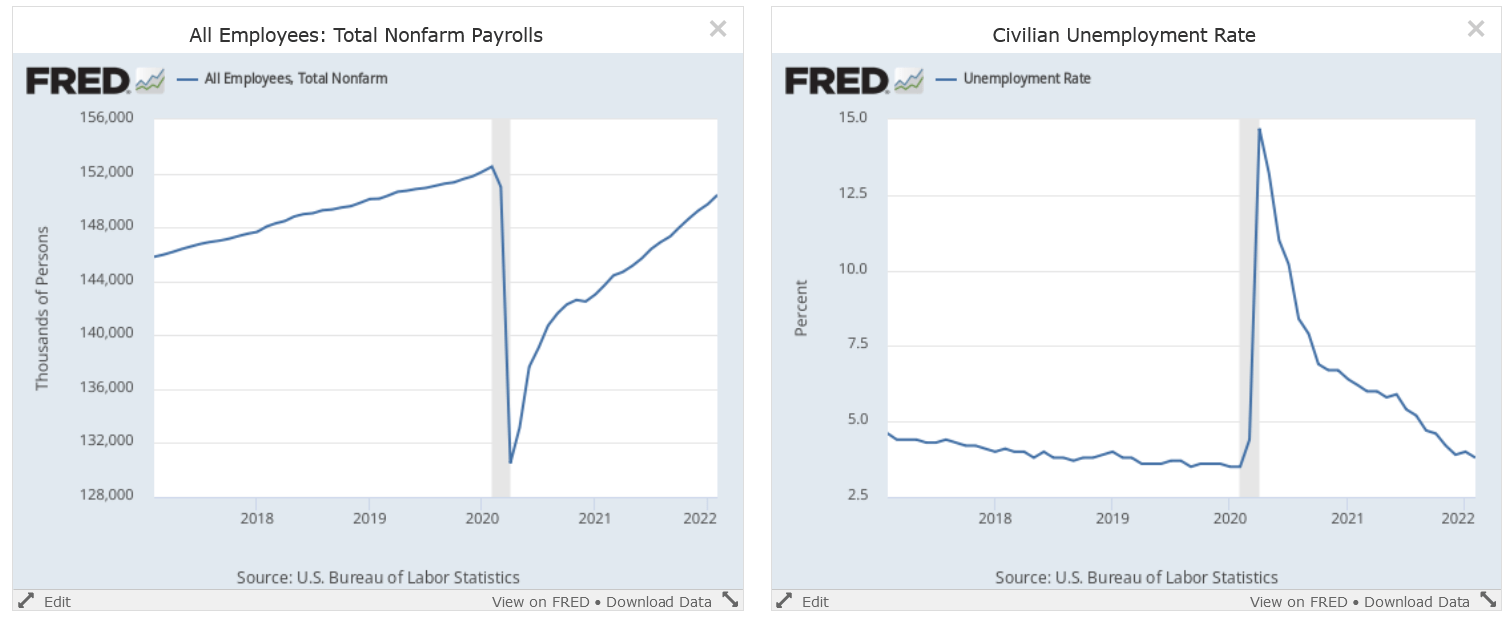
Total payroll employment (left) is rising at a brisk rate. This is lowering the unemployment rate (right).
Personal income less transfer payments and Y/Y percentage change in hourly wages (FRED)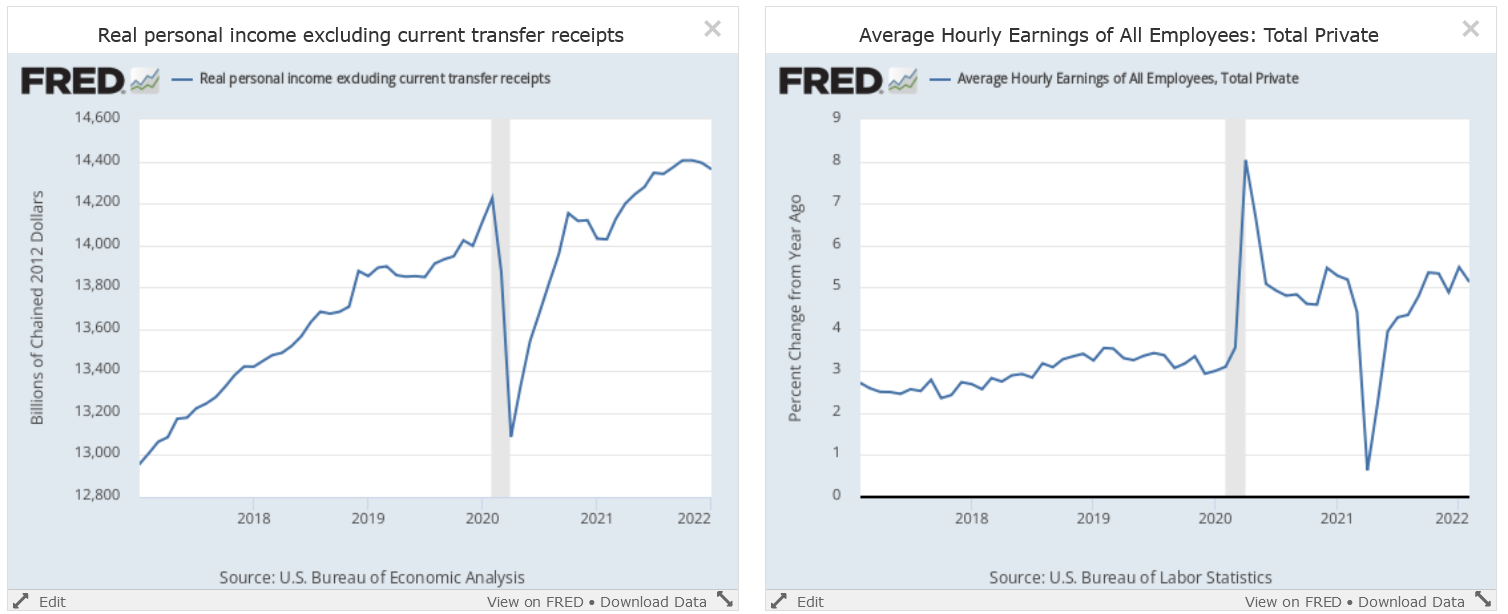
Personal income (left) is just shy of a five-year high while the Y/Y percentage change in hourly earnings (right) is rising at a brisk clip.
This is supporting increased consumer spending:
Total durable and nondurable goods purchases (FRED)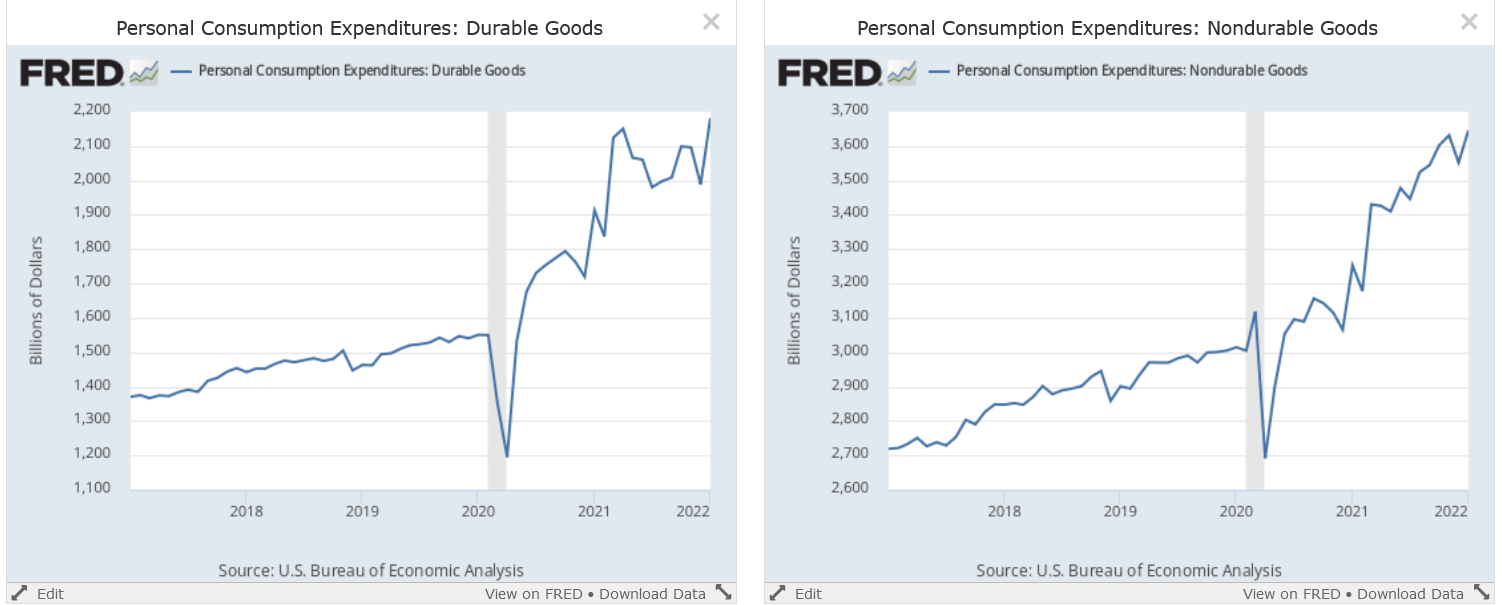
Personal consumption expenditures for durable goods (left) are at a five-year high as are expenditures for non-durable goods (right).
Personal consumption service expenditures (FRED)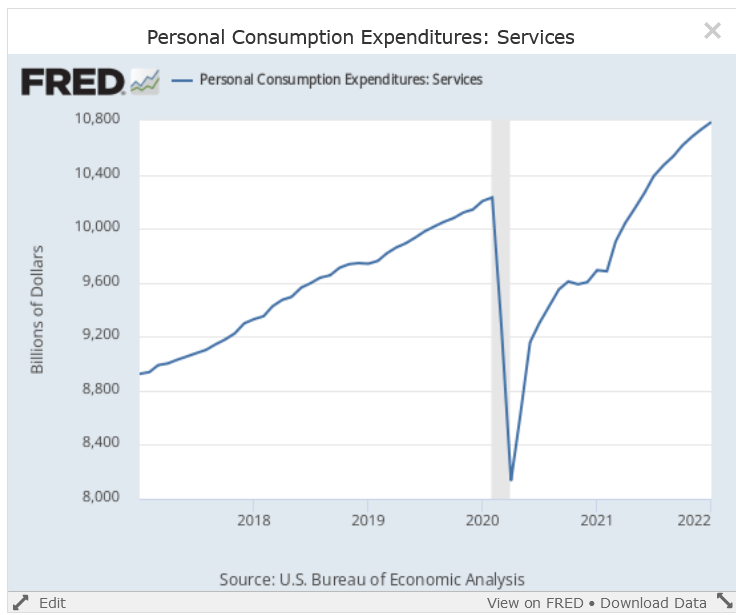
Personal consumption service expenditures are also at a five-year high.
However, the economy is currently in a very tough patch. Oil prices have spiked as a result of the war in Ukraine. This has contributed to the highest inflation since the 1970s. The Fed is now hiking rates in an attempt to slow price gains. While they intend to perform a soft landing – an economic slowdown instead of a recession – they have only been successful at this once since the end of WWII. Combined, these factors increase the possibility of a recession, which is best illustrated by the treasury market’s yield spread:
10-2 treasury market yield spread (FRED)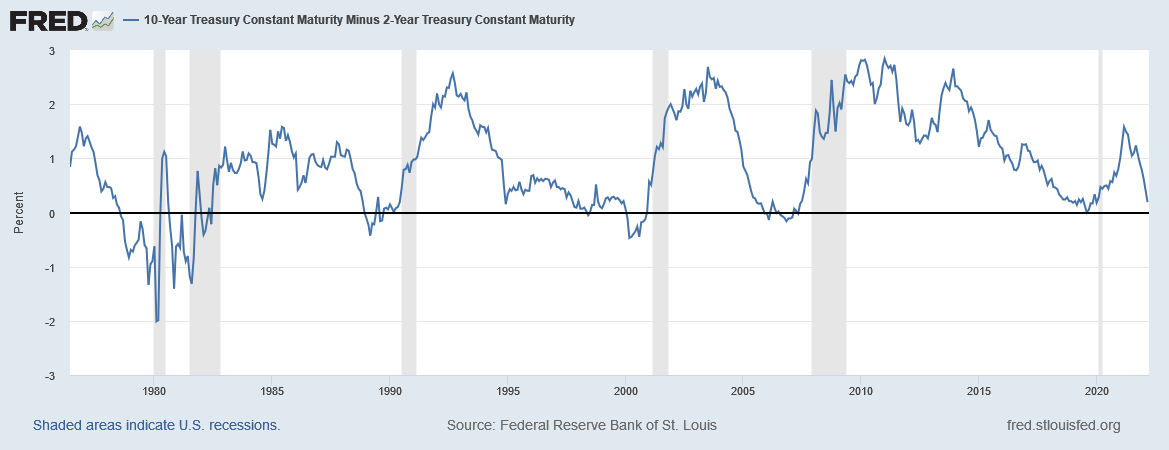
The 10-year-2-year treasury market spread is nearing 0%. This has been a reliable recession indicator for the last 45 years.
Next, let’s compare the XLY’s performance to other sector specific sectors which are the XLB, XLC, XLE, XLF, XLI, XLK, XLP, XLU, XLV, XLY, and VNQ:
| Week | Month | 3-Month | 6-Month | 1-Year | |
| XLY’s relative performance | 2nd | 6th | 9th | 6th | 8th |
The XLY has been a poor performer during longer time frames, although it’s picked-up recently.
Finally, let’s take a look at the charts:
XLY weekly and daily (StockCharts)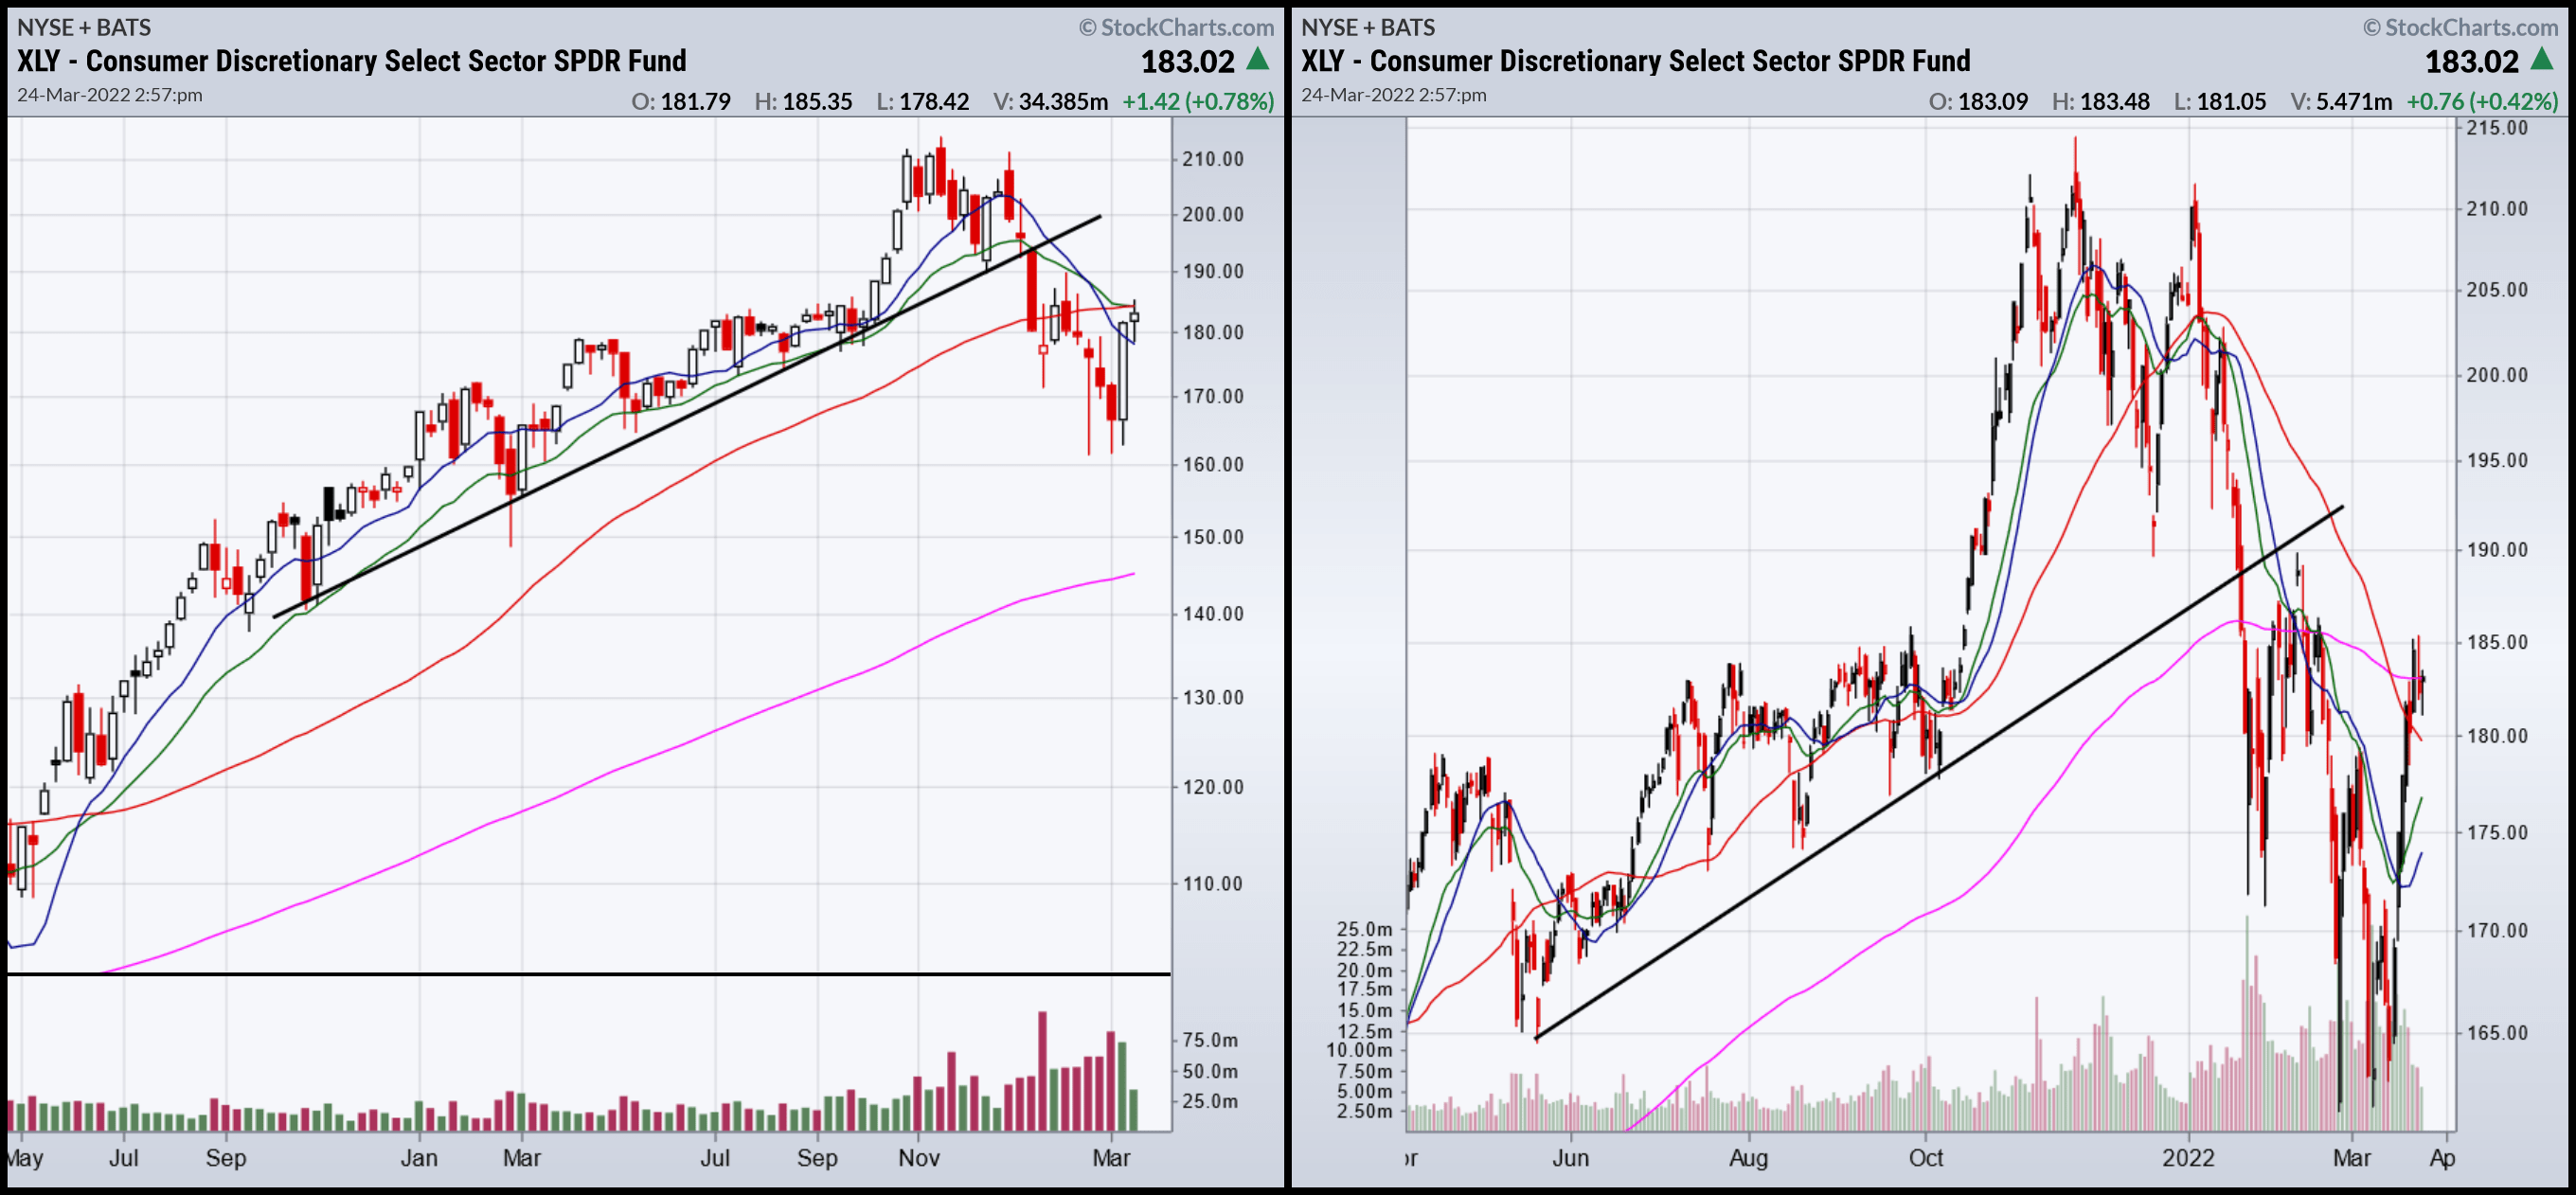
Prices have broken trend of the weekly chart (left) and are now below the 50-week EMA. On the daily chart (right) prices have dropped through the 200-day EMA. They have rebounded during the latest rally and are right at key levels.
Overall, the market started to sell this EMA at the beginning of this year when it became very clear that not only was the Fed going to raise rates, but would do so at a solid clip. History tells us that this will likely end in a recession which is negative for this ETF. Therefore, we suggest shifting out of this sector for now.
Be the first to comment