

Bet_Noire
Investment Thesis
The Consumer Staples Select Sector SPDR Fund (NYSEARCA:XLP) is the most popular Consumer Staples ETF today, with $15.5 billion in assets under management. For a 0.10% expense ratio, investors can get market-cap-weighted exposure to 33 familiar companies in the S&P 500 Index like Procter & Gamble (PG), Coca-Cola (KO), PepsiCo (PEP), and Costco (COST). With stocks like those, how could one go wrong? Surprisingly, better ETF options are available, and that’s the purpose of today’s article. I will explore XLP’s performance and fundamentals in-depth and introduce you to 11 other not-so-well-known choices. Ultimately, I hope you’ll agree that size doesn’t matter in the Consumer Staples sector, and diversifying by market cap with lesser-known names is the best course in the future.
ETF Overview
XLP tracks the Consumer Staples Select Sector Index, providing representation of large-cap consumer staples stocks in the market-cap-weighted S&P 500 Index. There are just 33 companies, and the top ten total 70%, so it’s about as focused and concentrated as possible. With sector ETFs, that’s expected and not a concern for me, as their purpose is to provide a path for investors to easily overweight a sector without breaking the bank. XLP accomplishes that, as its expense ratio is a mere 0.10%. Only the Fidelity MSCI Consumer Staples Index ETF (FSTA) does better at 0.08%, but these differences are negligible and won’t overshadow the differences in strategy.
XLP’s top ten holdings are below. In addition to the four mentioned previously, it includes Walmart (WMT), Philip Morris (PM), and Altria Group (MO). Stability is the name of the game here. It’s hard to imagine any of these companies going away soon, and it’s reflected in their weighted-average five-year beta of just 0.59. This means that investors get substantial downside protection in a recession. The downside is the relatively low growth, and you’re paying a fair bit (in terms of valuation) for that protection. More on that later.
State Street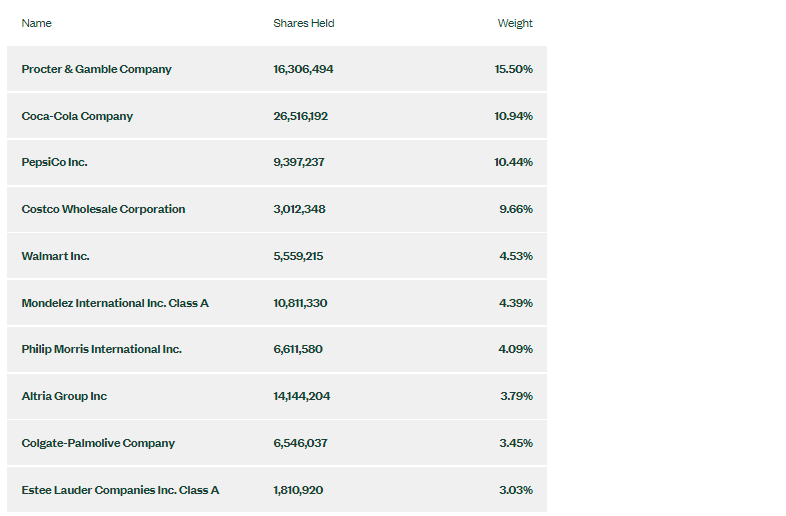
XLP is split across 11 GICS industries. I’ve included the top three holdings in each (if applicable) and their cash-adjusted weights below.
The Sunday Investor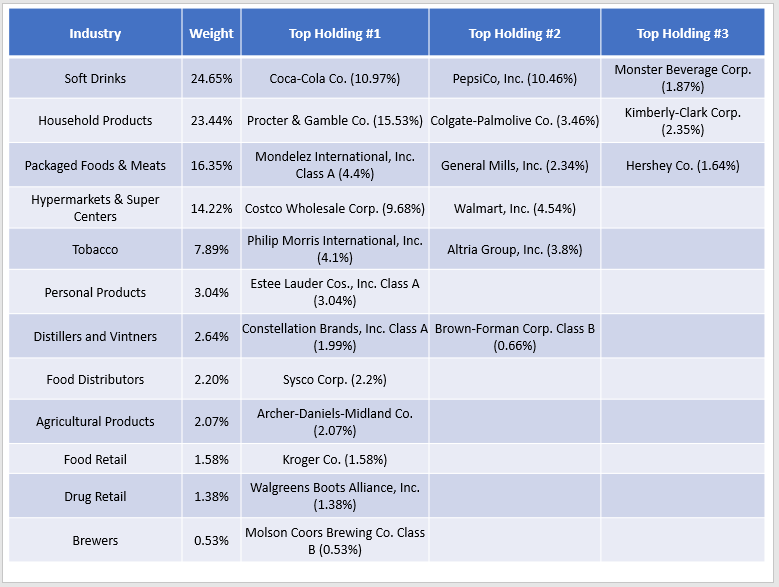
Performance Analysis
Against The S&P 500
Since January 1999, XLP has proven to be an effective risk-reducer with a low 12.27% annualized standard deviation. Its annualized return (including reinvested dividends) was 6.70% compared to 6.90% for the SPDR S&P 500 ETF (SPY). XLP’s worst year was 2002 when it lost 20.10% compared to SPY’s 21.59% decline. However, during most bear markets, XLP substantially outperformed, like in Q1 2020 when it outperformed by 6.15%.
Portfolio Visualizer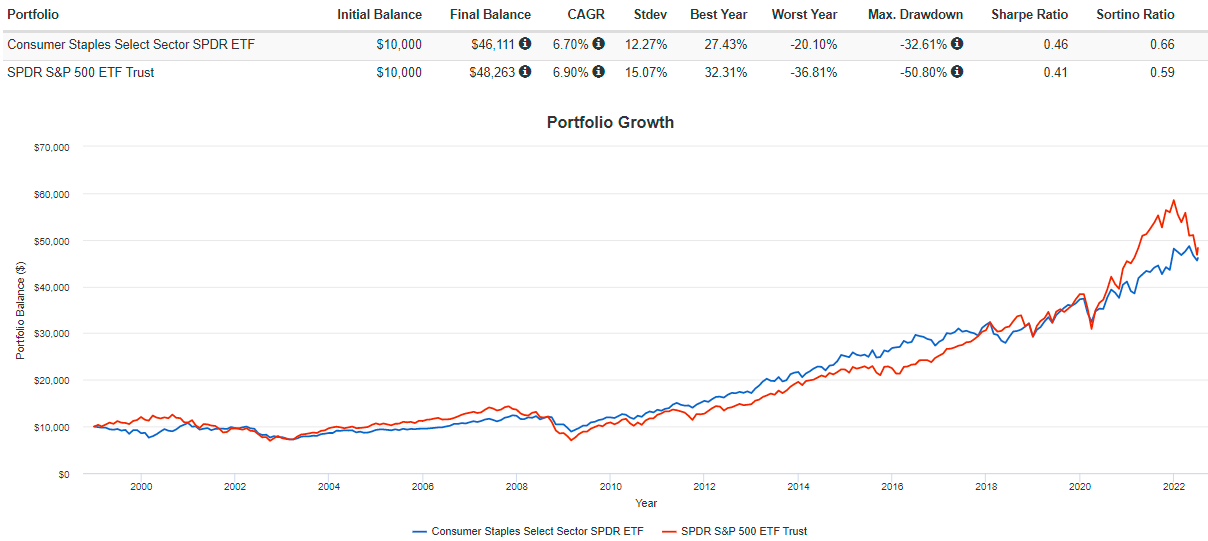
We all know what happened after that. Pandemic-friendly stocks, mainly in the Technology sector, drove the S&P 500 to record highs while the defensive Consumer Staples sector was left behind. However, you can see in the above graph that SPY has reversed those gains while XLP has been a slow-and-steady gainer. YTD, XLP is down 4.17% compared to 17.49% for SPY.
Against Other Consumer Staples ETFs
XLP isn’t the only large-cap Consumer Staples ETF available. The Vanguard Consumer Staples ETF (VDC) and FSTA draw from a larger universe of stocks but are still market-cap-weighted. Therefore, the large-cap holdings have a slightly lower weight to make room for some small- and mid-cap additions. Here’s a look at these two funds’ historical performance compared with XLP.
Portfolio Visualizer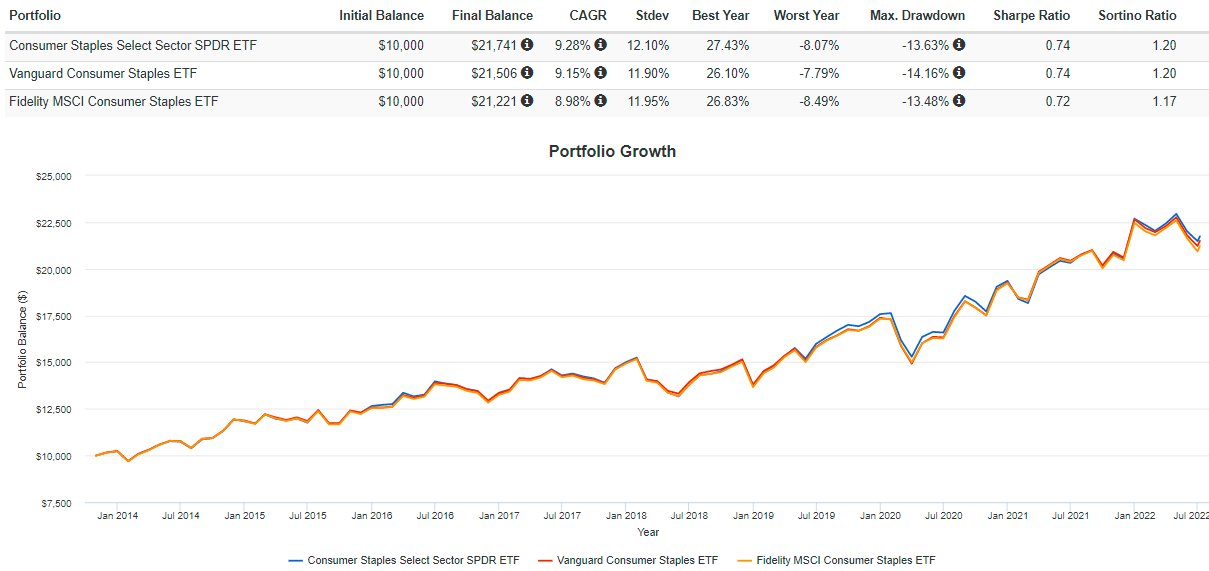
As shown, there’s been hardly a difference since 2014, and that’s because holdings like Procter & Gamble and Coca-Cola are so prominent in size that the small- and mid-cap holdings have negligible weights. But it’s interesting to see how XLP compares with the Invesco S&P 500 Equal Weight Consumer Staples ETF (RHS). Despite a significantly higher 0.40% expense ratio, RHS has outperformed XLP by 0.69% per year since December 2006. Clearly, there’s some advantage to diversifying by size since each stock’s weight is only approximately 3.33%.
Portfolio Visualizer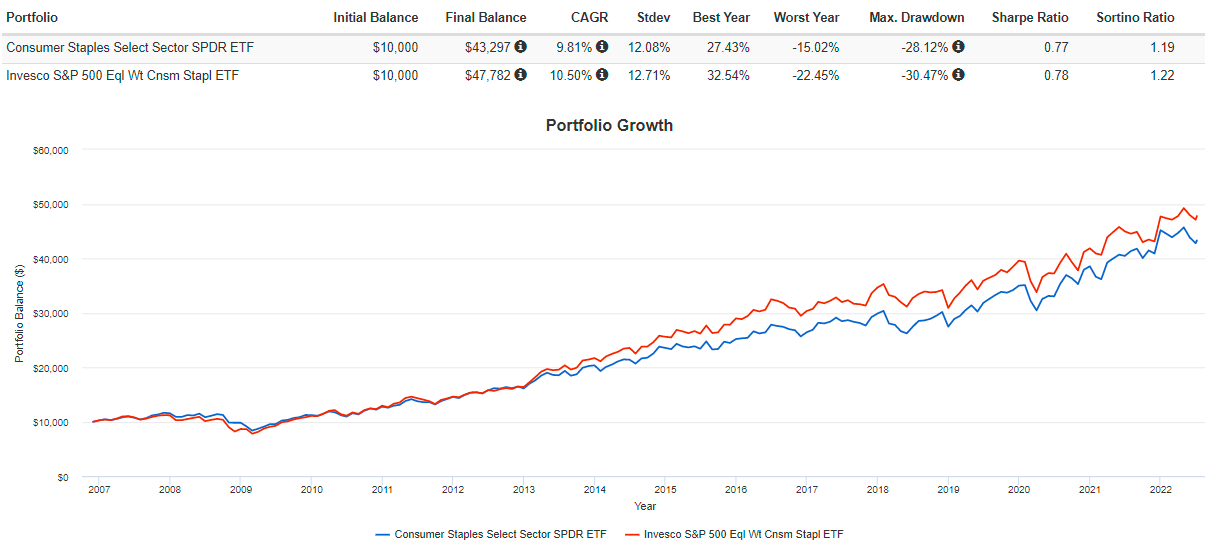
The benefits of size diversification are even more apparent when we compare XLP’s performance against the Invesco S&P SmallCap Consumer Staples ETF (PSCC). Again, PSCC has a higher expense ratio than XLP (0.29% vs. 0.10%). But if investors could tolerate the higher volatility, they were rewarded nearly 2% annually since May 2010.
Portfolio Visualizer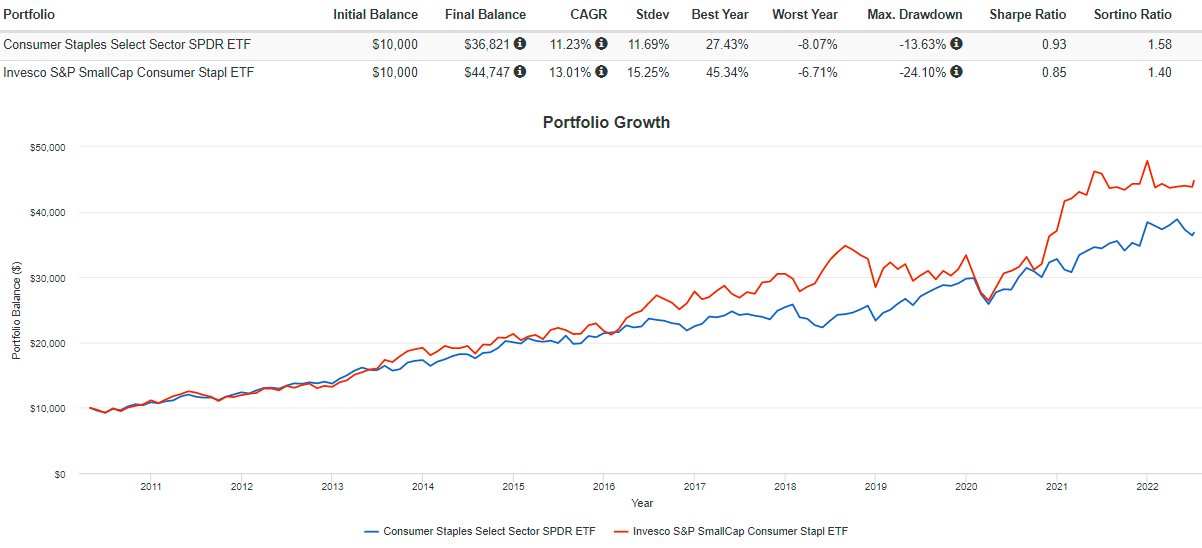
Finally, the table below highlights periodic performances for XLP alongside 11 other peers. I’ve sorted them by their one-year returns, and XLP placed 4th. However, in the last ten years, FXG, IYK, RHS, VDC, and PSCC outperformed.
The Sunday Investor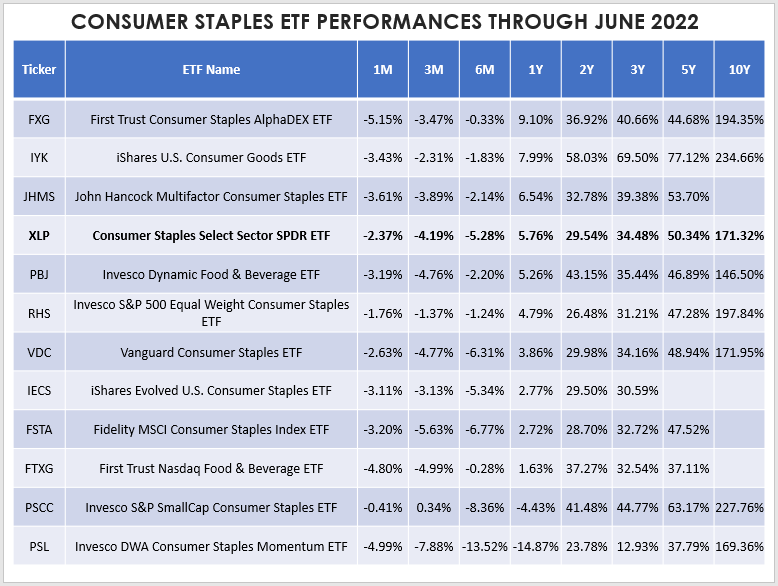
Fundamental Analysis
Next, let’s look at what makes XLP such a great defensive product, and in particular, I want to highlight its 0.59 five-year beta. Among the ETFs listed, it’s tied for the lowest alongside IYK and RHS and is the second-lowest out of all SPDR Sector ETFs. Only the Utilities Select Sector SPDR ETF (XLU), which I suggested was an excellent insurance play back in March, is less-volatile with a 0.47 five-year beta.
Here’s a snapshot of how XLP matches up against SPY on volatility, valuation, growth, and profitability. I’ve also included the last quarterly revenue surprise figures for each ETF, which I think paints a nice picture of the sector and explains why it was the best-performing sector in June.
The Sunday Investor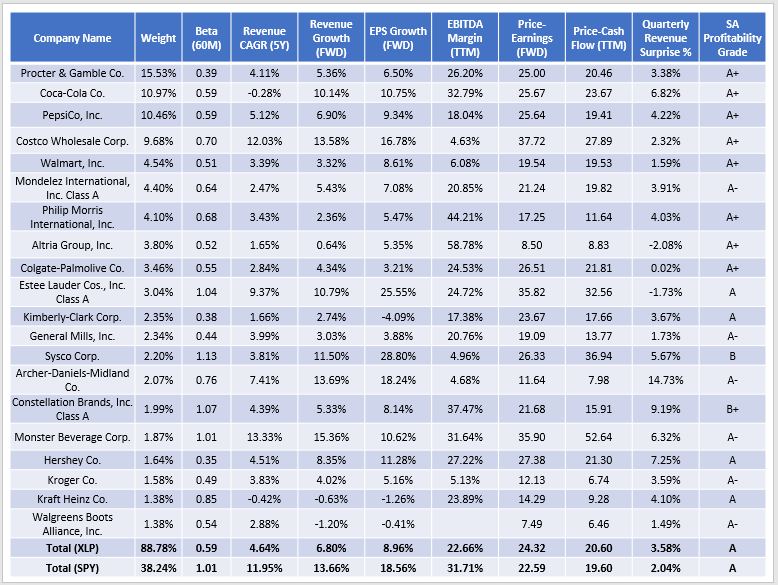
The low-volatility strategy has worked wonders this year, but XLP’s constituents also had a relatively strong quarter, averaging a 3.58% revenue surprise compared to SPY’s 2.04%. It’s a sign of good momentum, but I think investors have gotten most of what they’ll get out of XLP for the time being. My reasons include:
1. XLP’s constituents only grew revenues by 4.64% per year over the last five years, more than 7% behind SPY. Estimates are 6.80% for the next twelve months, but that’s also about 7% lower than SPY. A similar story plays on the earnings per share estimates, where XLP has an 8.96% growth estimate vs. SPY’s 18.56%. EBITDA margins are also lower (22.66% vs. 31.71%), but XLP’s top holdings seem to be weathering the inflation storm reasonably well. I think what’s happened is that they’re recognized “safe” names and are performing well despite lackluster growth.
2. Despite the safety, XLP’s forward price-earnings ratio is now higher than SPY (24.32 vs. 22.59). For growth-at-a-reasonable-price investors, it’s a huge red flag and something I think investors should pay attention to, given how fundamentals seem to matter more this year (unlike in 2020-2021). Unless markets fall substantially further, I don’t think you can expect XLP to outperform SPY by much. Shareholders are already beating by 13% YTD, the most since the Great Financial Crisis in 2008 (21.79%).
So if XLP isn’t the ideal solution, what is? Consider this set of summary metrics I’ve calculated for all 11 peers mentioned.
The Sunday Investor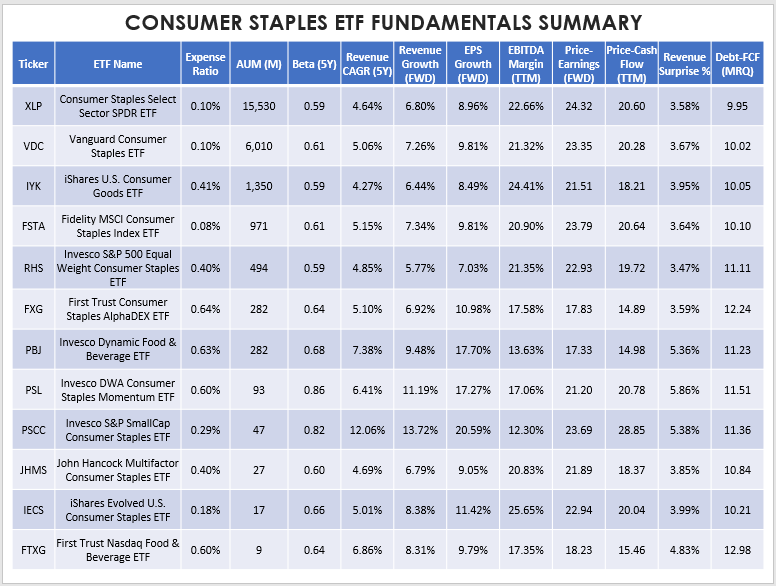
Each reader will value each metric differently, but I want to make a few observations to show you my thought process on evaluating these ETFs.
1. All Consumer Staples ETFs have reasonably low five-year betas, but PSL and PSCC are outliers at 0.86 and 0.82, respectively. PSCC is 100% small-caps, while PSL is about 50%. However, PSCC was the only ETF to turn a profit in Q2, and PSL was the worst performer. I think it’s because PSL follows a technicals-based Index, and we’re in a period now where fundamentals matter more. Either way, both are probably better positioned to participate in any market recovery. I favor PSCC because of its lower expense ratio, and the strategy is more straightforward.
2. PSCC and PSL score well on revenue and earnings per share growth, as does PBJ. The latter is interesting, and I’ve covered PBJ a couple of times already, predicting it would be one of the best performers. It’s tricky to keep tabs on it since it reconstitutes quarterly and always results in significant portfolio turnover. Again, investors unwilling to trade frequently are probably better off with PSCC.
3. XLP is the most expensive on forward earnings and the fourth most costly based on trailing cash flow. Arguably, PSCC is worse off from a valuation perspective, but at least it has some growth potential to back it up. PBJ, FXG, and FTXG have forward price-earnings valuations of around 18, but the critical problem is that their expense ratios are so high. Liquidity may also be an issue for frequent traders. Although nearly all ETFs trade at or close to their NAVs because of the unique creation/redemption process, high bid-ask spreads can be problematic for traders.
4. As discussed, XLP’s 3.58% revenue surprise figure last quarter is impressive, but it was close to the worst out of all its peers. PSCC’s was 5.38%, but investors generally have to deal with lower profitability levels and higher debt loads as they move into small caps. Assessing your risk tolerance and purpose for wanting to overweight the Consumer Staples sector is essential before deciding which ETF suits you.
Investment Recommendation
There is enough evidence to suggest XLP isn’t the best Consumer Staples ETF despite its low expense ratio (0.10%) and high assets under management ($15.53 billion). Investors were rewarded in the last ten years by including some small and mid-caps. You can do that to a minimal extent with ETFs like VDC and FSTA, modestly with an ETF like RHS, or add PSCC to their portfolio in your desired proportions. Diversifying by size is slightly more costly, but it’s worth it, provided risk-reduction isn’t your only objective.
Fundamentally, I think XLP’s forward price-earnings ratio of 24.32 is too high and that the ‘rally’ (i.e., less negative returns) is becoming exhausted. Adding some growth to the mix is appropriate, and since fundamentals seem to matter most this year, choosing ETFs with low valuations and solid growth profiles is key. Therefore, while I like what the Consumer Staples sector offers, my rating on XLP is only a hold because there are better alternatives. I hope you can use the data I’ve provided to find the best one for you, and as always, I look forward to discussing this further in the comments section below.
Be the first to comment