

In this article, we examine the significant weekly order flow and market structure developments driving XLK price action.
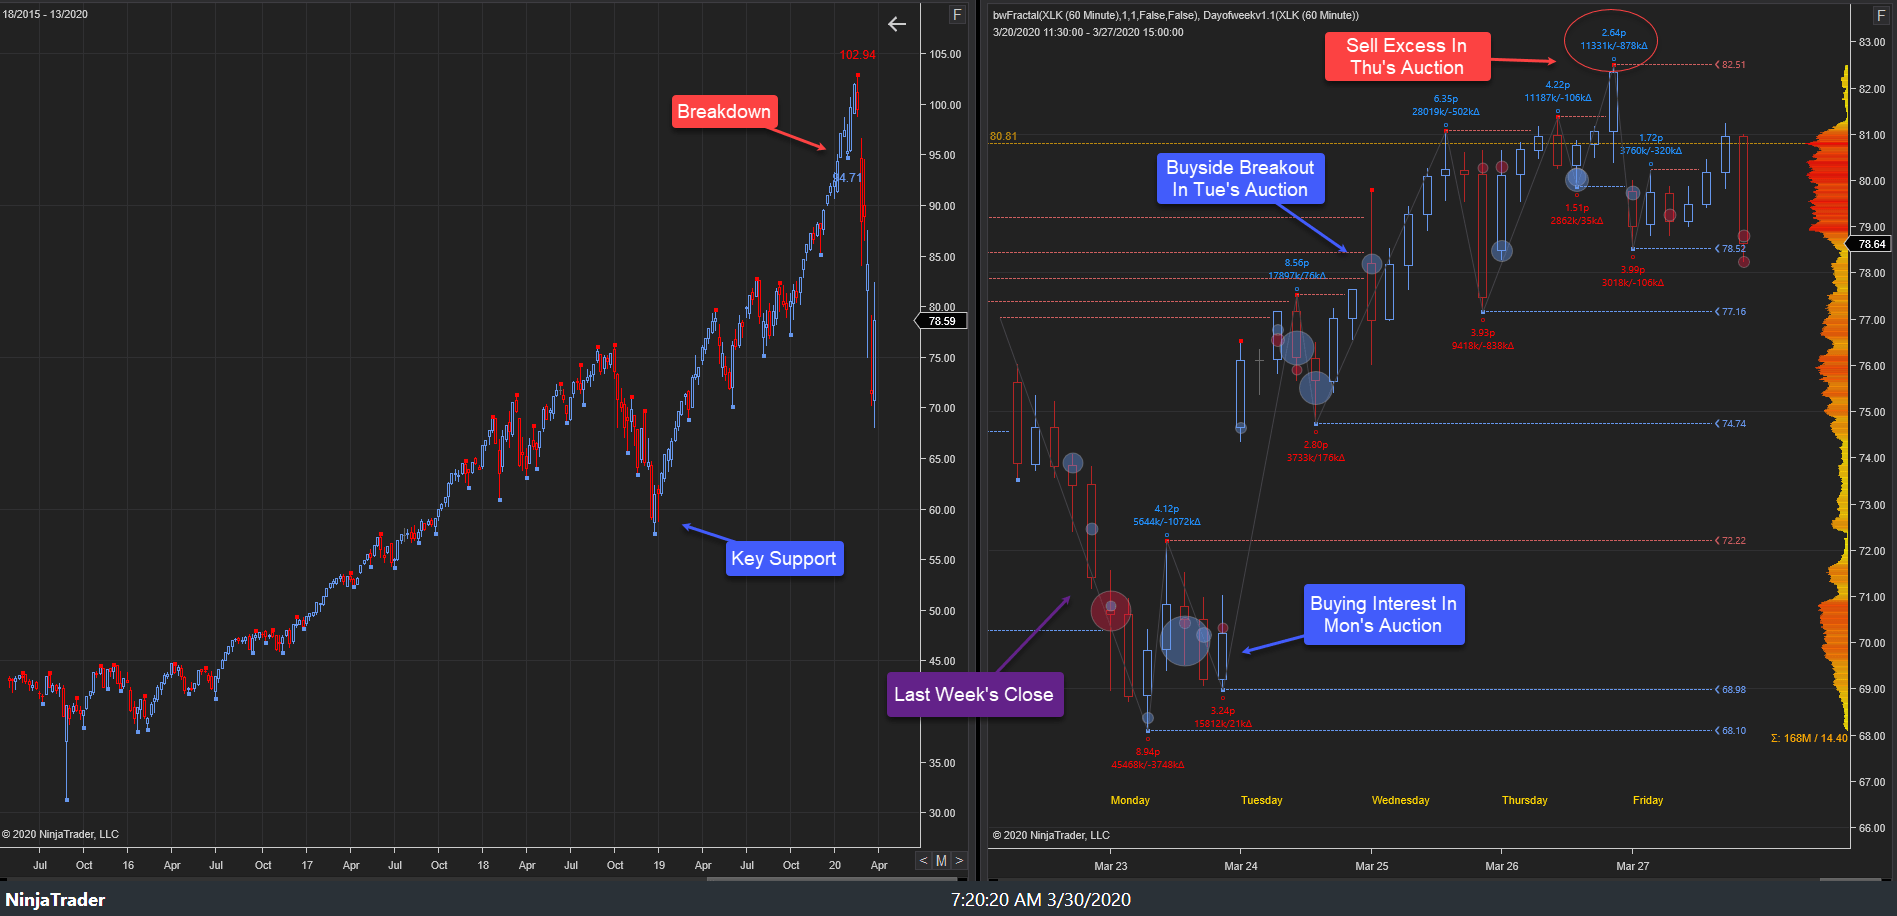
As noted in last week’s XLK Weekly, the highest probability path for this week was for price discovery higher, barring failure of 77.16s as support. This primary expectation played out, albeit marginally, as a failed buy-side breakout developed at key resistance into Tuesday’s auction. The relief rally terminated before a pullback developed to 75.96s, developing balance, 75.96s-78.83s, ahead of Friday’s close, settling at 77.12s.
30 March – 03 April 2020:
This week’s auction saw buying interest, 79.64s/81.03s, as last Friday’s late sellers failed to hold the auction. Price discovery higher developed to 82.09s into Monday’s close. Sellers trapped, 81.45s, early in Tuesday’s auction, driving price modestly higher, achieving the weekly stopping point high, 83.18s, in an attempted buy-side breakout above key supply, 78.52s-82.51s. Buyers trapped, 82.40s, amidst sell excess, halting the rally. Price discovery lower ensued to 79.95s before selling interest emerged, 80.61s, into Tuesday’s close.
Tuesday’s late sellers held the auction as a gap lower open developed in Wednesday’s auction as the sell-side phase continued, achieving a stopping point, 75.97s, into Wednesday’s close. A minor probe lower developed early in Thursday’s auction achieving the weekly stopping point low, 75.96s. Rotation higher developed as balance ensued, 75.96s-78.83s, ahead of Friday’s close, settling at 77.12s.

This week’s auction saw a failed buy-side breakdown early week result in price discovery lower to 75.96s. Within the larger context, this week’s auction saw a potential retracement high form at 83.18s following the breakdown below January support, 94.71s.
Looking ahead, the focus into next week’s auction will center upon response to this week’s support, 75.96s-77s. Buy-side failure at this key support would target key supports below, 72.22s/68.10s, respectively. Alternatively, sell-side failure to drive price lower from this key area would target key supply above, 82s-83.18s/87.65s-89.44s, respectively. From a structural perspective, the highest probability path near-term is sell-side barring failure of 83.18s as resistance. Within this near-term context, the intermediate term (3-6 month) bias is bearish barring failure of 94.71s as resistance.
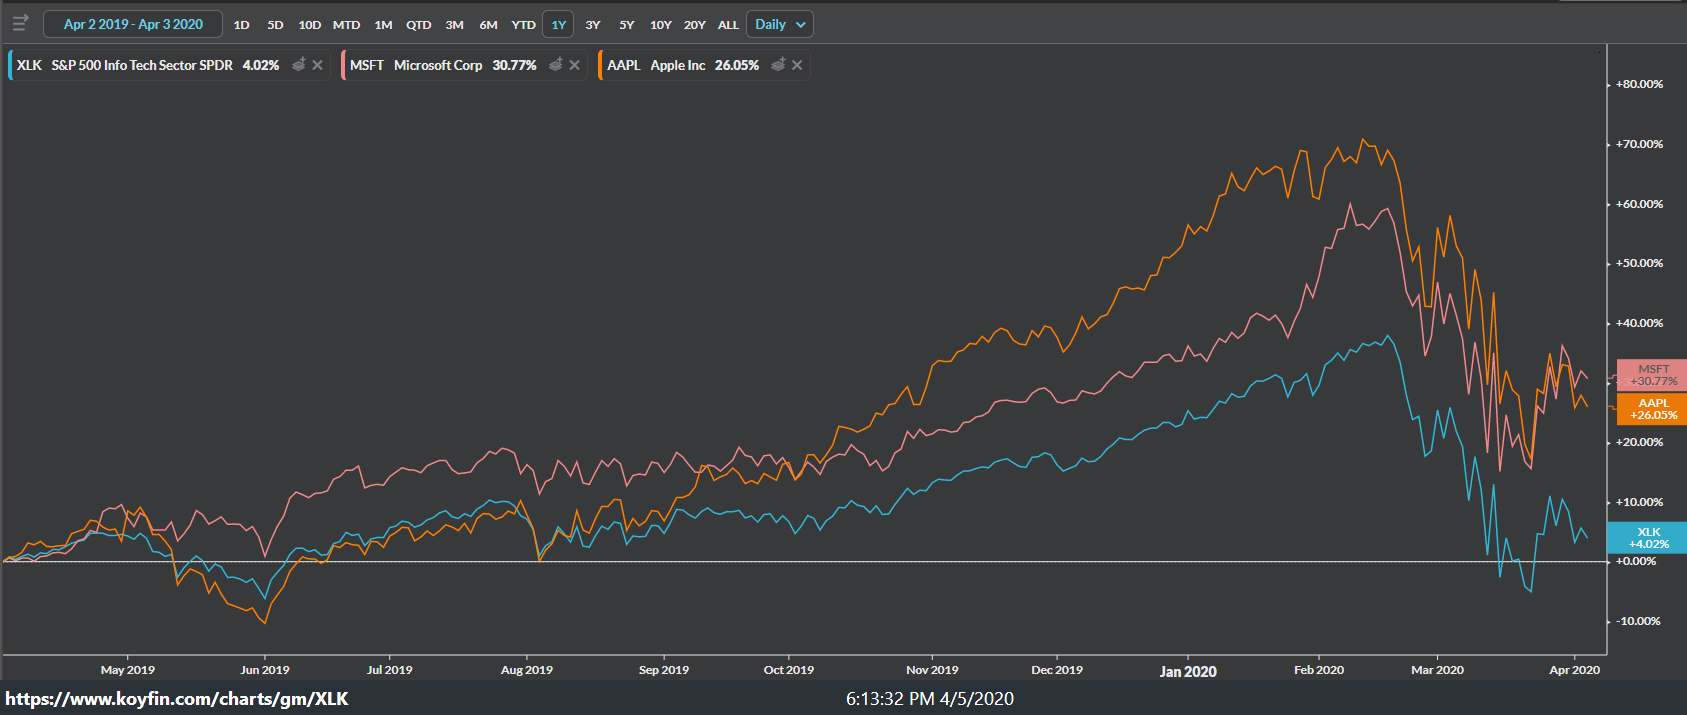
When looking under the hood of XLK, the performance of the ETF hinges largely upon the behavior of two stocks, Microsoft and Apple. Together, they have accounted for +517 and +387 basis points of XLK’s return since the January 2019 low, respectively. As go Microsoft and Apple, so goes the XLK.
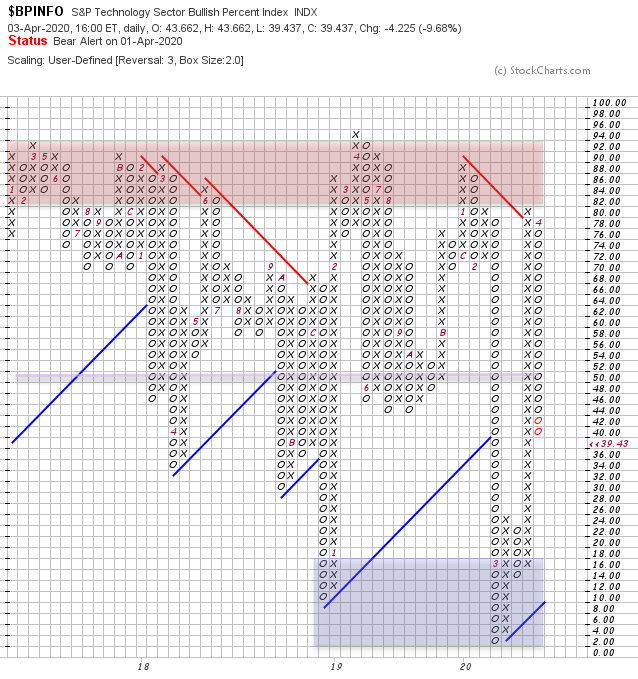
It is worth noting that breadth based on the S&P Technology Sector Bullish Percent Index saw a historic collapse in breadth from February into March before a historic rise in breadth back to bullish extreme. Stocks more broadly, as viewed via the NYSE, saw similar behavior. Breadth moved lower this week into the “neutral” zone. Asymmetric opportunity develops when the market exhibits extreme bullish or bearish breadth with structural confirmation. Market structure is bearish while breadth has begun to decline yet again. Despite the large price movement lower in recent weeks, it remains most probable that the corrective phase is not yet complete.
The market structure, order flow, and breadth posture will provide the empirical evidence needed to observe where asymmetric opportunity resides.
Disclosure: I/we have no positions in any stocks mentioned, and no plans to initiate any positions within the next 72 hours. I wrote this article myself, and it expresses my own opinions. I am not receiving compensation for it (other than from Seeking Alpha). I have no business relationship with any company whose stock is mentioned in this article.
Be the first to comment