

Torsten Asmus/iStock via Getty Images
Two short years ago, nearby NYMEX landlocked WTI crude oil prices fell below zero. Brent crude oil fell to $16 per barrel, the lowest price this century. Natural gas declined to a 25-year low of $1.432 per MMBtu. The worldwide pandemic caused energy demand to evaporate as people sheltered in their homes, travel ground to a halt, and working from home became the norm.
In 2021, the election of Joe Biden was a clean energy referendum. The new administration walked away from the “drill-baby-drill” and “frack-baby-frack” policies that was supported by the previous administration. Supporting alternative and renewable fuel sources and inhibiting fossil fuel production and consumption was a dramatic policy shift that handed pricing power to the international oil cartel and its non-member partner Russia. Fossil fuel prices rose throughout 2021.
In 2022, Russia’s invasion of Ukraine and sanctions created supply fears. While green energy may be the future, hydrocarbons continue to power the world.
The US administration’s energy plans caused many traditional oil and gas companies to change plans and strategies and created entry barriers for new entrants. Meanwhile, the small group of existing oil, gas and related companies have experienced an earnings bonanza as prices have soared. The Energy Select Sector SPDR Fund (NYSEARCA:XLE) owns shares in US traditional energy companies.
The energy market has calmed after the recent explosive price moves: The three reasons why traditional energy prices will remain high
At the end of last week, May NYMEX crude oil futures settled at just below the $100 per barrel level. The energy commodity’s price traded in a wide range from $93.53 to $130.50 in March.
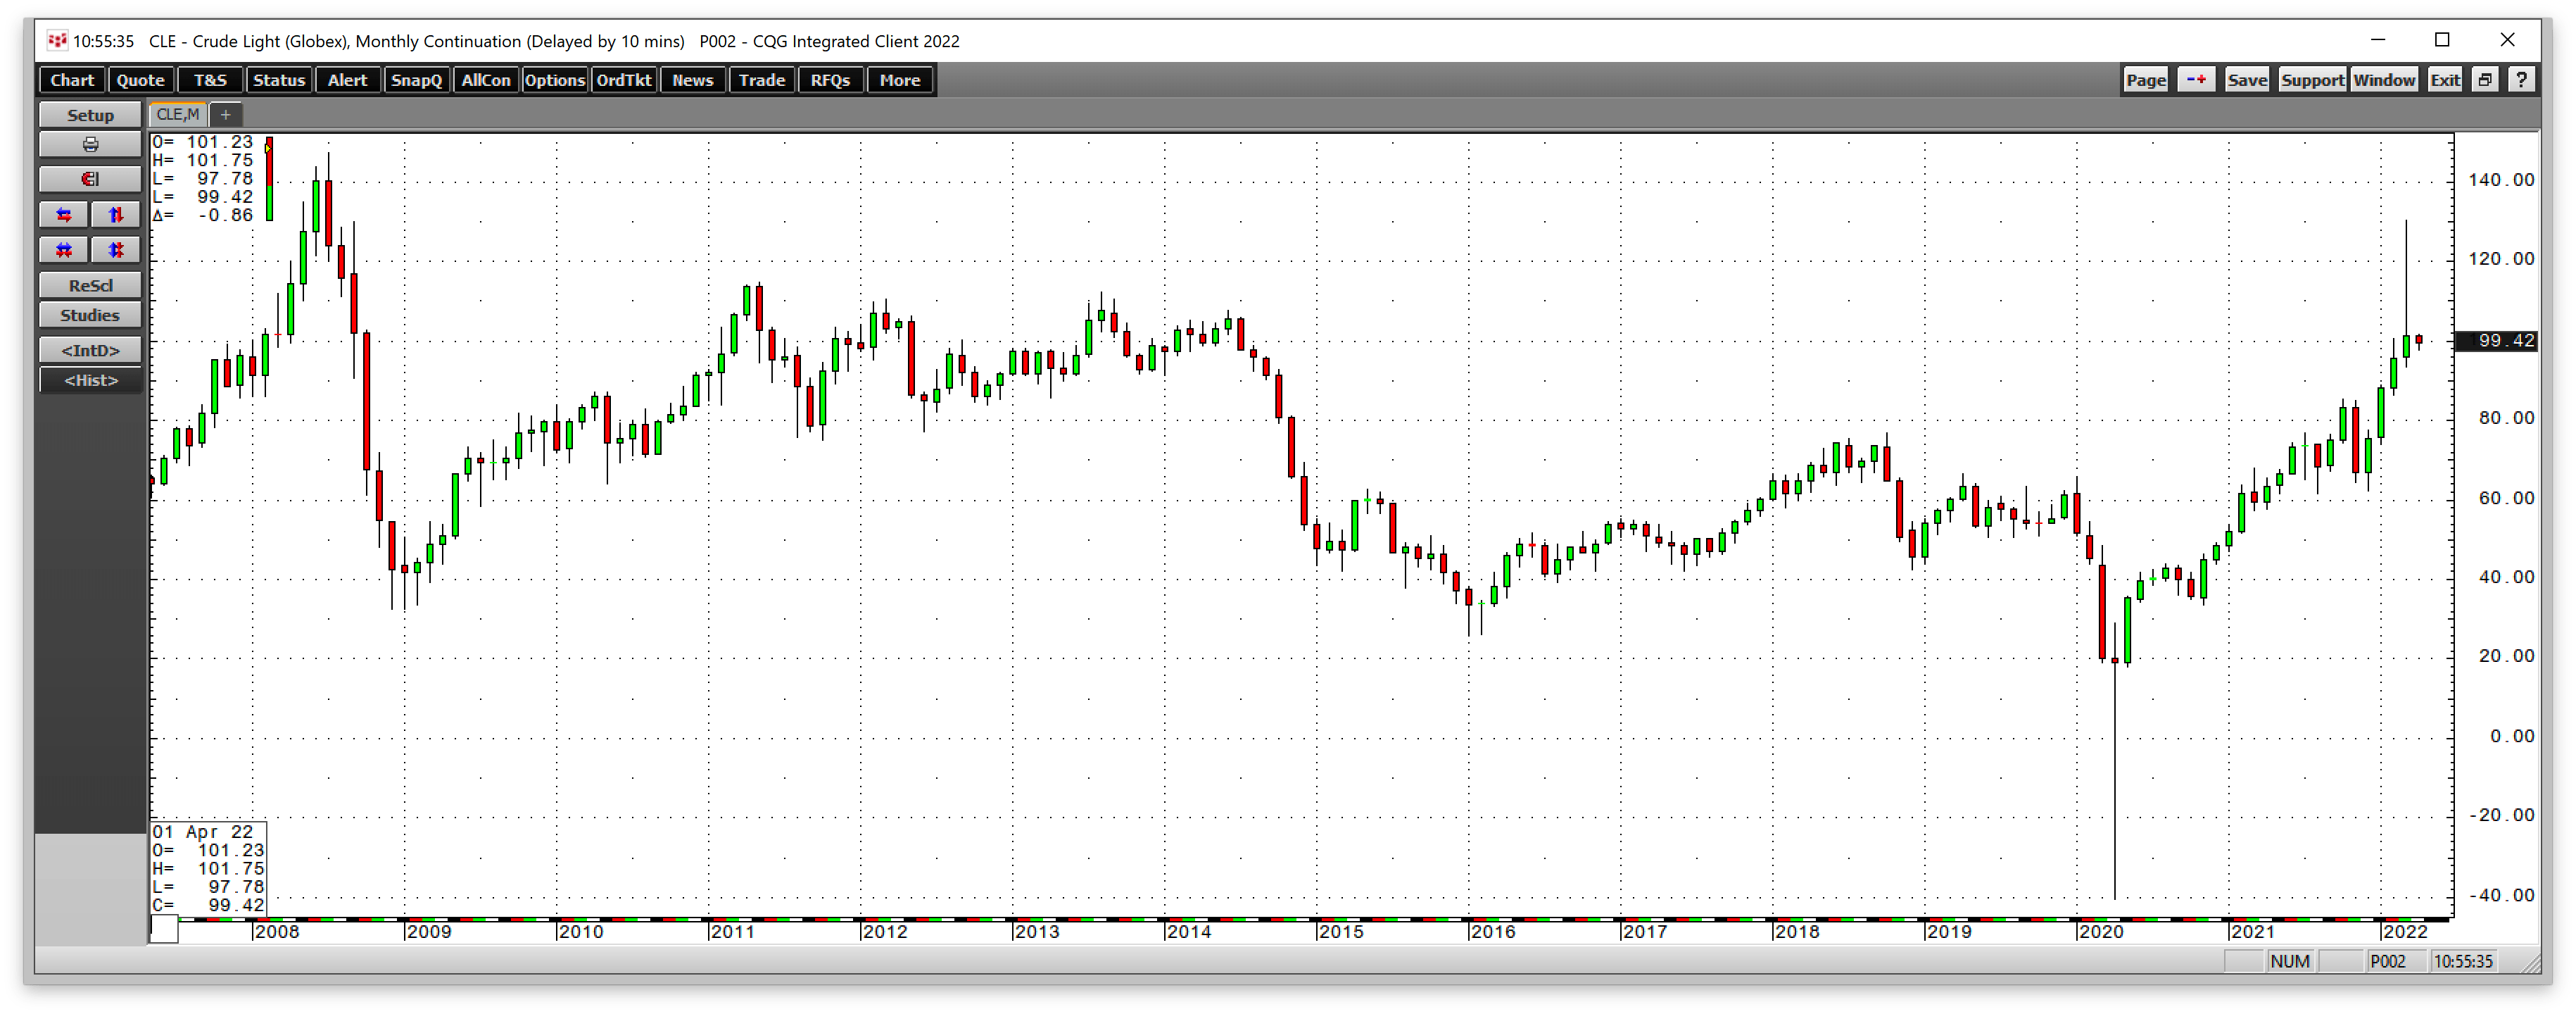
Monthly NYMEX Crude Oil Futures (CQG)
The monthly chart illustrates the wild price action in the oil market in March.
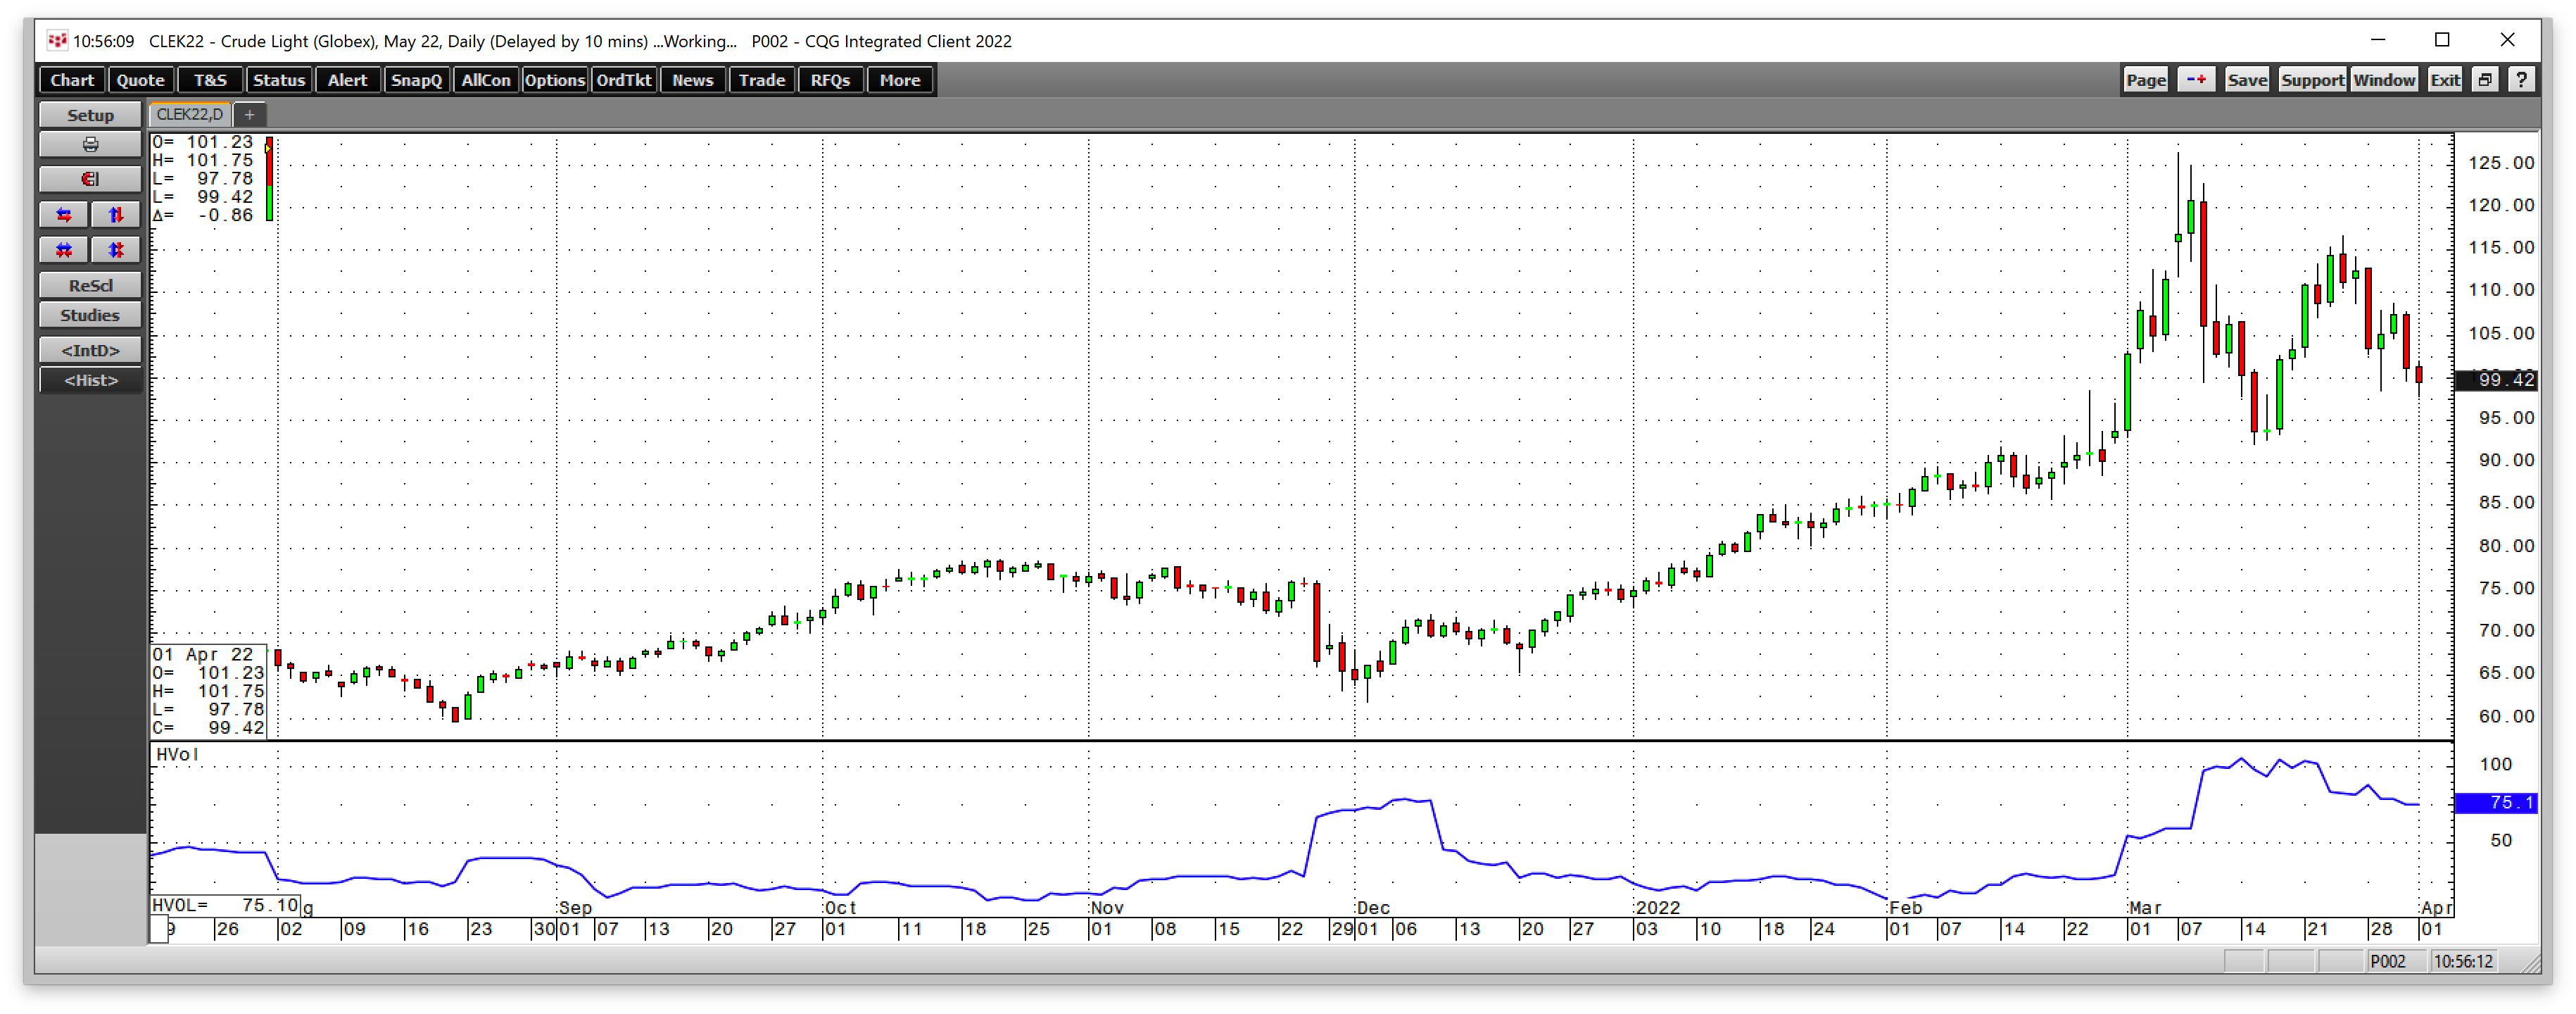
Daily NYMEX Crude Oil Chart with Historical Volatility (CQG)
The daily chart highlights that daily historical volatility declined from 104.83% on March 14 to the 75% level on April 1.
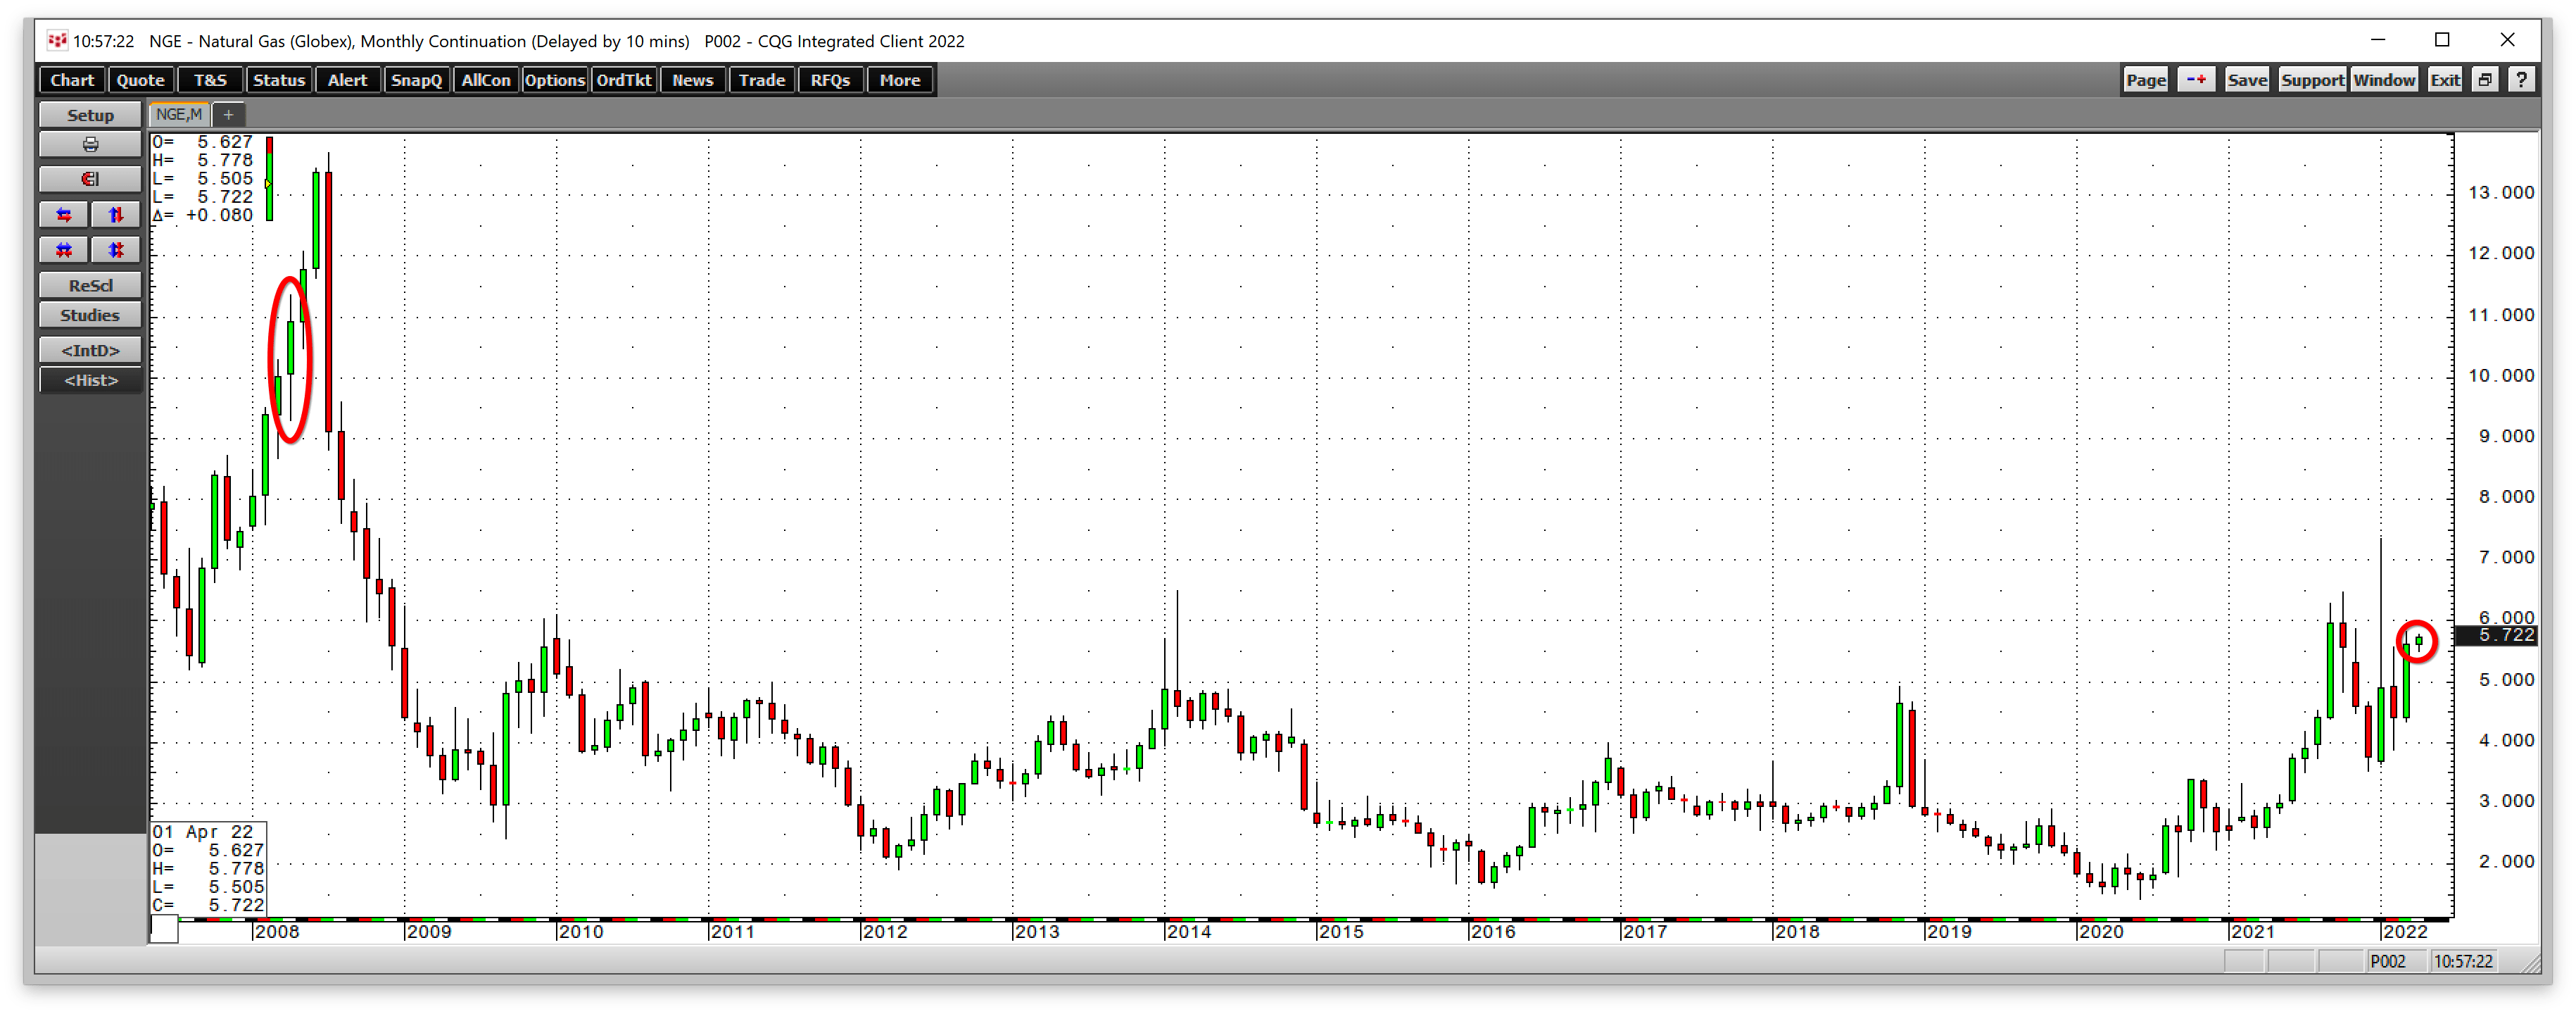
Monthly NYMEX Natural Gas Chart (CQG)
The monthly chart shows that the last time natural gas prices were at the $5.70 per MMBtu level in April was in 2008.
Three factors support fossil fuel prices as we move into the second quarter:
- Crude oil posted its eighth consecutive quarterly gain in Q1 2022. The trend for oil and gas prices remains higher.
- The tensions between Washington D.C., and Moscow will continue after the war in Ukraine ends. Russia is an influential non-member of the international oil cartel.
- Russia will use oil and gas as a political tool. US energy policy favoring alternative and renewable fuels and inhibiting fossil fuel production and consumption will continue to weigh on production. Oil and gas are the energy commodities that continue to power the world.
On March 31, OPEC did not ramp up production, increasing output by the scheduled 432,000 barrels per day. US President Joe Biden announced the most substantial strategic petroleum reserve release of one million barrels per day, which could amount to 180 million barrels. The president blamed the pandemic and Russia’s Vladimir Putin for high oil prices. He did not mention the central bank liquidity and government stimulus that lit the inflationary fuse. He did not refer to his administration’s energy policy that favors alternative and renewable energy sources and inhibits fossil fuel production. The president said that his administration plans to lean on the US oil companies and could tax unused leases. However, oil companies cannot ramp up production as it requires labor, and the policies since early 2021 have forced oil workers to find other employment in an already tight labor market.
Each past SPR release initially pushed oil prices lower, but the energy commodity moved to higher highs. Time will tell if the most substantial release will cause crude oil and oil products to follow the same path. Energy policy, inflation, and US foreign policy lit the bullish fuse in the oil market over the past months. Before the US election, the price was below $40 per barrel in November 2020. Nearby NYMEX crude oil futures settled at just below $100 on April 1.
Higher prices lead to higher profits for traditional energy producers
One of the unintended consequences of US energy policy has been to create a virtual monopoly for the leading integrated US oil companies. Regulations, canceling pipeline projects, restricting drilling and fracking, and political pressure created entry barriers for any competition. Higher oil prices have pushed the leading oil company’s shares higher in 2022, making the oil and gas sector the best performing sector of the stock market. In Q1, the S&P 500 moved 4.95% lower, but soaring energy profits caused energy shares to lead the stock market.
Production costs have increased, and the US has become more dependent on oil imports since early 2021. LNG has expanded the addressable market for US natural gas beyond the pipeline network in natural gas. While US prices at the $5.70 per MMBtu level in April 2022 are at the highest price in 14 years, prices in Europe and Asia are trading at multiples.
Meanwhile, investors in US oil companies rely on management to deliver returns. The administration can put public pressure on oil companies, increase taxes on unused leases, and use other tools, but it cannot legally prevent them from making money in a capitalist system. The oil companies lost fortunes in early 2020 as the pandemic gripped the energy complex. A capitalist system means that the government cannot allow companies to suffer when market prices rise. Moreover, US energy policy, central bank liquidity, and government stimulus lit the bullish and inflationary fuse in the oil and gas markets. Russia may have poured fuel on the fire, but the original ignition was the US government’s energy, monetary, and fiscal policies.
The bottom line is that management’s job is to optimize investors’ returns.
The XLE owns shares of the leading traditional US energy and energy-related companies
The Energy Select SPDR Fund (XLE) owns shares in the leading US oil and gas companies. The top holdings include:
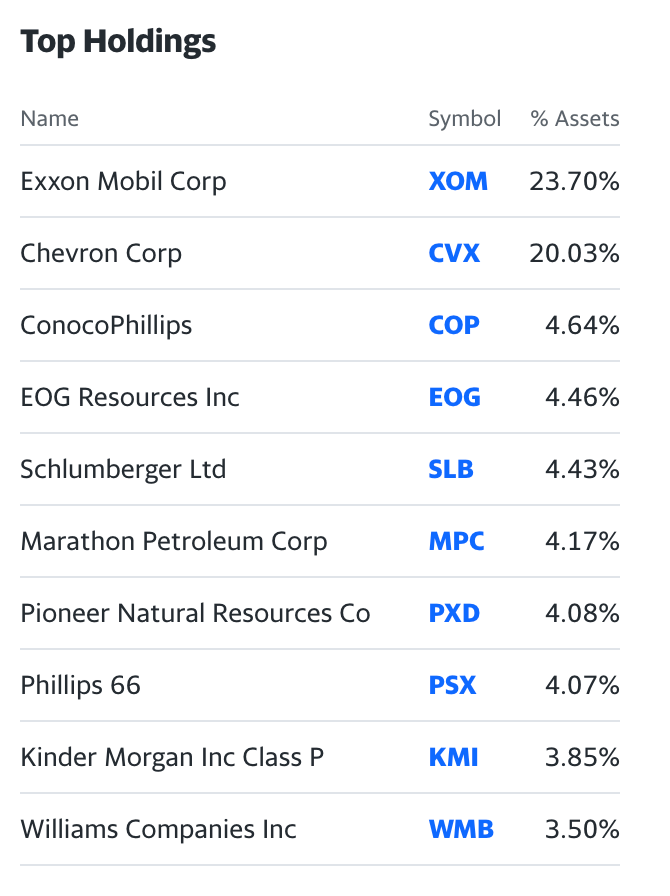
Top Holdings of the XLE ETF product (Yahoo Finance)
At the $77.06 per share level on April 1, the XLE had nearly $37 billion in assets under management. The ETF trades an average of over 45.27 million shares each day and charges a 0.12% management fee.
The trend in the XLE remains higher
In Q1, the S&P 500, the most representative and diversified US stock market index, moved 4.95% lower.

Chart of the XLE from the end of Q4 2021 to the end of Q1 2022 (Barchart)
The chart highlights the move from $55.50 on Dec. 31, 2021, to $76.44 per share on March 31. The XLE posted a 37.7% gain in Q1 2022. The XLE was slightly higher on April 1.
Rising profits at the integrated oil and gas producers and related companies have pushed the XLE higher, which remained in a bullish trend on April 1.
The APS is long XLE and will stay long until the trend turns lower
As of April 1, 2022, the trend in XLE shares was higher. The APS was long XLE shares as the trend is always your best friend in all markets. APS holds 10 highly-liquid and optionable stocks and ETF products. XLE is a component as it meets the strategy’s requirements. At $76.97 per share, the ETF is not far below its recent high of $80.22 on March 8.
Following trends via an algorithmic system requires strict adherence to rules. We do not attempt to pick bottoms or tops in any markets and are typically short at bottoms and long at tops. Taking the most significant percentage out of trends requires removing emotional impulses from trading and investing. We ignore fundamentals, news, and all of the daily noise. Our signals are never intraday. They can only change at the end of a session. Our system does not get caught up in the daily frenetic trading activity. News and noise are at a frenzied level with the war in Ukraine, sanctions, concerns over energy supplies, and the US administration’s moves to release oil from the SPR and punish oil companies. The APS is always long or short its components.
The price of any asset is always the correct price because it is the level where buyers and sellers meet in a transparent environment, the marketplace. Crowd behavior that determines trends can be the optimal market approach across all asset classes. As of April 1, the crowd’s wisdom points to a bullish trend in XLE. When the trend changes, the APS will issue a sell signal for the ETF that holds the leading integrated oil companies and shares of other traditional energy-related companies.
Be the first to comment