

kschulze/iStock via Getty Images
Investment thesis: with the Fed raising rates, the best of times are over for homebuilders. Look elsewhere for gains.
Due to the rise of data showing that active management performs poorly over the long term, investors now use ETFs as the backbone of most portfolios. These funds allow investors to target broad sectors of the market, like the SPDR Homebuilders ETF (NYSEARCA:XHB) issued by State Street Global Investors.
Here are the fund’s broad goals:
- The SPDR® S&P® Homebuilders ETF seeks to provide investment results that, before fees and expenses, correspond generally to the total return performance of the S&P® Homebuilders Select IndustryTM Index (the “Index”)
- Seeks to provide exposure to the homebuilders segment of the S&P TMI, which comprises the following sub-industries: Home Building, and may include Building Products, Home Furnishings, Home Improvement Retail, Homefurnishing Retail, and Household Appliances.
Here are the fund’s top holdings:
Top 10 holdings of the XHB ETF (State Street Global Investors)
And here are the sub-industry allocations:
Sub-Industry Allocations of XHB (State Street Global Investors)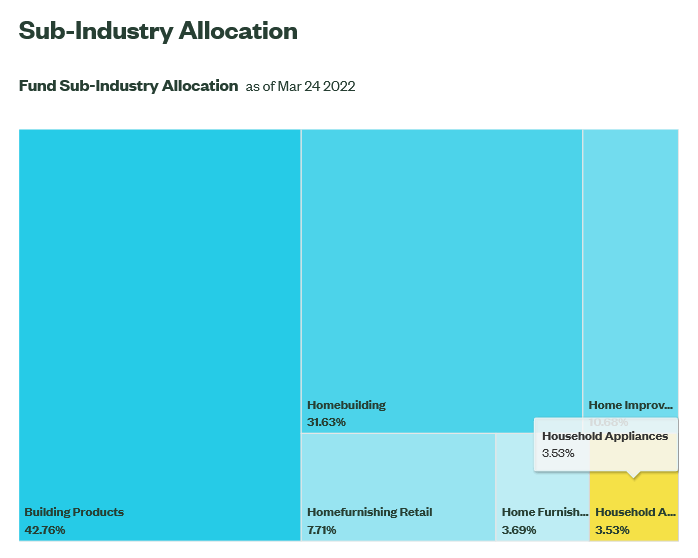
My standard method for analyzing a sector-specific ETF is to first look at the macroeconomic backdrop followed by an analysis of the ETF’s charts.
Let’s start by looking at sales activity Existing home sales comprise about 90% of the market:
Existing homes sales (Calculated Risk)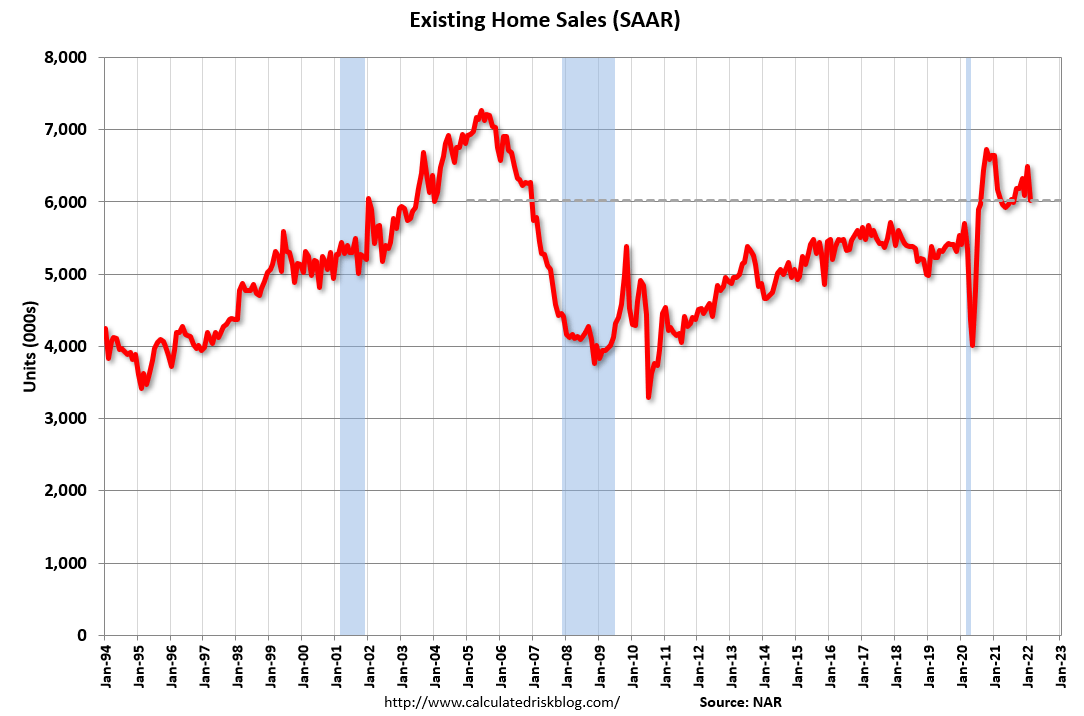
While not as high as the peak during the housing bubble, overall sales activity is still very strong.
New home sales, FRED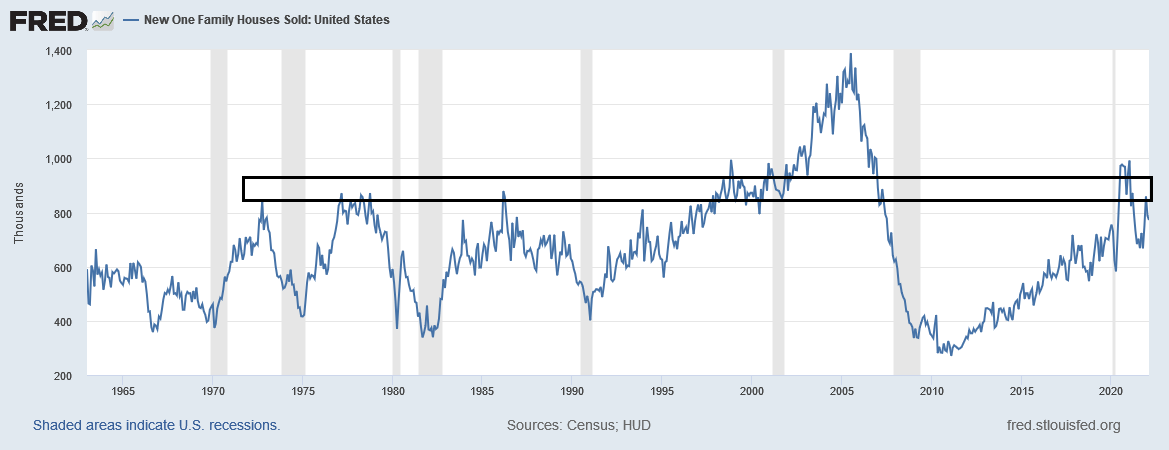
New home sales comprise about 10% of the housing sales market. The current pace is near highs seen during the three economic cycles before the housing bubble.
However, there is an affordability problem.
Cash Shiller home price indexes, FRED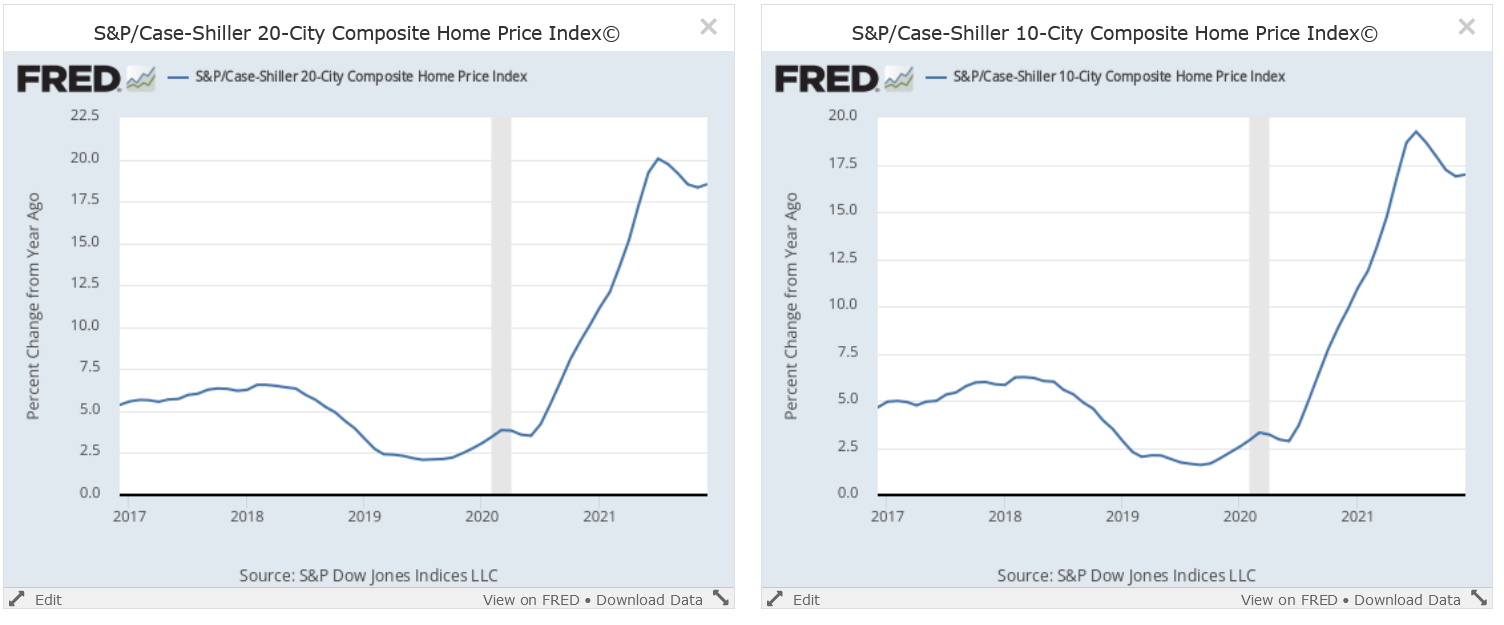
The Case Shiller price indexes show that home prices are growing at very fast rates.
Median and average new home prices, FRED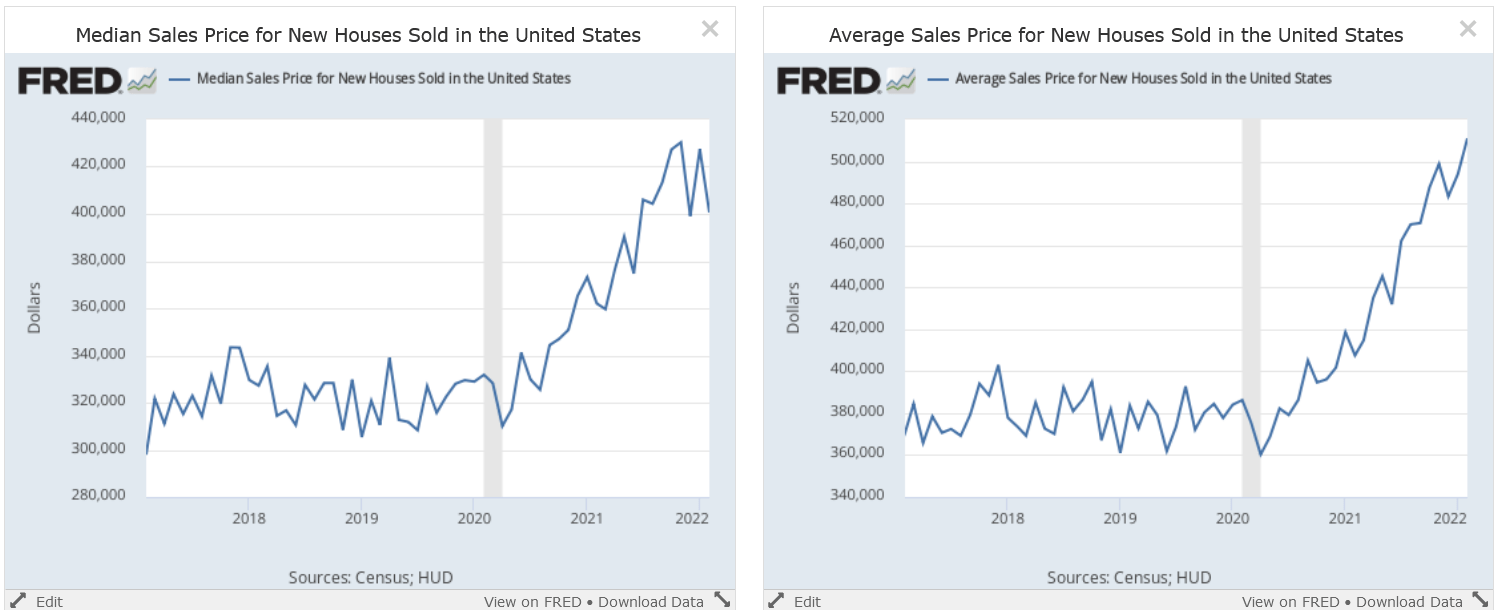
The median home price for a new home (left) is just over $400,000 while the average price (price) is now over $500,000.
And the price of financing is increasing:
15 and 30-year mortgages, FRED
Due to the Fed becoming more hawkish, both 15 and 30-year mortgages (left and right, respectively) are rising at a brisk clip.
Finally, there’s homebuilder sentiment:
Ongoing lumber and building material supply-side constraints and rising construction costs and expectations of higher interest rates continue to negatively affect builder sentiment even as buyer demand remains relatively solid.
Builder confidence in the market for newly built single-family homes moved two points lower to 79 in March from a downwardly revised reading in February, according to the National Association of Home Builders (NAHB)/Wells Fargo Housing Market Index (HMI). This is the third straight month that builder sentiment has declined and the first time that the HMI has dipped below the 80-point mark since last September.
While builders continue to report solid buyer traffic numbers, helped by historically low existing home inventory and a persistent housing deficit, increasing development and construction costs have taken a toll on builder confidence.
This is similar to the sentiment readings for most durable goods manufacturers. Demand is still strong but supply issues are constraining builders’ ability to provide adequate supply.
Here’s a chart of builder’s sentiment to place the data into historical perspective:
Builder sentiment (Calculated Risk)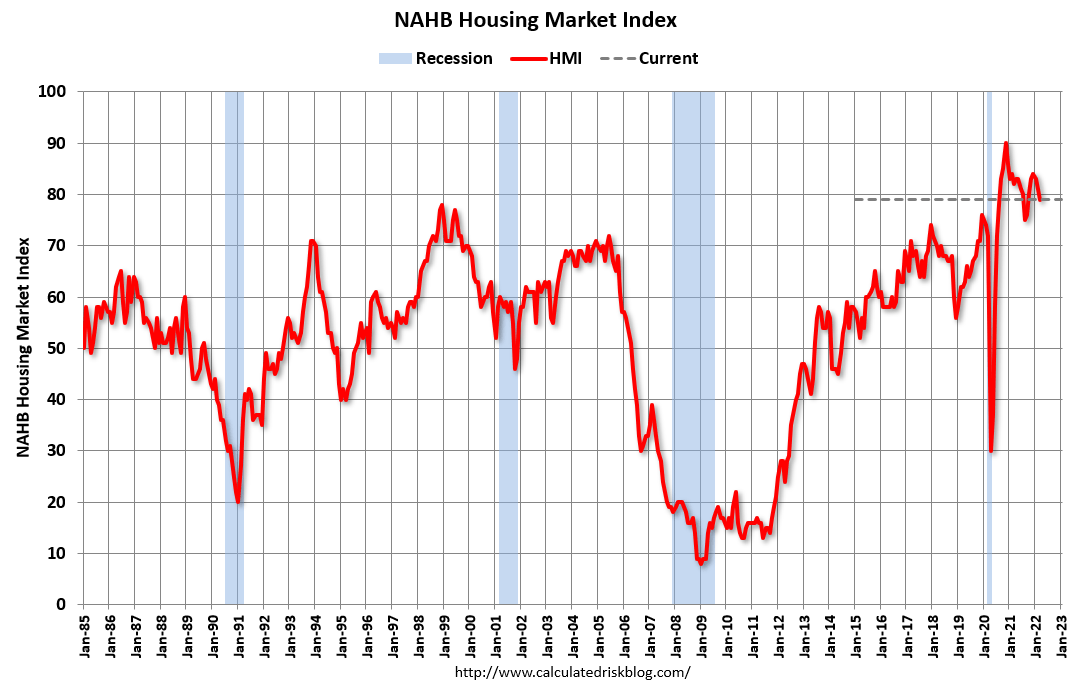
Sentiment is still clearly high. However, it peaked at the end of 2020 and has been trending modestly lower since.
To sum up the macro environment, the best of times are over due to the recent run-up in interest rates. Sales activity is still strong but will diminish during the next 6-12 months as the cost of capital increases. This will lead to lower builder sentiment.
Investors are trading the ETF as if the above analysis is already in play:
XHB weekly and daily charts (StockCharts)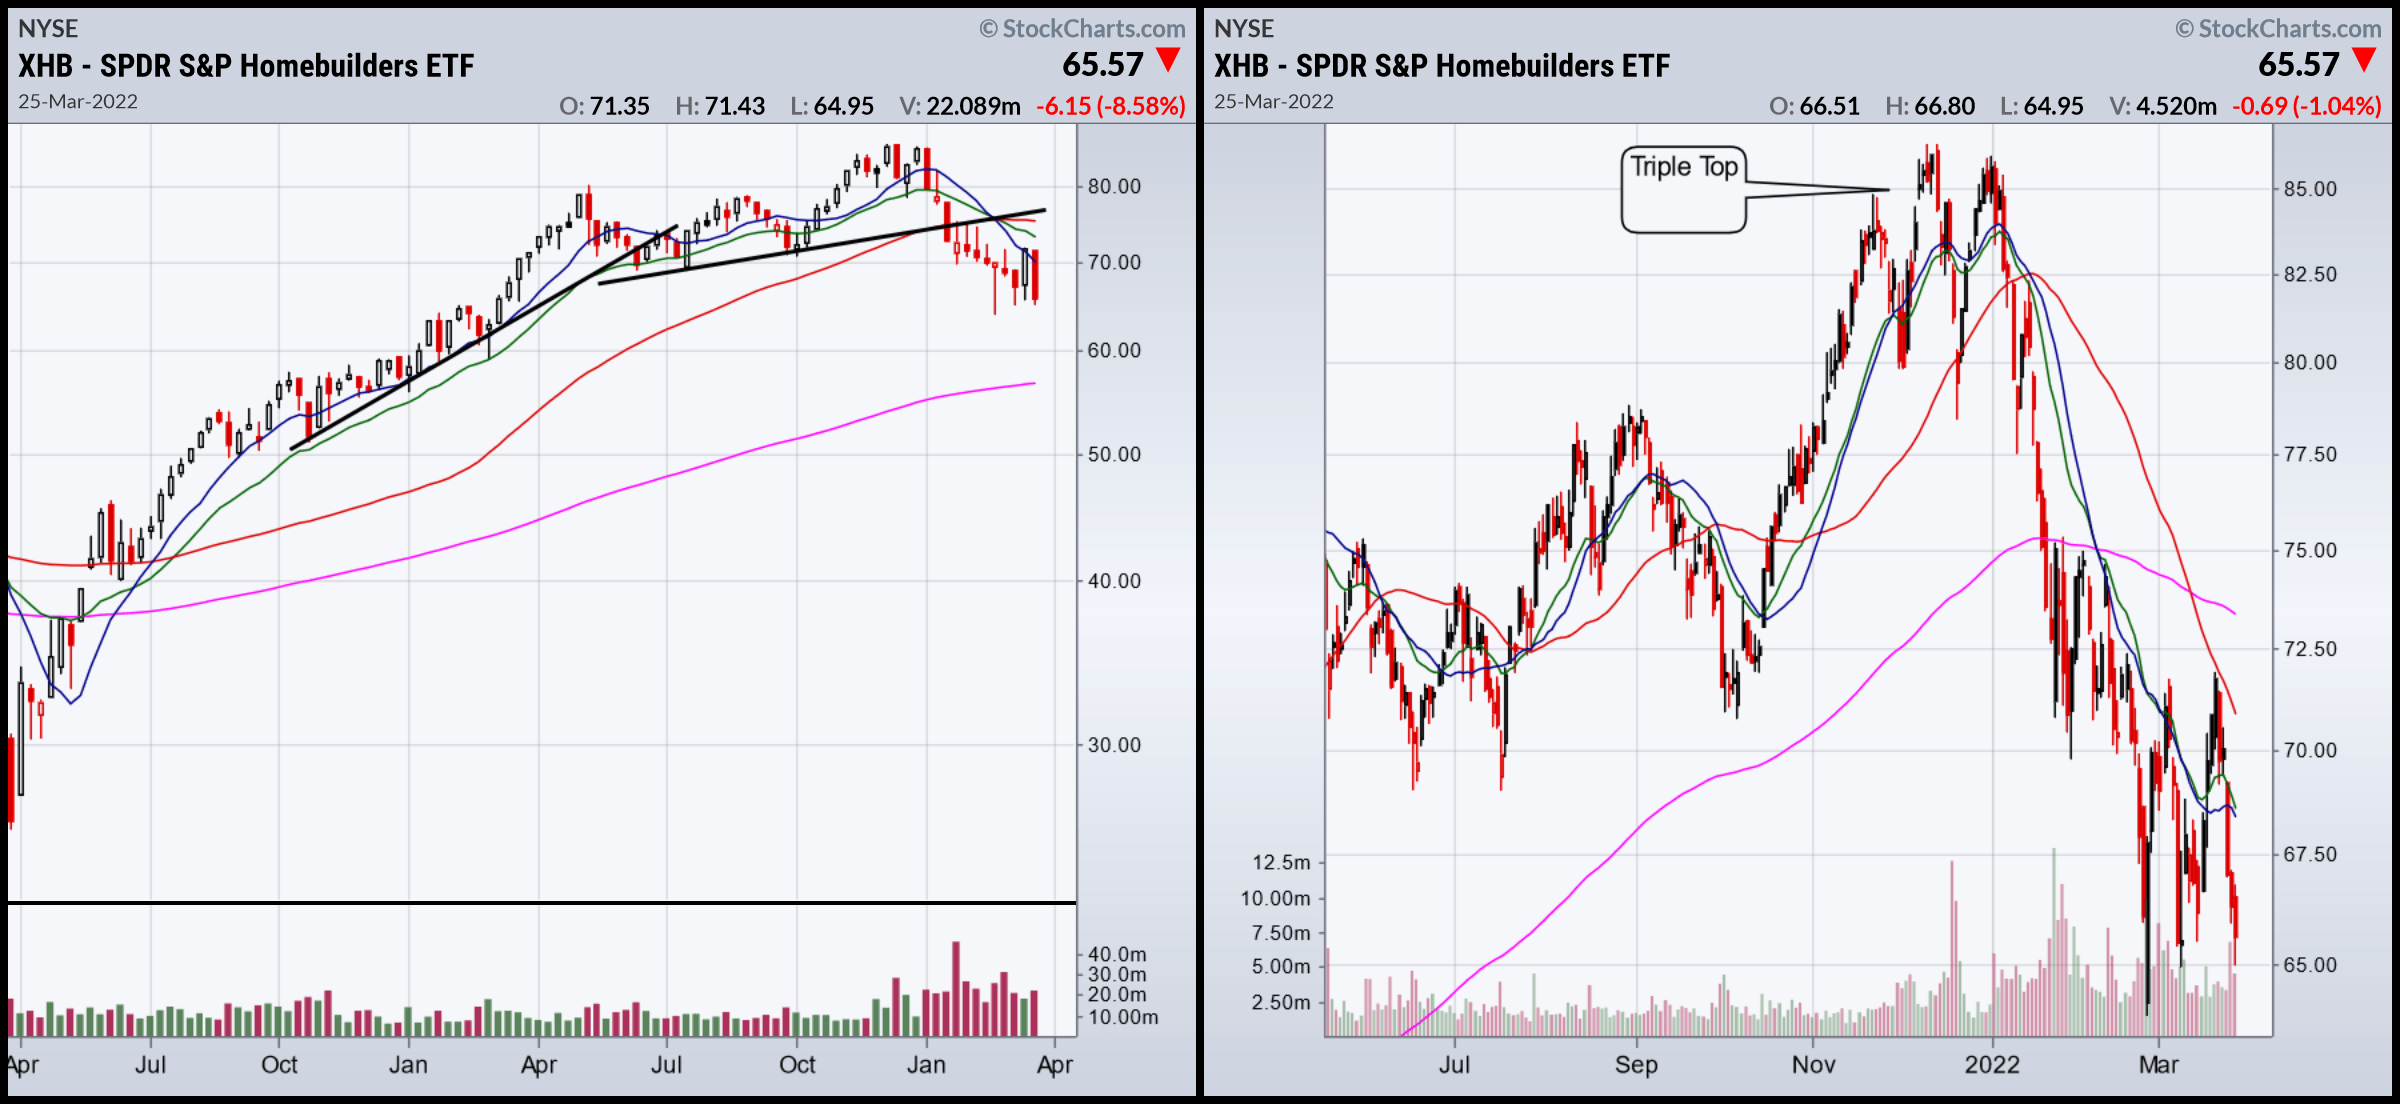
The left chart shows that the rate of increase slowed until 4Q21. Price broke support at the start of 2022 and began moving lower. The right chart shows the ETF printed a triple top at the end of last year. Prices are now below the 200-day EMA.
Housing is perhaps the quintessential example of an interest rate dependent economic sector. With rates rising, the best of times are over for this cycle. Look elsewhere for gains.
Be the first to comment