

da-kuk/E+ via Getty Images
This article was first released to Systematic Income subscribers and free trials on Apr. 7
The incongruously named XAI Octagon Floating Rate & Alternative Income Term Trust (NYSE:XFLT) remains one of the higher-yielding credit CEFs which, along with its strong performance over the last few years, has caught investor attention.
In this article, we discuss the fund’s allocation profile, valuation and performance. We also take the opportunity to clear up some misconceptions about the fund that remain in the investor community based on our conversations on the service.
This article is part of a series where we highlight some important misconceptions about popular income funds. Read other articles in the series about the Virtus InfraCap U.S. Preferred Stock ETF (PFFA) here, the PIMCO Global StocksPLUS & Income Fund (PGP) here, the PIMCO Dynamic Income Opportunities Fund (PDO) here and the KKR Income Opportunities Fund (KIO) here.
A Quick Overview
XFLT has a fairly unusual allocation profile in the CEF space with roughly half of its portfolio in CLO securities (primarily CLO Equity) with the rest primarily in loans (with a smattering of corporate bonds).
XFLT Website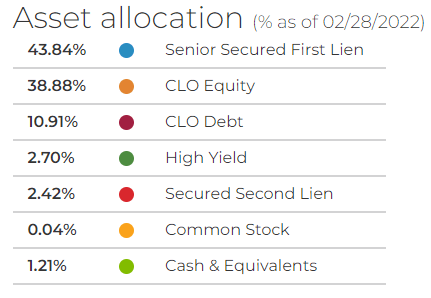
This allocation profile is unusual because most credit CEFs tend to do one thing or the other. For example, the vast majority of loan CEFs hold primarily loans (some do have a small allocation of CLOs but nowhere near 50% of XFLT). And most CLO CEFs like OXLC, OCCI, ECC and EIC primarily hold CLOs (the first 3 hold primarily CLO Equity while the last holds primarily CLO Debt).
This kind of barbelled allocation profile does have a number of benefits. Specifically, it makes the fund’s portfolio more liquid and resilient during drawdown periods. This is for the simple reason that loans are more liquid than CLO securities and can be typically transacted quicker and at a smaller cost (i.e. bid/offer). Loans are also lower-beta assets than CLO Equity or CLO mezz (i.e. sub investment-grade tranches) since these CLO securities carry embedded leverage (Equity on the order of 10x and CLO mezz in the low-to mid-single digits). When you put these two together it’s no surprise that XFLT outperformed the more pure-play CLO funds during the COVID drawdown in total NAV terms.
This outperformance has another benefit which is that it makes the fund less liable to a forced deleveraging. In fact, XFLT did not deleverage in 2020 unlike most of the pure-play CLO funds.
A Rundown Of Misconceptions
In this section, we take a look at some of the misconceptions about the fund that crossed our screen.
It doesn’t come any better than Octagon for CLOs.
We often hear breathless commentary like this is the “best” or “top” manager, however, there is often precious little evidence to back up these claims. In the case of XFLT, we haven’t seen a historical track record that compares Octagon to the rest of the CLO space and none was provided along with this claim that we saw. And while $30bn of AUM by Octagon may sound impressive, that’s not particularly big within the context of credit investment management where names like Oaktree, Blackstone, Ares, Apollo, Barings, BlackRock, Carlyle and many others run at least 5-10x that amount of AUM.
Even within the CLO space, Octagon is not particularly large as the following recent league table shows.
CLO Research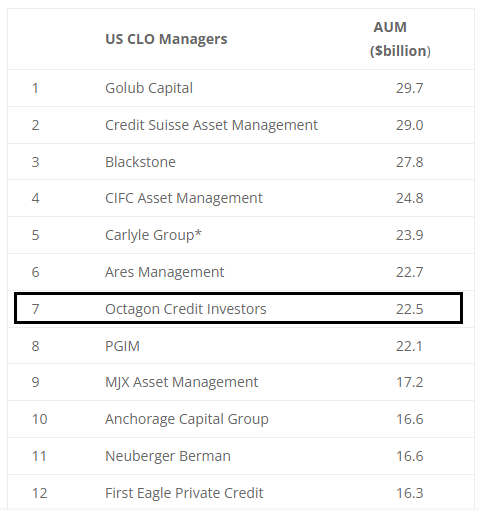
The key takeaway here is that whenever investors hear claims of unusual manager skill or talent they should ask for hard evidence to back this up.
Loans are great for risk-adjusted returns
We are told that loans are a great asset for risk-adjusted returns. And this is because they sit at the top of the capital structure and everything else in the capital structure has to do what loan holders say. Of course, as usual, we are not presented with the evidence here.
There are different ways to measure risk-adjusted returns. If we look at 5-year Sharpe ratios, we see that loans are actually not that impressive, not only within the broader set of assets but within the credit space itself. Loans lose out to BDCs (i.e. private credit), investment-grade corporate bonds, munis and high-yield corporate bonds. The chart below comes from our Funds Tool and, in this case, shows returns from benchmark ETFs for each asset class.
Systematic Income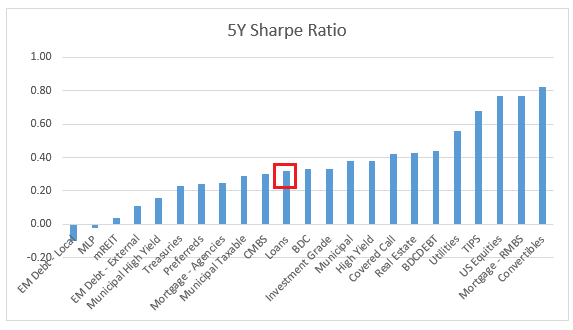
The second problem with risk-adjusted returns is that you can’t pay your bills with risk-adjusted returns. One of the very best risk-adjusted returns can be obtained in Treasury bills due to their minimal volatility. However, until recent Treasury bills paid investors close to zero which is not blindingly attractive. Even when the market and the Fed itself expect to stop hiking, T-bills will likely top out at yields of around 3% which is hardly going to set any income investor heart aflutter.
Getting the capital structure basics wrong
We are told that the following screenshot from CEFConnect represents the fund’s capital structure.
CEFConnect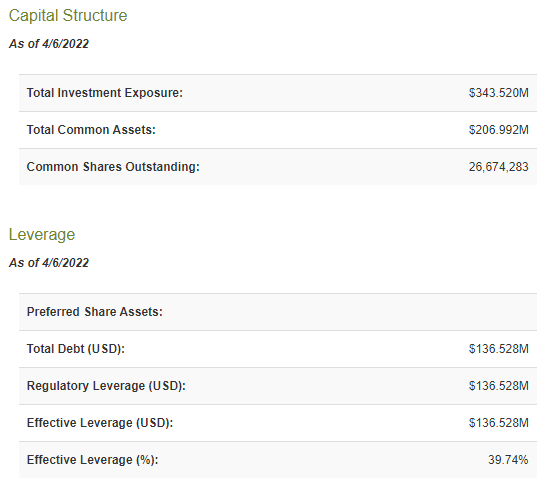
As we have highlighted repeatedly, we don’t think anyone should use CEFConnect for anything else than distributions and discounts (and even this with caution) because the numbers are often comically wrong. The real numbers are $412m (not $343m) total assets and $252m (not $207m) of net assets. The fund also most certainly does not have $136m of debt (more like $98m) and very definitely has $39m of preferreds outstanding (CEFConnect shows none). Oy vey.
XFLT Website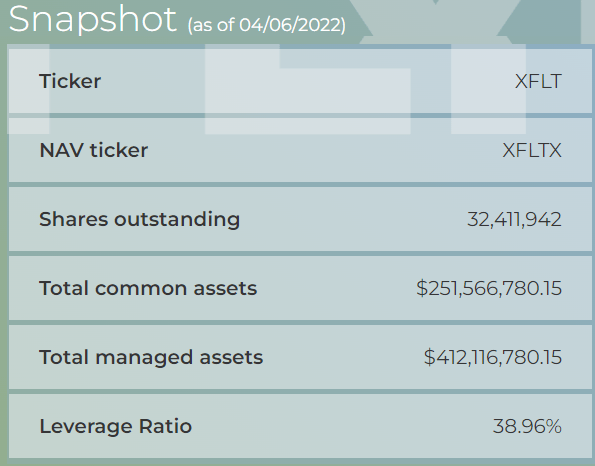
The reason CEFConnect is wrong about the fund’s assets is that they are using the number of shares as of the last shareholder report of $26.674m. And while this can work for many funds, it is spectacularly wrong for a fund like XFLT which has grown its share count by more than 21% since the report was issued last September. Why CEFConnect is wrong about the mix of debt and preferreds is anyone’s guess.
We are also told that the fund’s 40% leverage (i.e. [debt + prefs] / total assets) should rather be 66% i.e. debt / equity. This is a truly bizarre statement since CEFs all use the same former definition of leverage so if you insist on using debt / equity you won’t be able to compare across other CEFs. It’s sort of like walking into a shop and saying, well I know you use a base 10 number system to quote prices but I’m quite fond of Sumerians so can you tell me what this bottle of aspirin costs in base 60?
Staying on leverage, we are also told that leverage of around 40% is really high and lower leverage is better. The problem with this comment is that leverage doesn’t hang out there all by itself – it’s connected to other features of the fund like income and risk. It might make sense to say well there is a non-linearity in leverage and funds that carry leverage close to 40% are much more likely to be forced to deleverage, creating a drag on returns but of course there is none of this.
Or you could say, well loan discount margins are fairly tight right now so maybe running at 20-30% rather than 40% leverage makes more sense as that could leave some dry powder to allocate if/when loan valuations correct.
Saying 40% is high sort of implies you can keep everything else the same and just dial down leverage. Moving leverage lower will have an impact on forward returns as well as the fund’s income so you need to analyse the level of leverage together with the things that it impacts rather than on a standalone basis. Ultimately, what most income investors are after are strong through-the-cycle returns. Increasing leverage can boost those returns as well as take away from them depending on the fund’s dynamics and the broader market environment.
The key takeaway for investors is to understand that it isn’t just whether leverage is high or low but whether the fund’s leverage profile is resilient or not. There are three important points to be aware of. First, relative to other CLO Equity funds, XFLT has half of its portfolio in more liquid and lower-beta assets. And second, XFLT now sources part of its leverage via a preferred – a much more robust form of leverage than a credit facility as it cannot force a fund to deleverage immediately. Three, XFLT was not forced to deleverage during the COVID drawdown (a forced deleveraging typically locks in economic losses for investors as the fund sells assets at low prices only to buy them back later once prices have recovered).
This doesn’t mean that XFLT can’t suffer mark-to-market losses during a volatility spike or that it won’t ever be forced to deleverage when push comes to shove, but a focus on the leverage number itself is much too simplistic.
XFLT returns are bad
We are told that XFLT longer-term returns are not all that good. This does raise the obvious question of the earlier praise for Octagon but let’s leave that to the side for the moment.
XFLT returns are not that good apparently because its since-inception total NAV CAGR is around 5.1% (you will see a higher number on the XFLT website, however, that’s only up to end of Feb). We are told that because 5.1% for around 4.5 years is roughly what the CLO Debt index delivered below that’s a poor result because XFLT, after all, uses leverage and also allocates to higher-yielding CLO Equity.
Palmer Square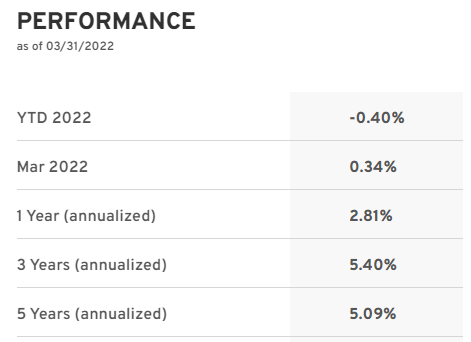
This comparison is obviously wrong on four fronts. First, indices are not directly investable so you have to take things like trading costs into account. Second, the period windows of 4.5 years and 5 years might seem close enough for government work but it’s kind of lazy. If we compare an exact period that we have access to (for both the CLO Debt index and XFLT) such as 3 years then XFLT comes out ahead 7% CAGR to 5.4%.
Third, XFLT very clearly does not just allocate to CLO Debt. In fact the fund only holds 11% of its portfolio in CLO Debt. And if we further look at the rating composition of the Palmer Square CLO Debt index the overlap between XFLT and the CLO Debt index falls to single digits. In short, it is very odd to compare the fund to an index which has almost no overlap with its actual portfolio.
We are also told that the fund has delivered flat returns from inception (from end of 2017) to Feb-2020 which is also bad. Intuitively, that doesn’t sound great but it’s not explained nor is any context provided. We could easily point to many periods of flat stock returns, for example, however does that make stocks a bad investment?
The key point is that this period was a particularly difficult one for CLO Equity. A quick look at the total NAV returns of XFLT in the context of pure-play CLO Equity funds OXLC and ECC shows two things. First, other funds with CLO Equity allocations struggled as well. And second, XFLT actually outperformed these funds over this period.
Systematic Income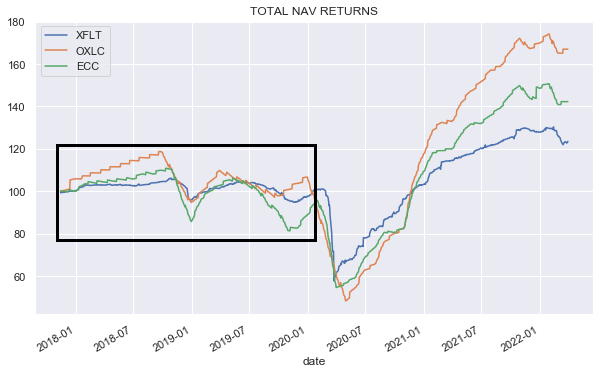
Even a cursory look at the fund’s shareholder report will show that the headwind the fund experienced was primarily due to unrealized losses in its CLO Equity positions which were subsequently reversed.
We are also told that XFLT bounced back sharply post-COVID because they presumably bought cheap assets at low prices. Readers should understand that “presumably” is another word that analysts use when they are too lazy to do the background work (guilty as charged!).
And, of course, a basic understanding of CEF mechanics will tell that CEFs are not in position to buy a lot of cheap assets during sharp drawdowns because their leverage levels rise sharply. In fact, what happened was that asset prices recovered and CLO Equity managers were able to monetize the loan prepayment option by allocating loan repayments to low dollar price loans.
Coming back to overall performance, let’s see if we can do better. Let’s first compare how the fund (recall its portfolio is about half loans) has performed relative to loan CEFs (most of which are pure-play loan funds but some also have minority allocations to CLO Debt). XFLT has put up one of the better track records relative to loan CEFs. Sort of makes sense.
Systematic Income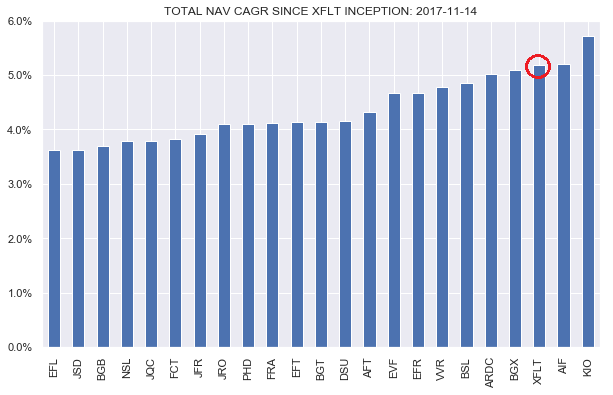
Now let’s also compare how XFLT has done relative to CLO-Equity funds. On this basis we see that it has significantly underperformed – OXLC by more than 7% per annum and ECC by about 3.5% per annum. Again, sort of makes sense.
Systematic Income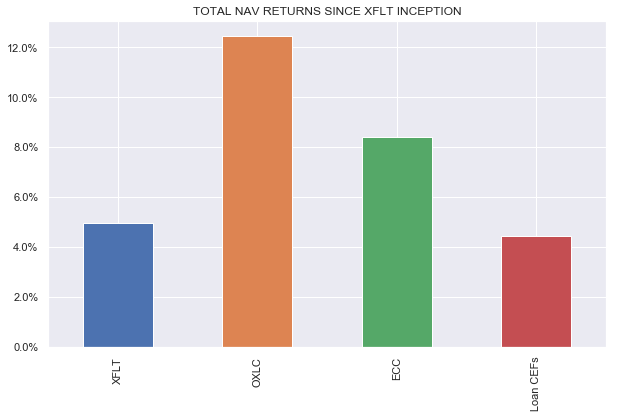
Overall, given the fund’s roughly-half CLO Equity and roughly-half loan allocation, we would have expected its total NAV return to be higher than what it actually is by around 2-3% or closer to the middle-point of OXLC/ECC and Loan CEFs. Coming back to the point about Octagon management – this sort of performance doesn’t scream “best manager” to us, after all. Evidence can be a wonderful thing.
A better bet is to hold the fund’s preferred shares (NYSE:XFLT.PA) for a 6.37% stripped yield
This is a pretty dangerous comment because it only highlights the stripped yield which is a yield that assumes the stock will never be redeemed. However, if it is redeemed on the first call date in March-2023 its actual yield will be 4.52% – or close to 2% below the advertised yield. This is for the simple reason that the stock trades at a stripped price above $25 which will exert a headwind for returns. It also implies that its redemption likelihood is quite high and is our base case. This is because by keeping the stock substantially above $25 (by nearly 2%) the market communicates to the issuer that it is perfectly willing to take a lower coupon on the stock than its coupon – lower by 2% in fact (4.52% yield-to-call versus 6.5% coupon). You can believe that this message is heard loud and clear by XFLT management who are not just going to leave money on the table. Overall, the CLO CEF preferreds sector has seen heavy redemption in 2021.
Takeaways
Ultimately, it remains our core belief that for investors to hit their investment goals they need to, at least, have good information at their disposal. This is why we continue to push back on some of the things that are likely to misinform investors and lead to bad decisions in pursuit of their investment goals.
Overall, we do like the idea of pairing higher-yielding / less liquid CLO Equity securities alongside more resilient / more liquid first-lien loans and it’s a surprise that XFLT is the only publicly traded CEF that follows this allocation model. Overall, however, our view of the fund is tempered by a number of things. First, its 9% premium is not cheap. Second, its fee structure is expensive at a 1.7% management fee on total assets with a very high-coupon preferred that forms part of its leverage structure. Third, the fund’s performance is not terrible but it’s also not stellar given its higher-yield profile. Finally, loan discount margins are pretty tight / expensive and XFLT assets, particularly CLO Equity, are highly sensitive to credit weakness. XFLT is a nice fund to have on investor watchlists to nibble on once we see weakness in credit valuations and the fund’s premium move into discount territory. We remain on the sidelines for now.
Be the first to comment