

GOLD TALKING POINTS
- Strengthening dollar could disrupt gold upside.
- NFP in focus later today.
- Price action points to impending gold weakness.
XAU/USD FUNDAMENTAL BACKDROP
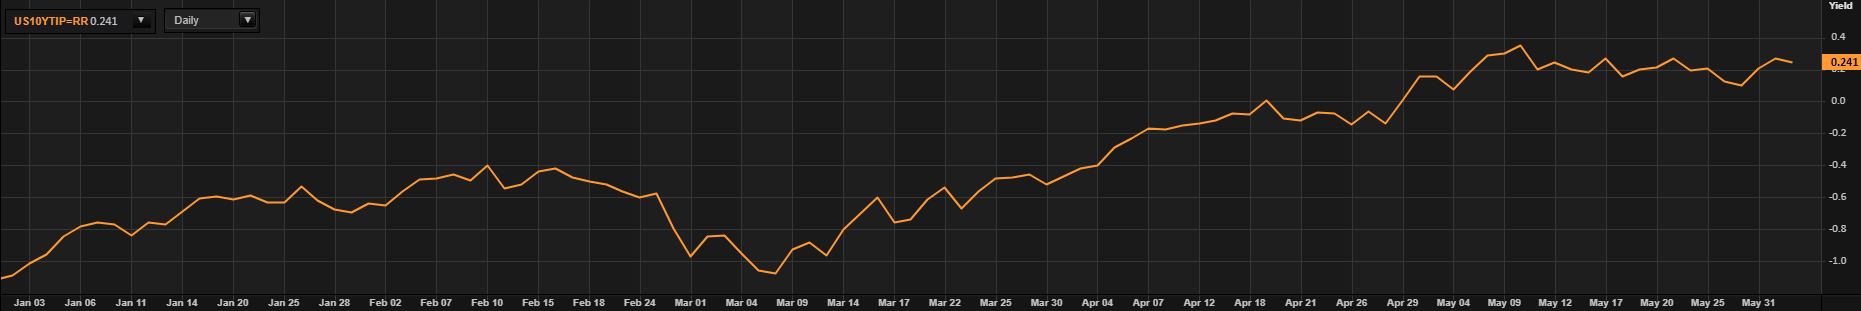
Gold is taking a breather as we enter the European session (after yesterday’s ascent) as the U.S. dollar looks ahead to the Non-Farm Payroll (NFP) print later today. We saw a risk-on mood yesterday leaving the greenback on offer including a weak ADP employment number that fell well short of expectations. The 10-year real yield (see graphic below) subsequently dropped allowing bullion to push higher as the opportunity cost of holding gold declines.
U.S. 10-YEAR TIPS BREAKEVEN RATE
Source: Refinitiv
It is important to remember that ADP is not at all an accurate precursor to NFP’s, so a figure around the 325K is still on the table. I believe anything in line or above 325K will significantly bolster the dollar considering the recent strong manufacturing PMI release as well as last nights hawkish comments from the Fed’s Mester.
Today, the economic calendar is clearly dominated by the NFP issue but volatility will likely remain as U.S. services and the Fed’s Brainard (hawkish) may add to dollar upside thus weighing negatively on gold prices.
ECONOMIC CALENDAR
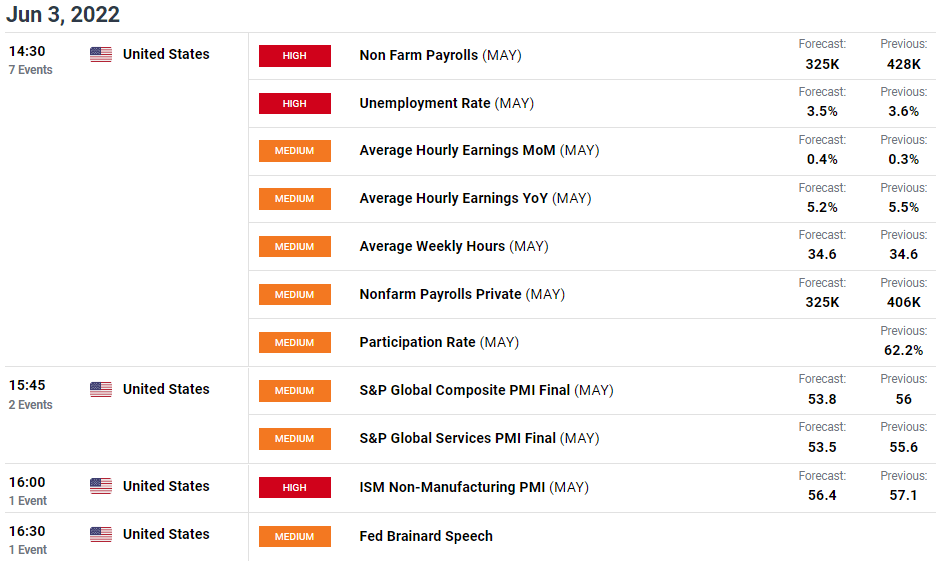
Source: DailyFX Economic Calendar
Gold’s safe haven appeal has been somewhat diminished of recent although the recent EU embargo on Russian oil has kept the possibility of a retaliation very much alive. Should Russia hold off on gas exports to the EU, we could see severe consequences for within the eurozone which could reignite the price of spot gold.
TECHNICAL ANALYSIS
GOLD PRICE DAILY CHART
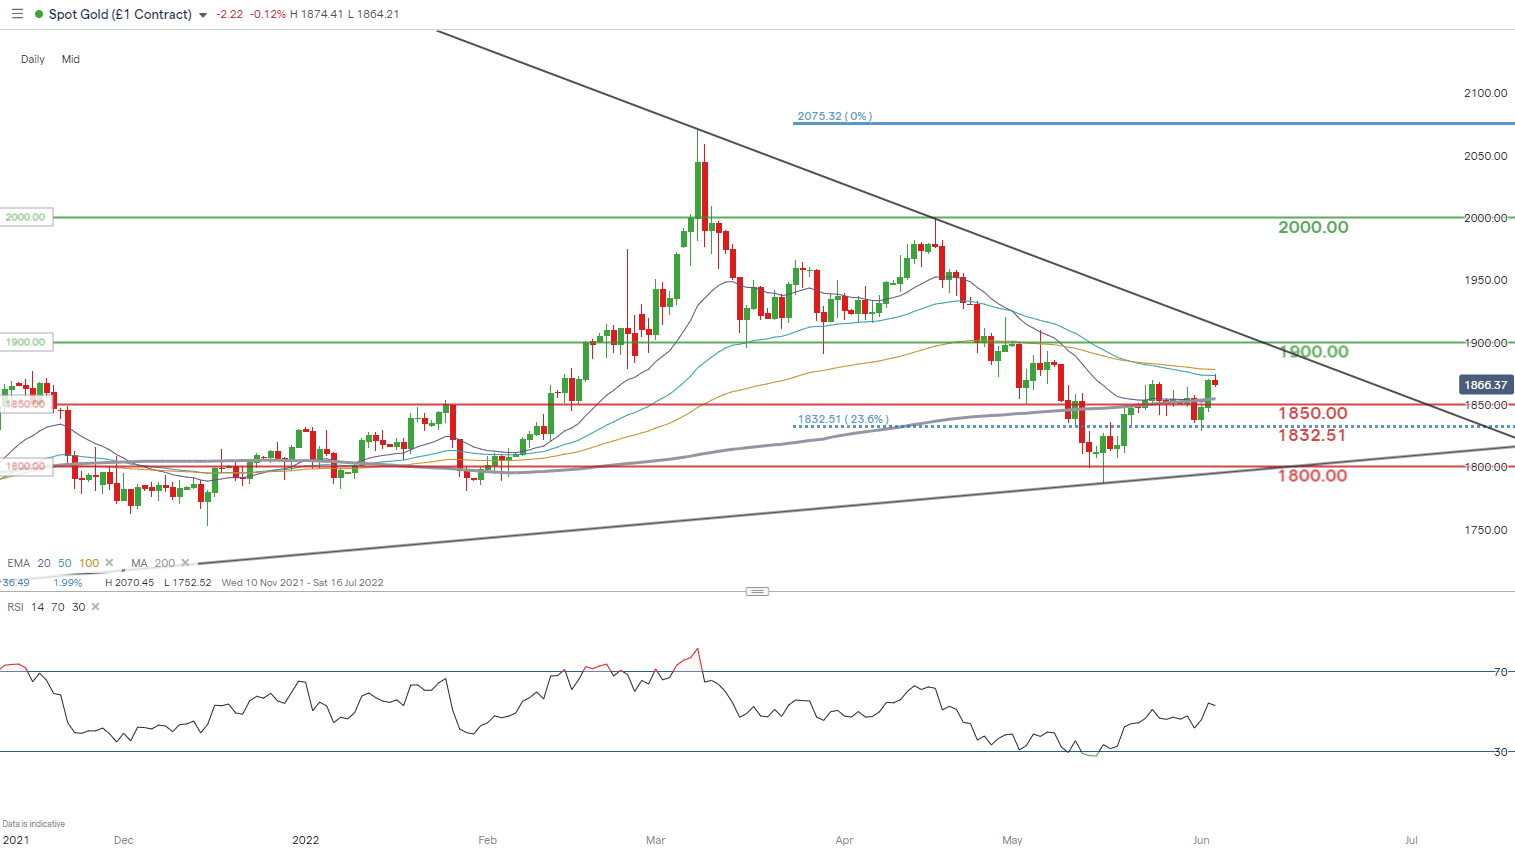
Chart prepared by Warren Venketas, IG
Current gold price action reflects a weaker dollar and expectations of a less aggressive Federal Reserve (weaker dollar) but this could be taking a turn in the near-term. While there is still room for this short-term relief rally to continue, my dollar outlook remains positive which should result in gold prices pushing below the psychological $1850.00 support handle in due course.
The downward sloping trendline resistance (black) could serve as a barrier for this turnaround and should coincide with an overbought Relative Strength Index (RSI) reading.
Resistance levels:
Support levels:
- 1850.00/200-day SMA
- 1832.51 (23.6% Fibonacci)
- 1800.00
IG CLIENT SENTIMENT: BULLISH
IGCS shows retail traders are currently distinctly LONG on gold, with 78% of traders currently holding long positions (as of this writing). At DailyFX we typically take a contrarian view to crowd sentiment however, due to recent changes in long and short positioning we arrive at a short-term upside bias.
Contact and follow Warren on Twitter: @WVenketas
Be the first to comment