

British Pound Vs US Dollar, Euro, Japanese Yen – Price Setups:
- Still-hot UK wage growth hasn’t translated into higher GBP/USD yet.
- EUR/GBP is holding above vital support, frustrating bears.
- GBP/JPY continues to be well guided by a rising channel.
- What is the outlook and key levels to watch in select GBP crosses?
Recommended by Manish Jaradi
Improve your trading with IG Client Sentiment Data
The British pound is testing crucial support against the US dollar ahead of UK GDP data due later Wednesday.
The pound has been underperforming against some of its peers in recent weeks and so far, there is no sign of reversal. For more discussion on the underperformance, see “See “Pound’s Resilience Masks Broader Fatigue: GBP/USD, EUR/GBP, GBP/JPY Setups,” published August 23. The mixed UK jobs data on Tuesday did little to alter the soft bias. The blistering wage growth seals the case for a 25-basis points rate hike by the Bank of England (BoE) when it meets on September 22.
BoE Governor Andrew Bailey last week said interest rates might still rise further due to stick price pressures, but the central bank is “much nearer” to ending its tightening cycle. The key focus now shifts to UK GDP for July – expected 0.4% on-year, down from 0.9% in June. The three-month average, however, ticked up to 0.3% in July from 0.2% previously.
GBP/USD Daily Chart
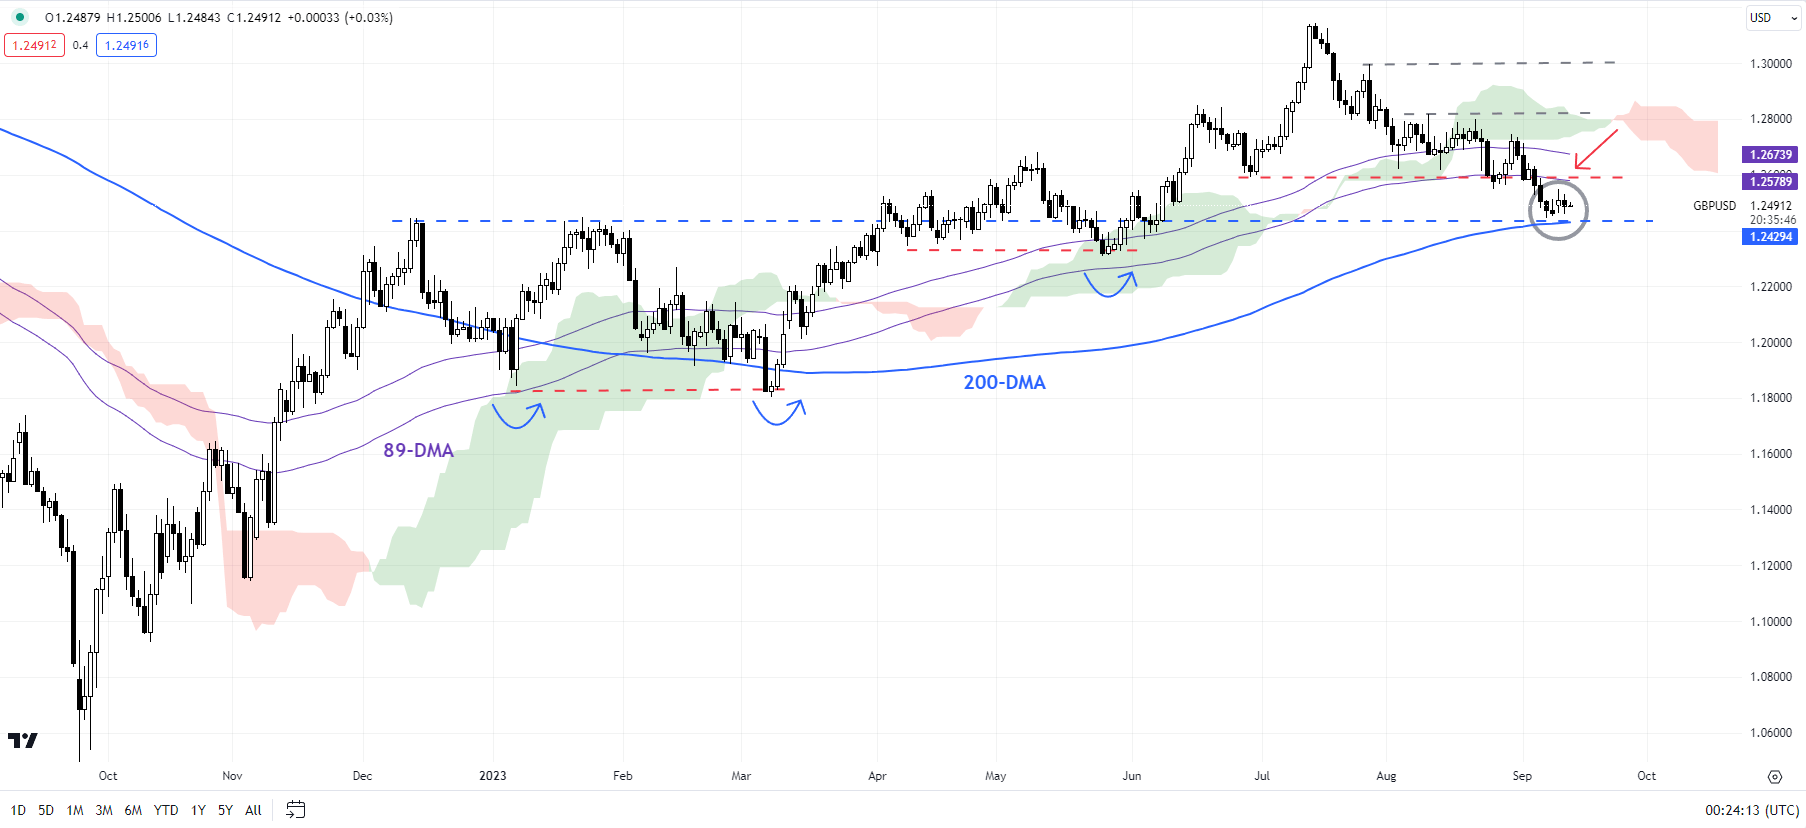
Chart Created by Manish Jaradi Using TradingView
GBP/USD: Testing vital support
On technical charts, the failure so far this month to rise past immediate resistance at the early-August high of 1.2820 has kept the downward bias intact for GBP/USD – a risk highlighted in theprevious update. Furthermore, in a sign of weakness, GBP/USD has failed to hold above vital converged support on the 89-day moving average, the lower edge of the Ichimoku cloud on the daily charts, and the end-June low of 1.2600. On the previous two occasions since the end of 2022, the pair has rebounded from similar support (see the daily chart).
GBP/USD 240-Minute Chart
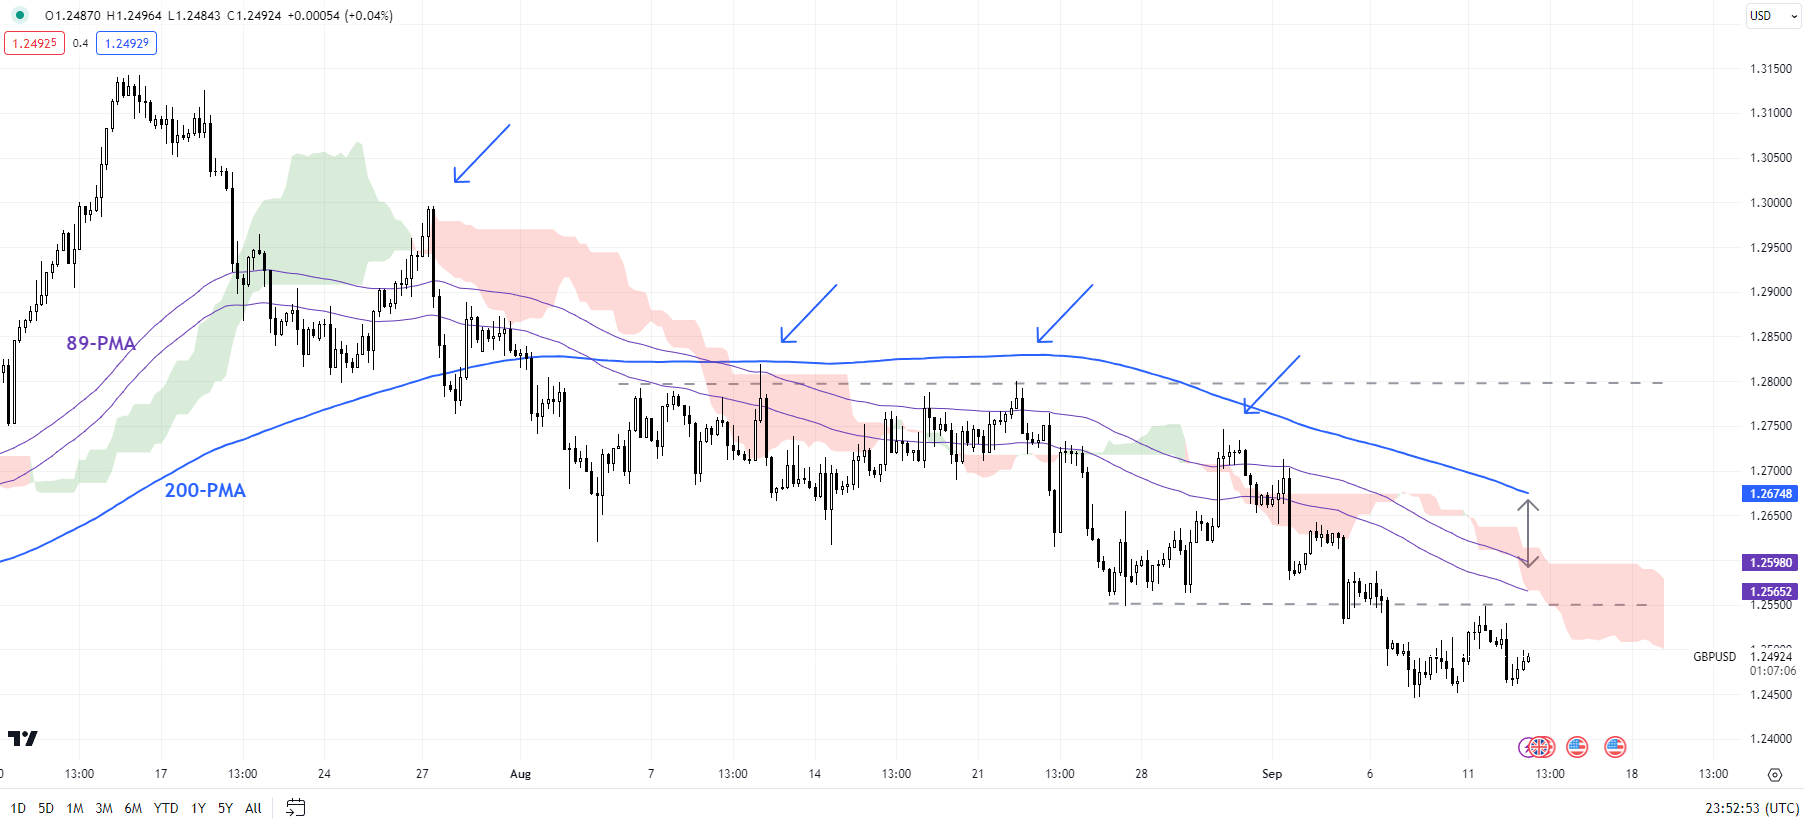
Chart Created by Manish Jaradi Using TradingView
The pair is now testing a crucial cushion on the 200-day moving average – the last time it was decisively below this average was in 2022. So, a hold above is key for the broader bias to stay constructive. From a medium-term perspective, the rise in July to a multi-month high has confirmed the higher-tops-higher-bottom sequence since late 2022, leaving open the door for some medium-term gains. (See “British Pound Buoyant Ahead of BOE: How Much More Upside?”, published May 8).
GBP/USD Monthly Chart
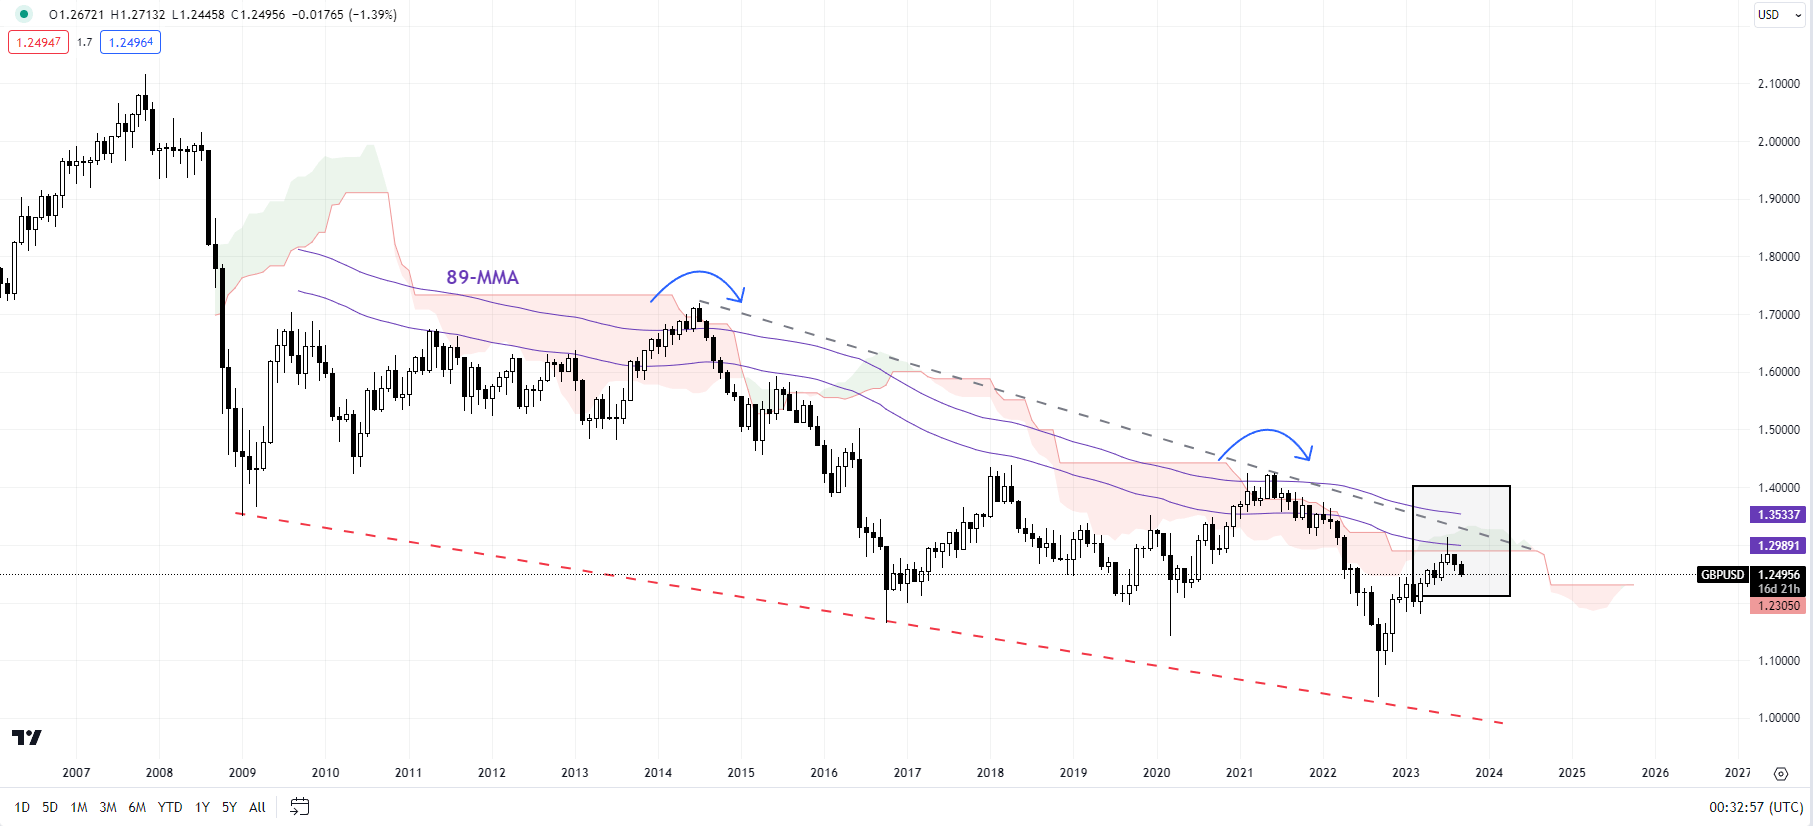
Chart Created by Manish Jaradi Using TradingView
Importantly, as pointed out late last year, a higher high this year (relative to 2022) could be unfolding into something more than just a corrective rebound, that is, it opens the door for a reversal of GBP/USD’s medium-term downtrend (first highlighted in October – see “GBP/USD Technical Outlook: Forming an Interim Base?” published October 3.
Recommended by Manish Jaradi
Building Confidence in Trading
Whether the medium-term rebound is the start of a long-term uptrend? To be fair, such evidence is lacking. GBP/USD remains below major resistance on the 89-month moving average and the Ichimoku cloud on the monthly charts, coinciding with a downtrend line from 2014, suggesting the long-term downtrend is yet to reverse.
EUR/GBP Daily Chart
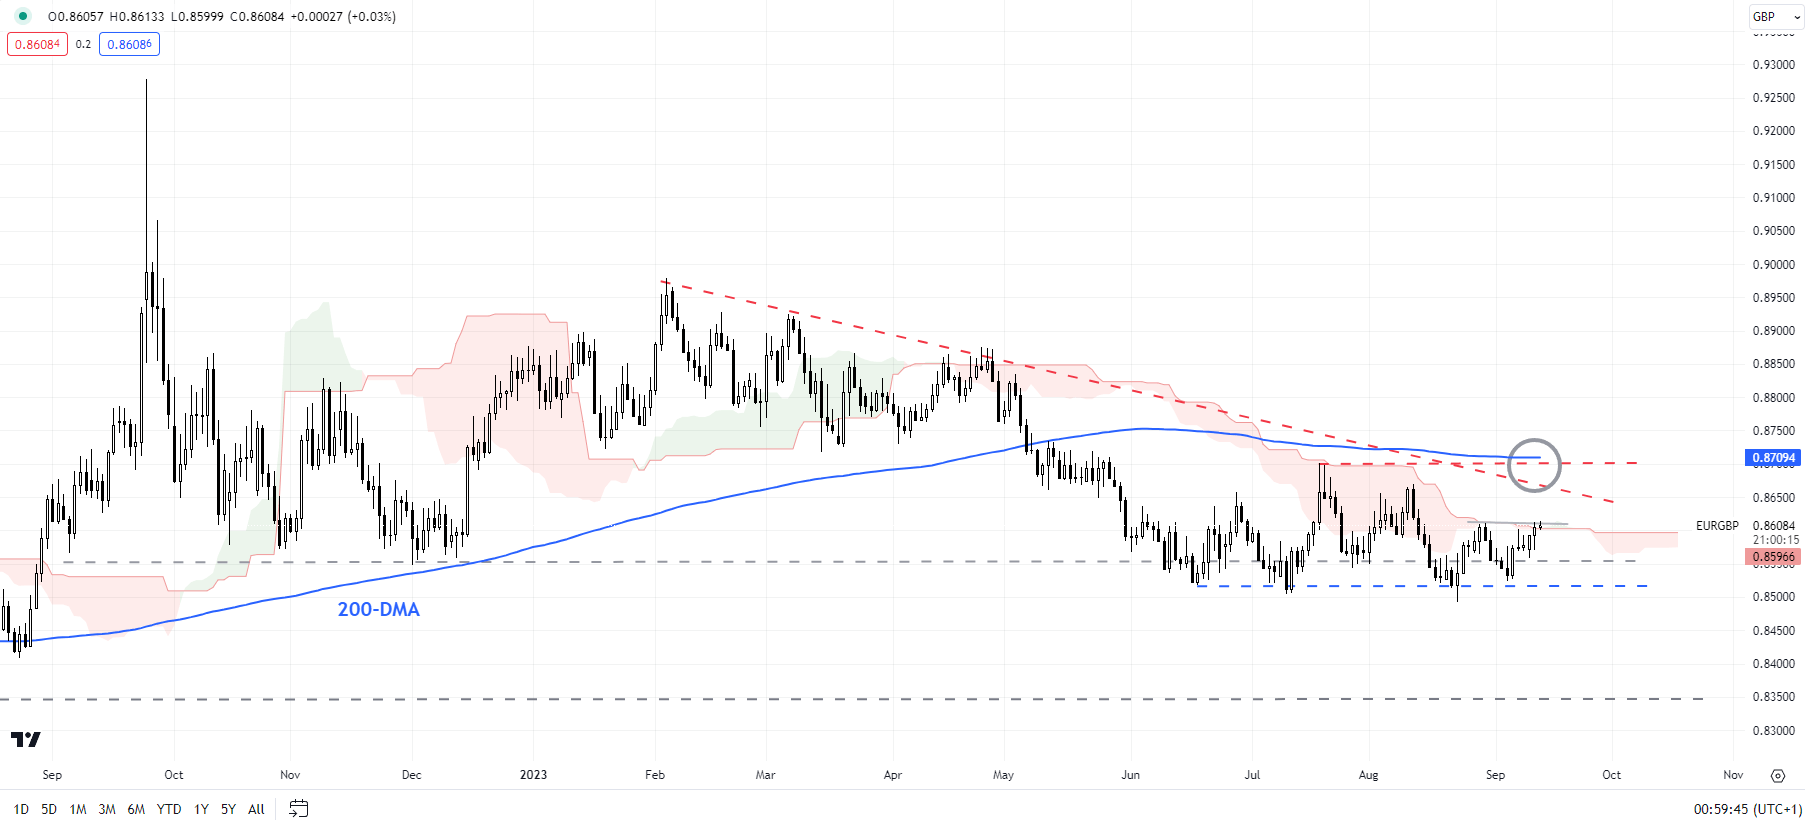
Chart Created by Manish Jaradi Using TradingView
EUR/GBP: Still holding above Q2-2023 support line
EUR/GBP continues to hold above the converged floor on a horizontal trendline from June and another horizontal trendline since late 2022 (at about 0.8550-0.8600). Still, unless the cross clears resistance at the mid-July high of 0.8700, the path of least resistance is sideways to down.
GBP/JPY Daily Chart
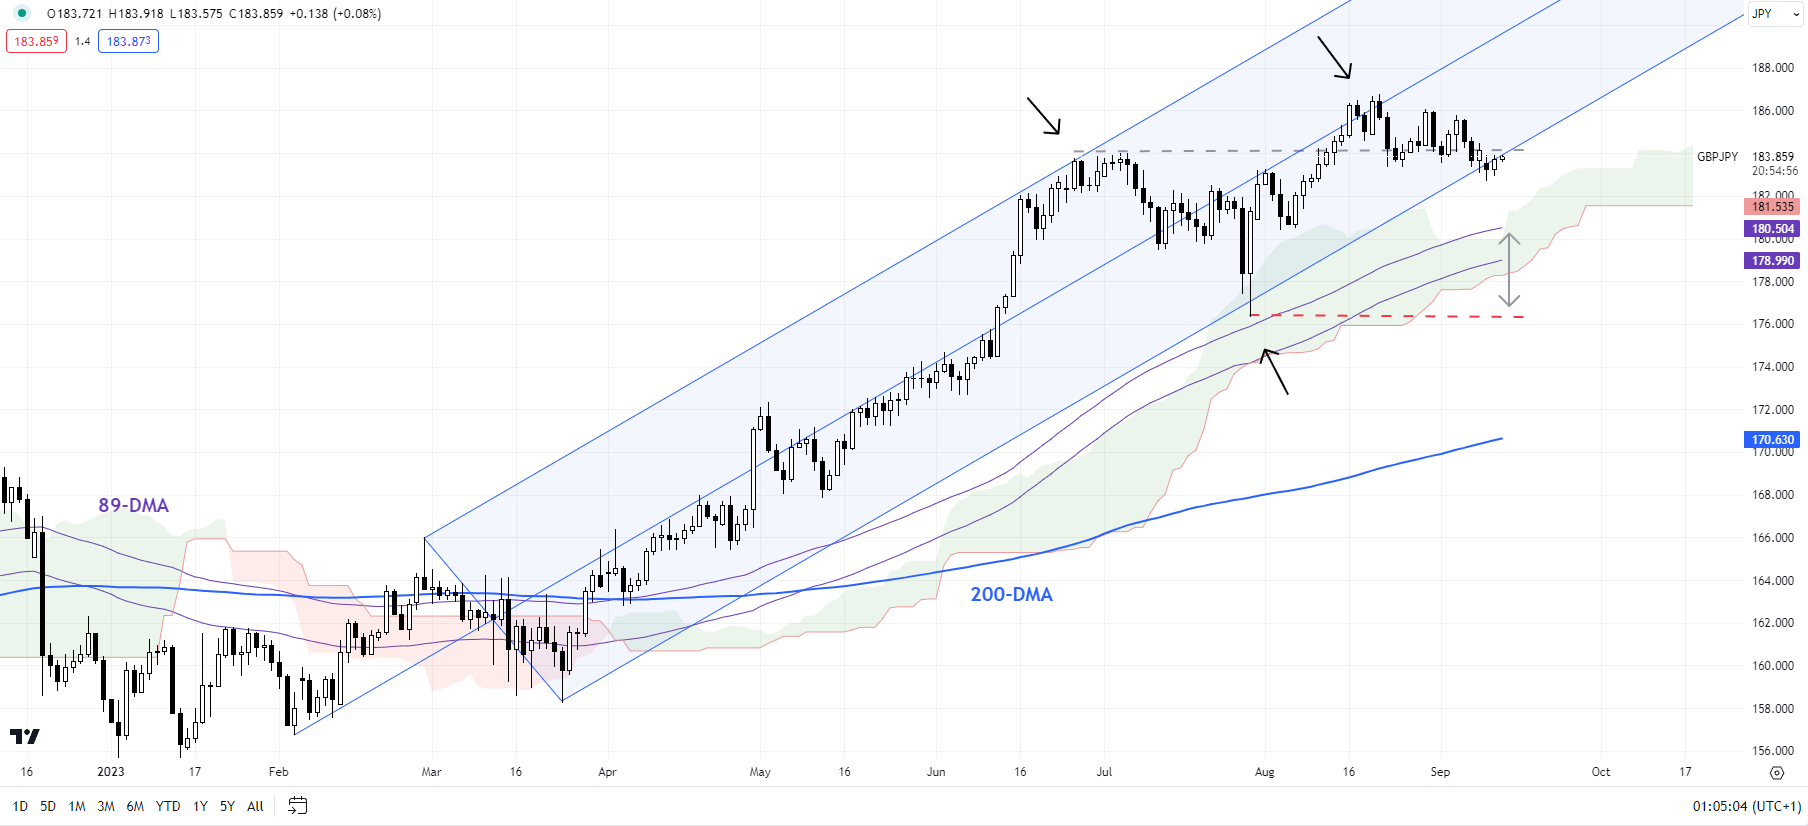
Chart Created by Manish Jaradi Using TradingView
GBP/JPY: Consolidation within the uptrend
GBP/JPY has continued to be well-guided by the rising Pitchfork channel since early 2023. However, most recently the cross has been struggling to hold above the resistance-turned-support at the July high of 184.00. A decisive break below would indicate that the immediate upward pressure had faded but won’t necessarily imply a reversal of the broader uptrend. Only a break below the July low of 176.25 would puncture the broader uptrend.
Recommended by Manish Jaradi
Elliott Wave for Beginners
— Written by Manish Jaradi, Strategist for DailyFX.com
— Contact and follow Jaradi on Twitter: @JaradiManish
Be the first to comment