

Recommended by Zain Vawda
Get Your Free Gold Forecast
XAU/USD Fundamental Backdrop
XAU/USD benefitted from dollar weakness to close out last week bullish as comments from Federal Reserve policymaker Mary Daly helped reign in rate hike expectations. The precious metal came within a whisker of the YTD low before rallying to close above the psychological $1650 level.
Fed policymaker Daly stated that a 75bp hike is still needed while confirming that stepping down will be necessary at some point. She went on to say that the Fed is likely to step down to 50bp or 25bp increments but unlikely to pause anytime soon. The most telling remark from Daly was the need to avoid an unforced downturn caused by overtightening. Markets were quick to interpret Daly’s comments as dovish which saw a brief dollar sell-off allowing gold to rally to a positive weekly close and avoid a new YTD low.
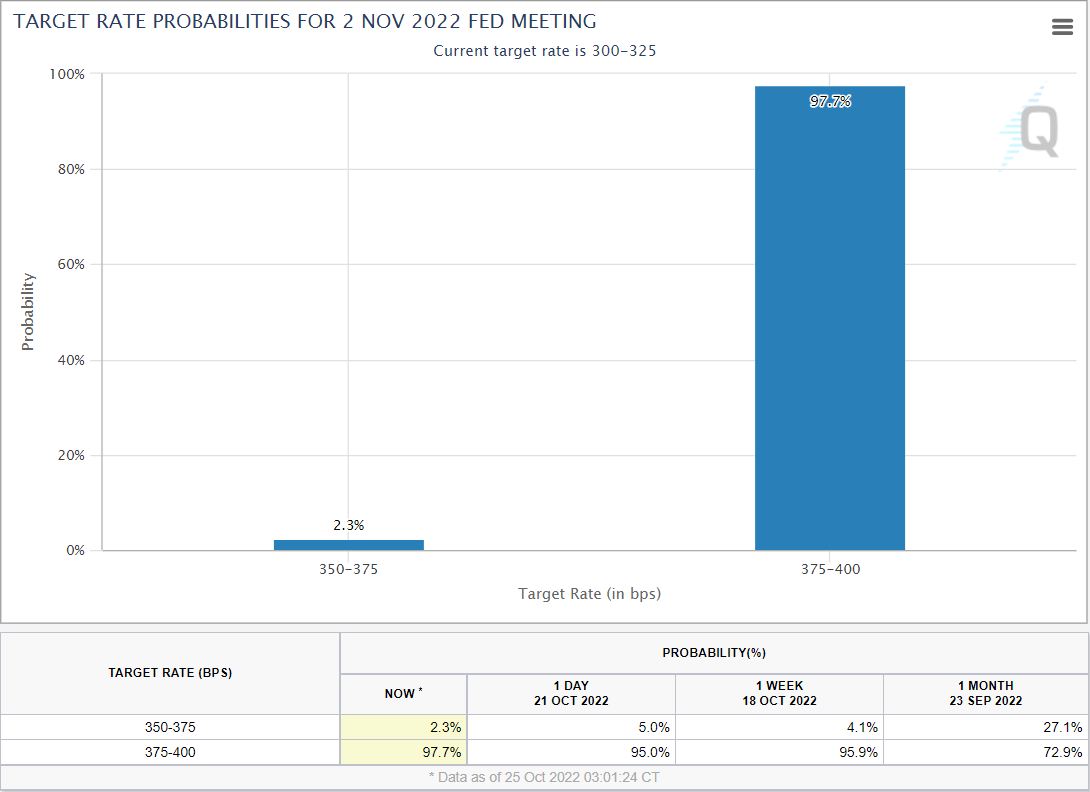
Source: CME FedWatch Tool
Given the continued changes in the Fed Funds peak rate expectations and the fact that the Federal Reserve have entered their blackout period ahead of next week’s meeting, gold looks increasingly likely to remain rangebound. The probability of a 75bp hike next week now sits at 97.7% with the future projections by the Fed likely to be of more interest to market participants. Should the Fed indicate a steeper hiking path moving forward the YTD low will come under threat, while any sign of dovishness could propel the precious metal toward $1700 mark and potentially higher.
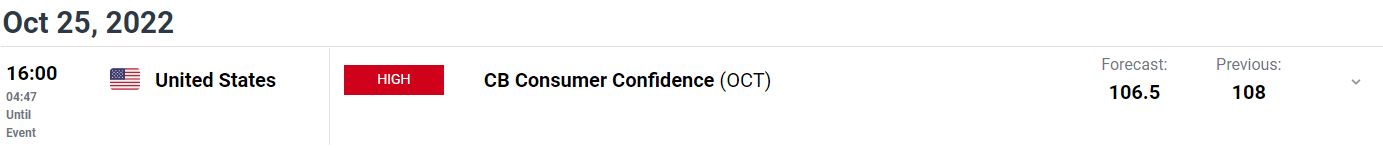
Later in the day we have CB Consumer Confidence numbers which will be followed on Thursday by the GDP Growth Rate QoQ. Neither of these events are likely to be enough to give the precious metal clear direction moving forward but could add some short-term volatility.
For all market-moving economic releases and events, see the DailyFX Calendar
XAU/USD Daily Chart – October 25, 2022
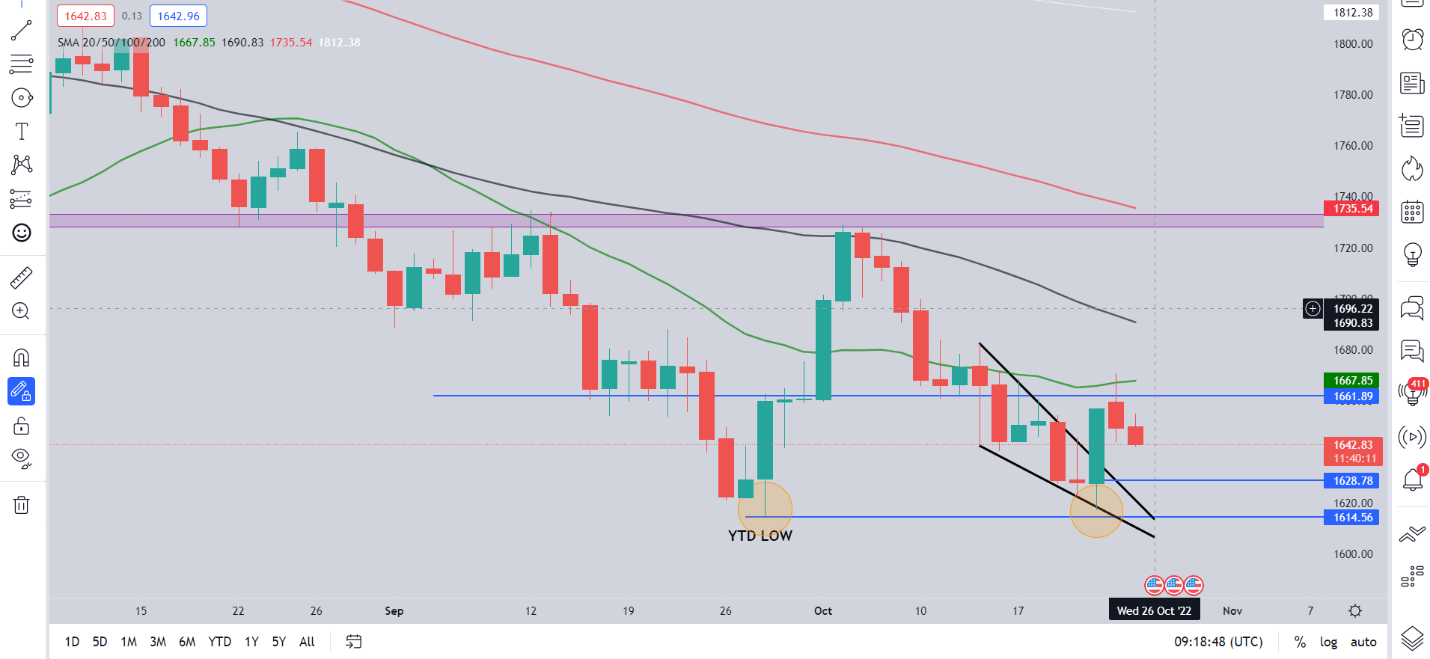
Source: TradingView
From a technical perspective, the bigger picture is interesting as Friday’s price action has resulted in a double-bottom pattern (See chart) on the daily chart while also breaking out of the falling wedge pattern. This would hint at a continued upside rally yet given the fundamentals at play we haven’t seen a sustained push higher.
Yesterday saw the metal find resistance at the 20-SMA while also posting a bearish daily candle close below the resistance area around $1661. Price has flirted with the $1650 psychological level in European trade this morning with a retest of the falling wedge a possibility. Alternatively, a break and daily candle close above $1661 could open up a retest of the top of the range at $1670 and a potential breakout.
Trade Smarter – Sign up for the DailyFX Newsletter
Receive timely and compelling market commentary from the DailyFX team
Subscribe to Newsletter
Key intraday levels that are worth watching:
Support Areas
•1630
•1614
•1600
Resistance Areas
•1661
•1670
•1685
| Change in | Longs | Shorts | OI |
| Daily | 6% | 2% | 6% |
| Weekly | 7% | -5% | 5% |
Resources For Traders
Whether you are a new or experienced trader, we have several resources available to help you; indicators for tracking trader sentiment, quarterly trading forecasts, analytical and educational webinars held daily, trading guides to help you improve trading performance, and one specifically for those who are new to forex.
Written by: Zain Vawda, Markets Writer for DailyFX.com
Contact and follow Zain on Twitter: @zvawda
Be the first to comment