

Crude Oil, WTI, Recession Woes, Falling Wedge – Talking Points:
- WTI crude oil is nearing a 10% loss this week, worst since March
- Such performance is not often, but is explained by recession woes
- Oil appears to be trading within a Falling Wedge chart formation
Recommended by Daniel Dubrovsky
How to Trade Oil
WTI crude oil prices are shaping up for a disappointing week. Prices are down about 9.5 percent this week so far. On Wednesday, the commodity extended losses, closing at a new low for this year, touching the weakest point since the end of 2021. A loss of 10 percent this week would result in the worst 5-day performance since March.
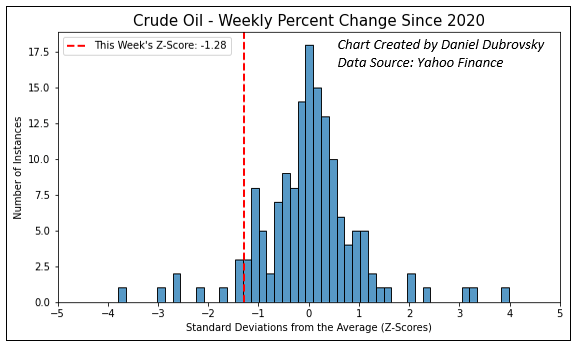
Looking at the average weekly performance since 2020, we can use a probability density function to see just how often we can expect this kind of price action to occur. On the chart below, this week’s z-score is shaping up to be about -1.3, which represents the number of standard deviations the drop is from the average. In other words, the probability that crude oil weakens 9.5% or more in a week is about 10%.
It should be noted that past performance is not indicative of future results, but crude oil’s drop has been anything but random. Likely, a combination of more hawkish Federal Reserve policy expectations and rising recession concerns have been weighing on energy prices.
The closely watched spread between 10-year and 2-year Treasury yields continues to invert, which is often seen as a leading recession indicator. Overnight, China announced an easing of Covid-19 restrictions. That could bode well for oil. However, markets were hardly impressed as the outcome seemed to be largely priced in.
How is This Week Shaping up for Crude Oil?
Crude Oil Technical Analysis – Daily Chart
WTI crude oil prices continue to extend losses since resuming the downtrend back in November. Prices appear to be trading within a Falling Wedge chart pattern. A breakout higher could open the door to a near-term reversal towards the November peak. Keep a close eye on the 100-day Simple Moving Average though. The latter may reinstate the downside focus. Breaking under the 100% Fibonacci extension level at 72.249 exposes May 2021 lows from 61.69 – 65.60.
Trade Smarter – Sign up for the DailyFX Newsletter
Receive timely and compelling market commentary from the DailyFX team
Subscribe to Newsletter
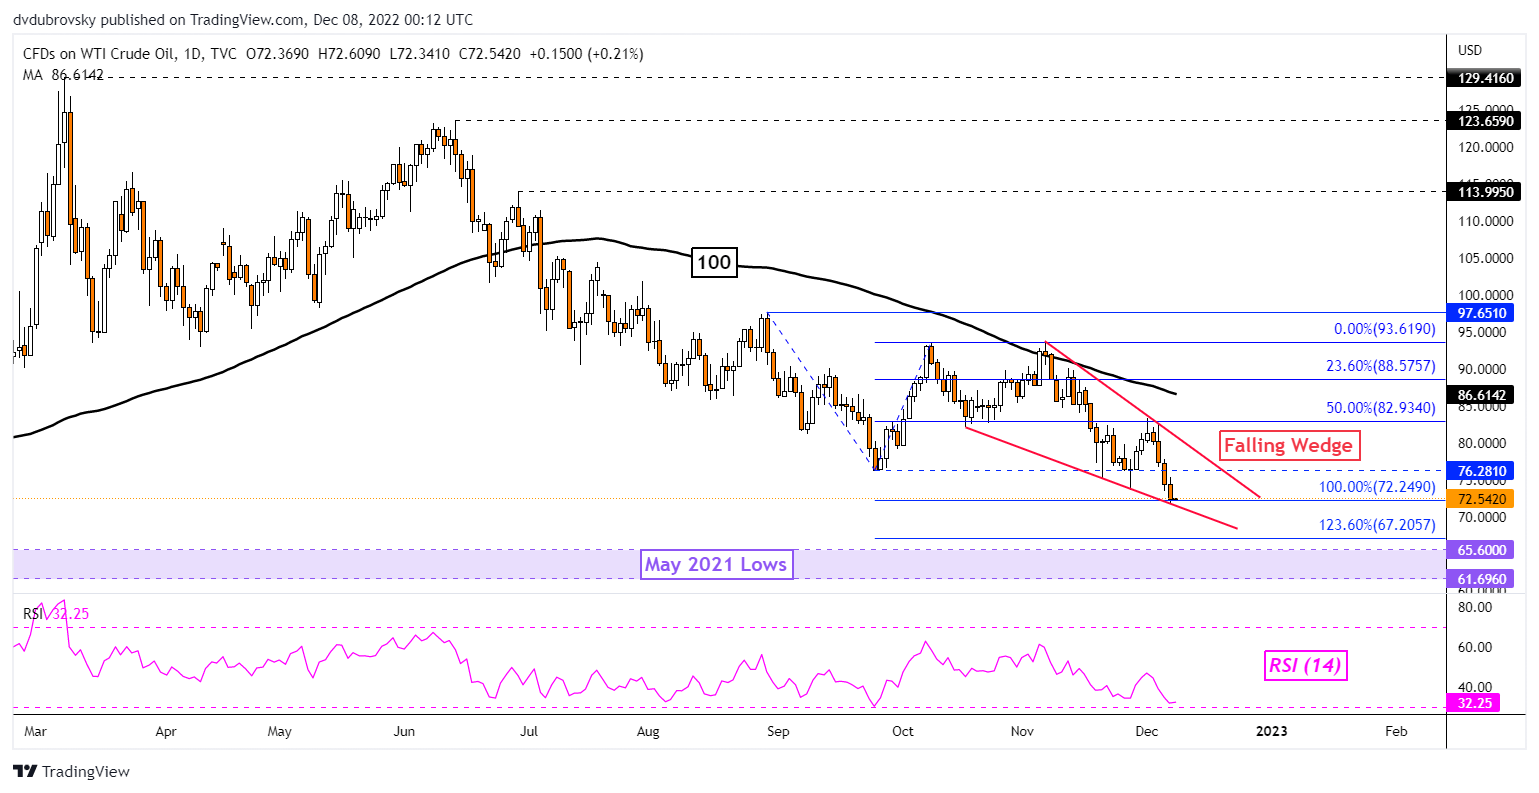
Chart Created Using TradingView
— Written by Daniel Dubrovsky, Senior Strategist for DailyFX.com
To contact Daniel, follow him on Twitter:@ddubrovskyFX
Be the first to comment