

WTI PRICE, CHARTS and ANALYSIS:
Recommended by Zain Vawda
Get Your Free Oil Forecast
WTI FUNDAMENTAL OUTLOOK
Crude Oil continued its rise in early European trade today after hitting $78.50 a barrel yesterday, a fresh weekly high. The recovery has been swift following a bounce off support at the January low, printing a double bottom pattern.
On Wednesday the US Energy and Information Administration (EIA) announced that weekly crude oil inventory levels have reached their highest since June 2021, while production has reached a high last seen in April 2020. The EIA report indicated 2.42 million barrels in inventories for the week ended February 3, which failed to arrest the upside rally.
Optimism around a demand surge from China received a boost yesterday as Fitch Ratings upgraded its economic growth forecast to 5% in 2023, from a previous figure of 4.1%. Fitch cited the services PMI data for January as well as real GDP for Q4 2022 among other key data points as the reason for the upgrade. However, these are forecasts at the end of the day, we still need to see an actual increase in demand materialize out of China as the property sector remains a stumbling block.
Trade Smarter – Sign up for the DailyFX Newsletter
Receive timely and compelling market commentary from the DailyFX team
Subscribe to Newsletter
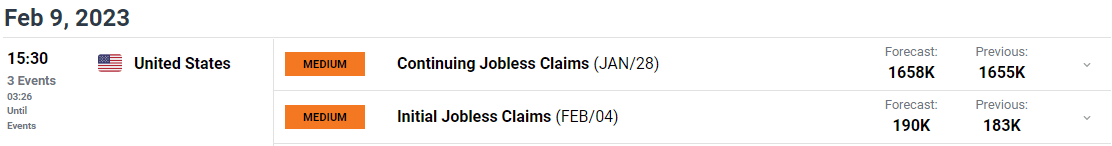
We have had a quiet week on the calendar front thus far with Federal Reserve policymakers driving market sentiment. Later today we do have continuing jobless claims data out of the US which could prop up the US dollar once more and see WTI fall.
For all market-moving economic releases and events, see the DailyFX Calendar
TECHNICAL OUTLOOK
From a technical perspective, WTI has put in a significant rally since printing a double bottom pattern and finding support of the January swing low. It has broken back above the 50-day MA which could now serve as dynamic support as the 100-day MA moving average comes into focus.
Given the speed at which we have pushed higher off support there is a possibility of retracement before we do head higher. Fundamentals are lining up for a push higher, however the recent choppy price action across markets and constant change in sentiment have seen many instruments fail to follow through with any conviction. The question is will WTI follow in a similar vein…? Time will tell.
WTI Crude Oil Daily Chart – February 9, 2023
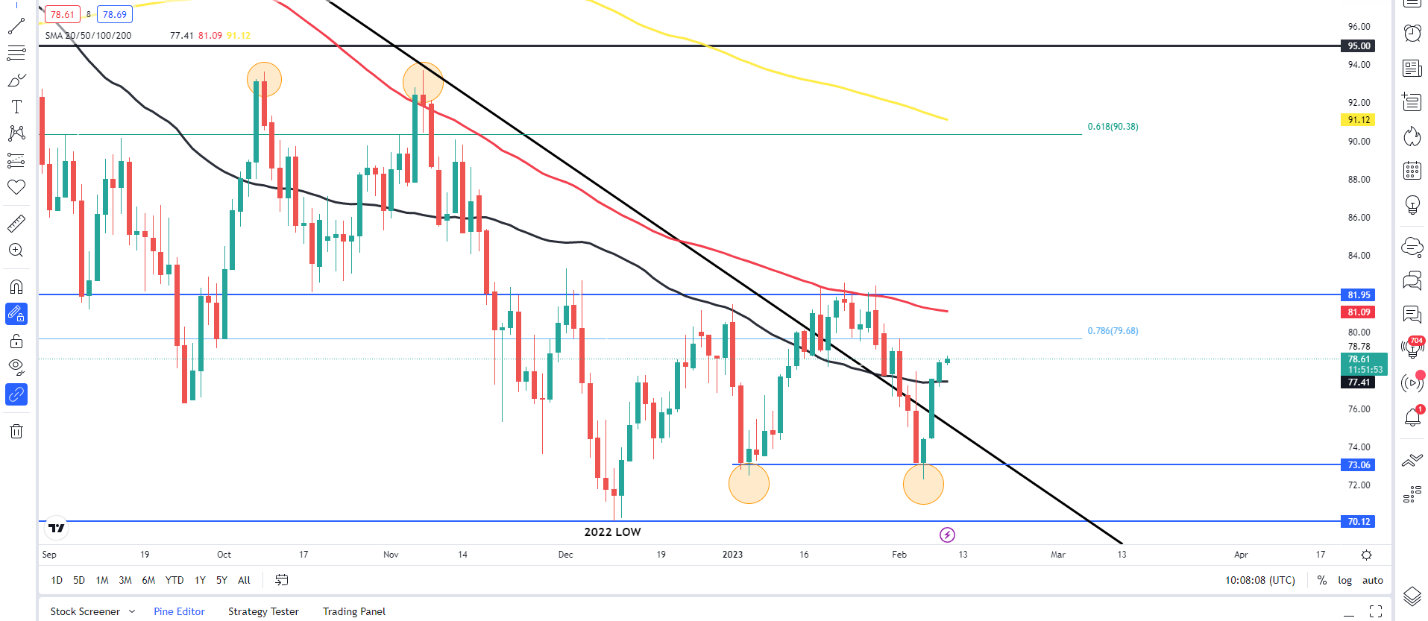
Source: TradingView
IG CLIENT SENTIMENT DATA: BULLISH
IGCS shows retail traders are currently Long on Crude Oil, with 69% of traders currently holding long positions. At DailyFX we typically take a contrarian view to crowd sentiment, and the fact that traders are long suggests that Crude Oil may continue to fall.
Written by: Zain Vawda, Market Writer for DailyFX.com
Contact and follow Zain on Twitter: @zvawda
Be the first to comment