

Ed Lallo/iStock via Getty Images
Introduction
Houston-based W&T Offshore, Inc. (NYSE:WTI) released its third quarter 2022 earnings report on November 8, 2022.
Note: I have been covering W&T Offshore regularly quarterly since May 2016. This article is an update of my preceding article, published on August 11, 2022.
The company specializes in oil production in the Gulf of Mexico, with production in the Gulf of Mexico Shelf (381K acres net) and the Gulf of Mexico Deepwater (72K acres net). 2P reserves Mix is 250.1 MMBoe. Below is the most recent presentation:
WTI Assets presentation (WTI Presentation 2Q22)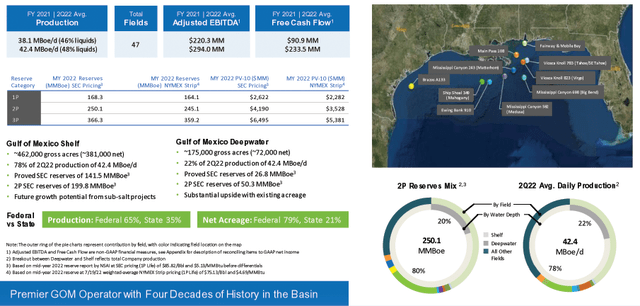
Note: W&T Offshore is currently in the permitting and FEED processes and buying long-term and long-lead items in preparation for the Holy Grail well (WI 100%) at Garden Banks 783 in the Magnolia Field in the second quarter of 2023. This, well, if successful, could bring a significant increase in production. The cost of this well is about $80 million.
1 – Third quarter of 2022 result snapshot
The Company came out with earnings of $66.72 million or $0.46 per diluted share, beating analysts’ expectations. It compares with a loss of $37.96 million or $0.27 per share a year ago. The adjusted earnings were $0.33 per share, well above the breakeven adjusted earnings in 3Q21.
Total revenues were $266.49 million from $133.95 million earned a year ago.
Tracy W. Krohn, Chairman and Chief Executive Officer, said in the conference call:
we maintained our strong financial results in the third quarter and 2022 is on track to be one of the best years in our long and profitable history. Our strategy has always been very simple, generate free cash flow; maintain high-quality conventional production and opportunistically capitalize on accretive opportunities to build shareholder value.
Oil equivalent production was 41.5K Boep/d in 3Q22 with 50% liquids. The average price per $/boe was $68.39, well above last year.
WTI Quarterly oil equivalent production 3Q21 versus 3Q22 (Fun Trading)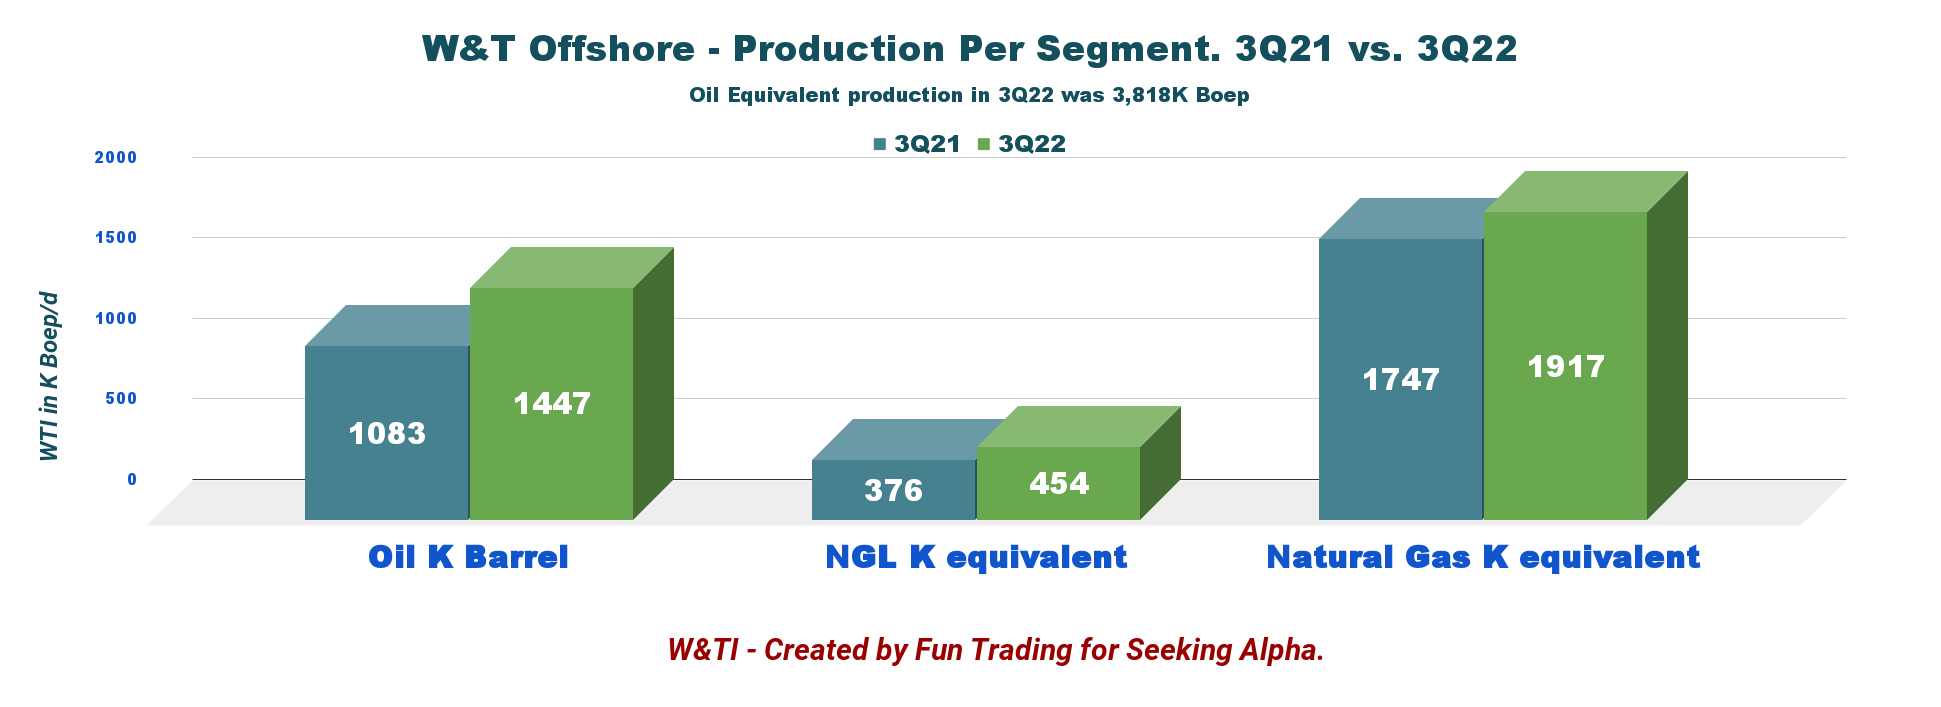
W&T Offshore is a small E&P company that presents elevated volatility and is not really fit for a long-term investment. Looking at the stock performance, you can see wide fluctuations that favor trading compared to investing. This fundamental investing thesis will not change and is an intrinsic part of the company stock.
However, with the recent rally in oil and natural gas prices, the company managed to generate a significant amount of cash and cut its net debt to an attractive level. This overheated price environment has decreased significantly in the last few months and could drop lower depending on the world economy, which is struggling with a possible global recession in 2023.
It puts solid financial support that helps the long-term narrative. Unfortunately, this small E&P is not paying a dividend, and it is a big issue when it comes to “parking” your cash in a volatile environment like oil without any reward.
CEO Tracy Krohn said in the conference call:
Third quarter also marked the 19th consecutive quarter that we’ve generated that positive free cash flow. So our free cash flow in the first nine months of 2022 were $351.5 million, is more than double the free cash flow that we generated in all of 2020 and 2021 combined. So we’re clearly in a much stronger financial position today, and we remain focused on operational execution to build on these solid results.
Thus, I believe that the best trading/investing strategy is to trade short-term LIFO the volatility and keep a medium core long-term position for an eventual higher payday. This simple dual strategy is the most rewarding, in my opinion, and is what I suggest in my marketplace, “The Gold And Oil Corner.”
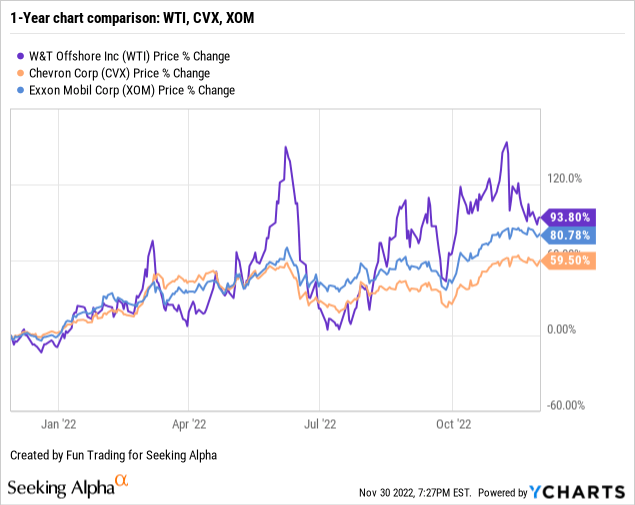
2 – Stock performance
WTI has outperformed Chevron Corporation (CVX) and Exxon Mobil (XOM) and is now up 94% on a one-year basis.
W&T Offshore, Inc. – Financial And Production 3Q22 – The Raw Numbers
| W&T Offshore, Inc. | 3Q21 | 4Q21 | 1Q22 | 2Q22 | 3Q22 |
| Total Revenues in $ Million | 133.95 | 165.59 | 191.00 | 273.81 | 266.49 |
| Net Income in $ Million | -37.96 | 48.90 | -2.46 | 123.44 | 66.72 |
| EBITDA $ Million | 1.34 | 108.84 | 47.65 | 207.07 | 134.08 |
| EPS diluted in $/share | -0.27 | 0.34 | -0.02 | 0.85 | 0.46 |
| Cash from operations in $ Million | 65.10 | 22.38 | 27.54 | 210.22 | 89.09 |
| Capital Expenditure in $ Million | 10.17 | 16.70 | 47.59 | 25.52 | 8.33 |
| Free Cash Flow in $ Million | 54.93 | 5.68 | -20.06 | 184.70 | 80.77 |
| Total Cash in $ Million | 257.58 | 245.80 | 215.48 | 377.72 | 447.13 |
| Total LT Debt in $ Million | 742.37 | 730.90 | 720.32 | 709.17 | 701.42 |
| Shares outstanding (diluted) in Million | 142.30 | 142.39 | 142.94 | 144.53 | 145.88 |
| Oil Production | 3Q21 | 4Q21 | 1Q22 | 2Q22 | 3Q22 |
| Oil Equivalent Production in K Boepd | 34.8 | 37.2 | 37.8 | 42.4 | 41.5 |
| Realized price ($/Boe) | 41.05 | 47.70 | 55.29 | 69.55 | 68.39 |
Source: Company 10-Q
Analysis: Revenues, Earnings Details, Net Debt, Free Cash Flow, And Oil-Equivalent Production
1 – Total Revenues of $266.49 million in 3Q22
WTI Quarterly Revenues history (Fun Trading)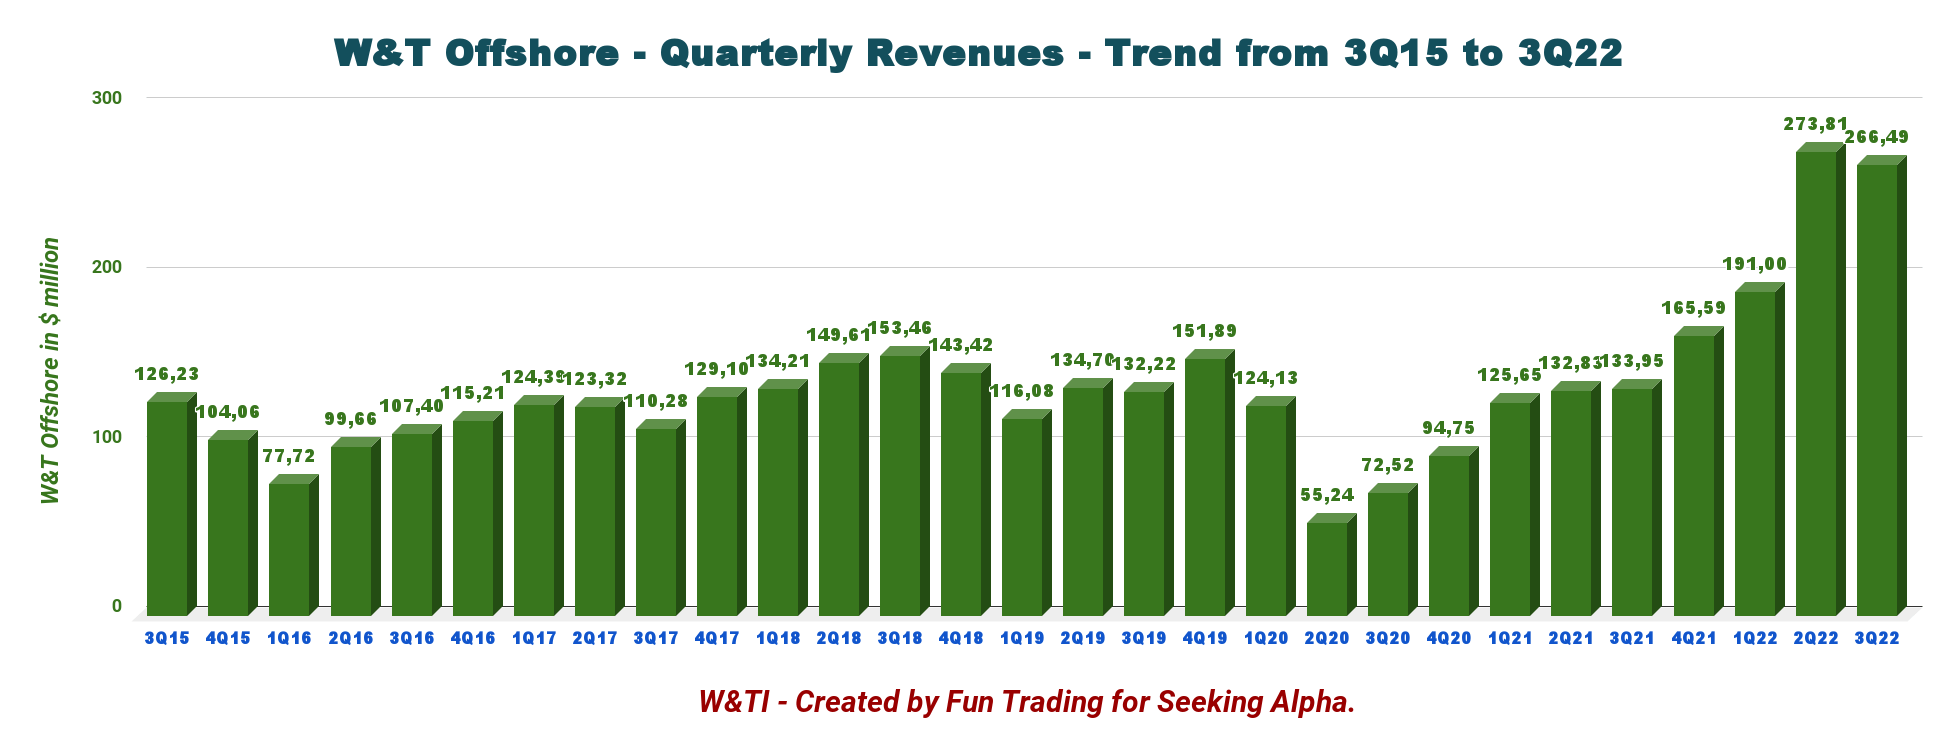
The adjusted EBITDA was $113.9 million, and the adjusted Net Income totaled $48.7 million, or $0.33 per diluted share in the third quarter of 2022, primarily reflecting the adjustment for unrealized derivative gain and derivative premiums.
2 – The free cash flow was $80.77 million in 3Q22
WTI Free cash flow history (Fun Trading)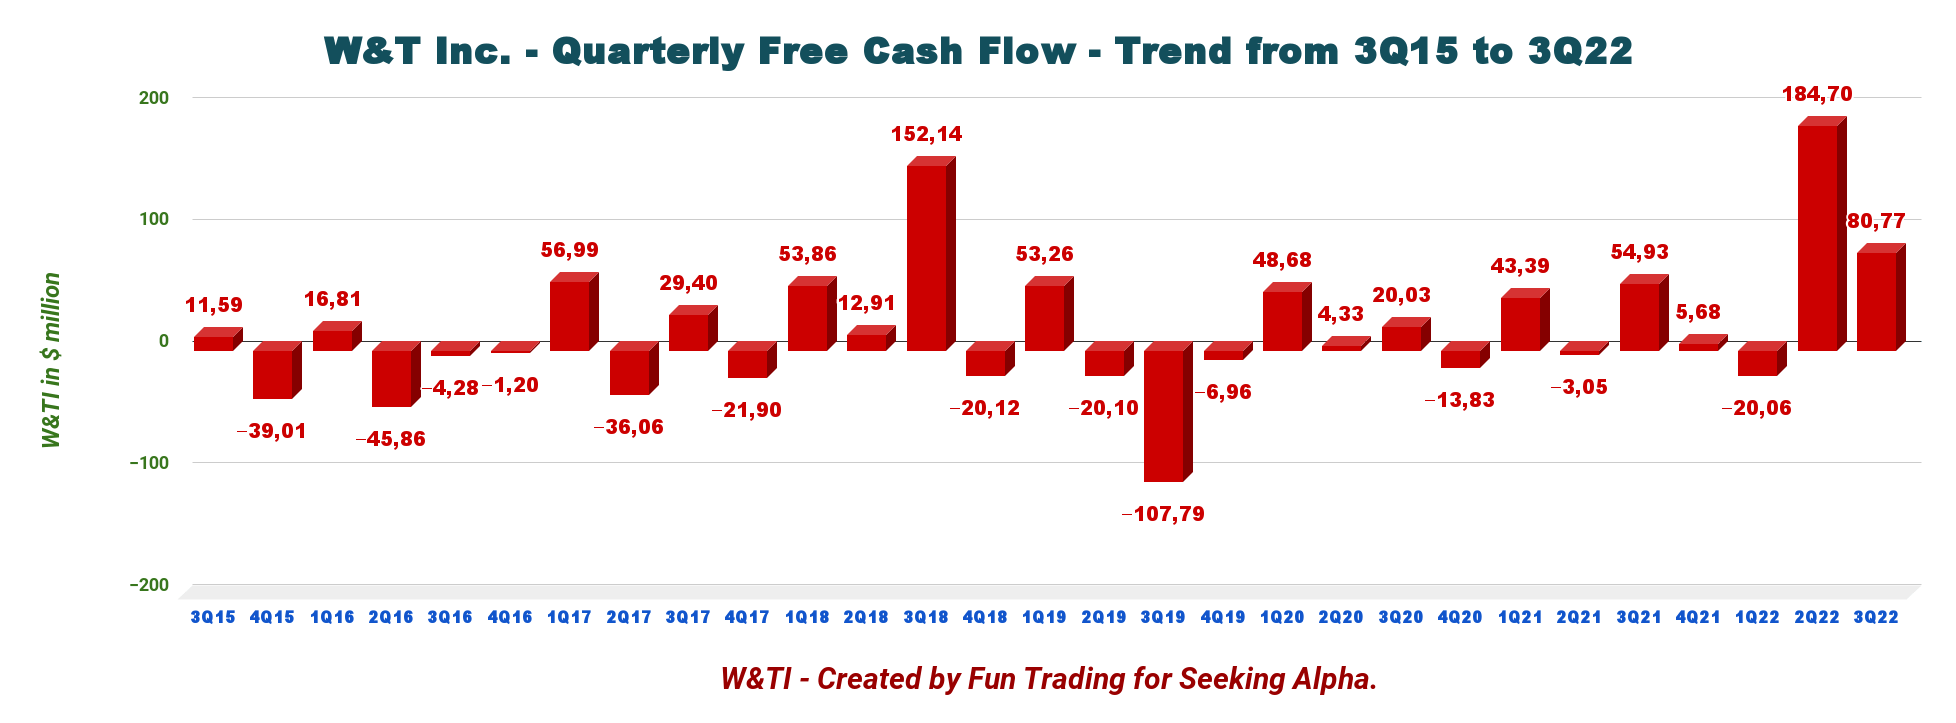
W&T Offshore’s trailing 12-month free cash flow was $251.09 million, with $80.77 million for 3Q22.
However, the oil prices dropped significantly in 4Q22, and free cash flow will struggle to stay above zero.
3 – Oil equivalent production and other considerations
WTI quarterly Oil equivalent production history (Fun Trading)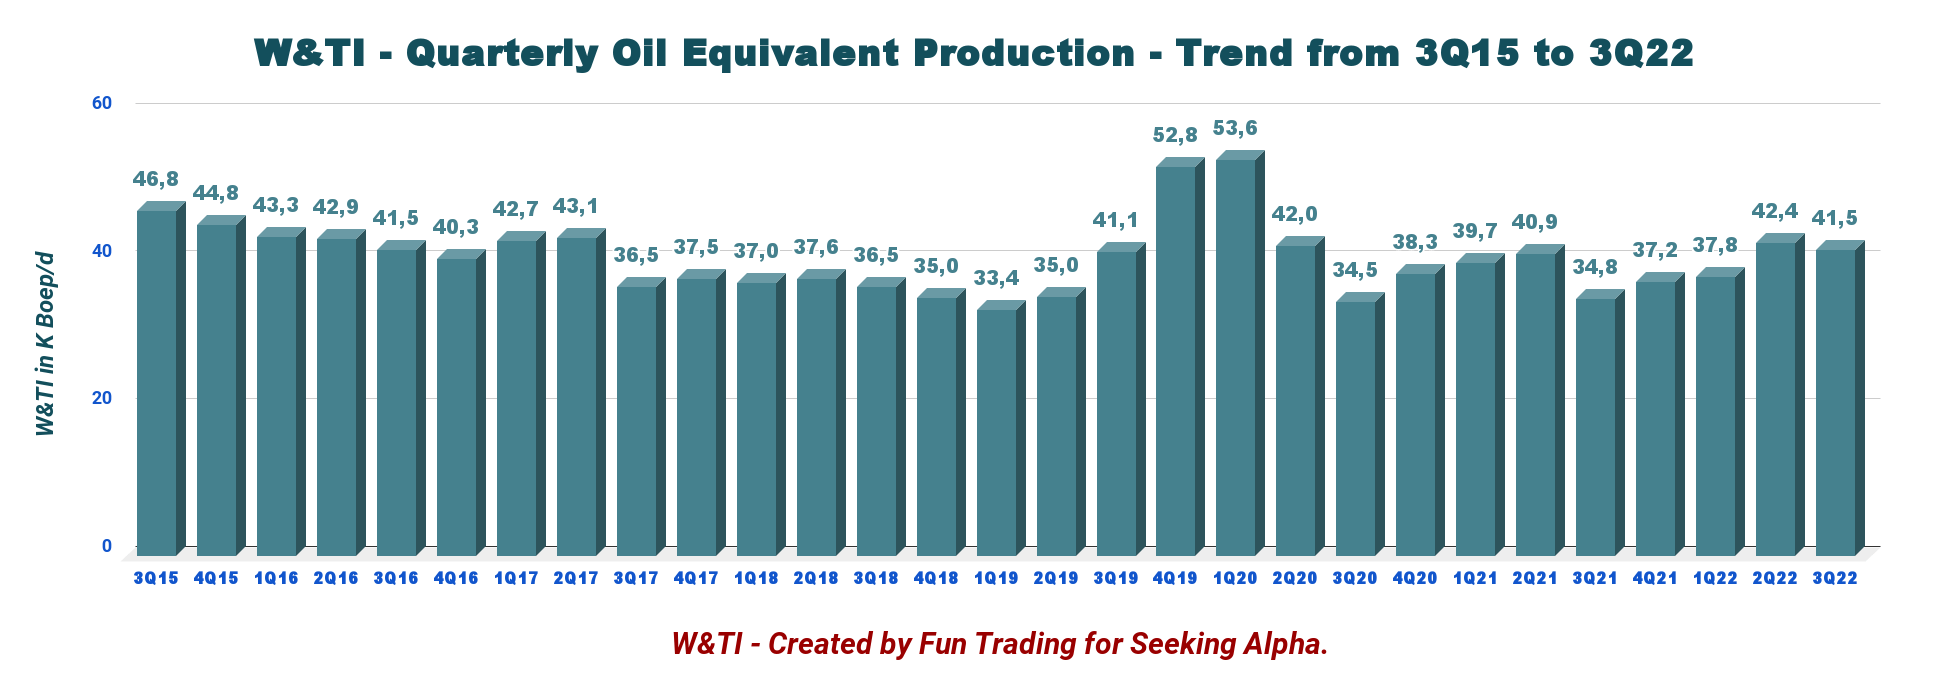
3.1 – Oil equivalent production
Production for the third quarter of 2022 was 41.5k Boep/d, which was at the midpoint of the guidance range provided for the quarter. It represented a decrease of 2.1% compared to 2Q22 and was up 19.3% from 34.8K Boep/d for the corresponding period in 2021.
3.2 – Details revenues QoQ:
WTI Production comparison 2Q22 versus 3Q22 (Fun Trading)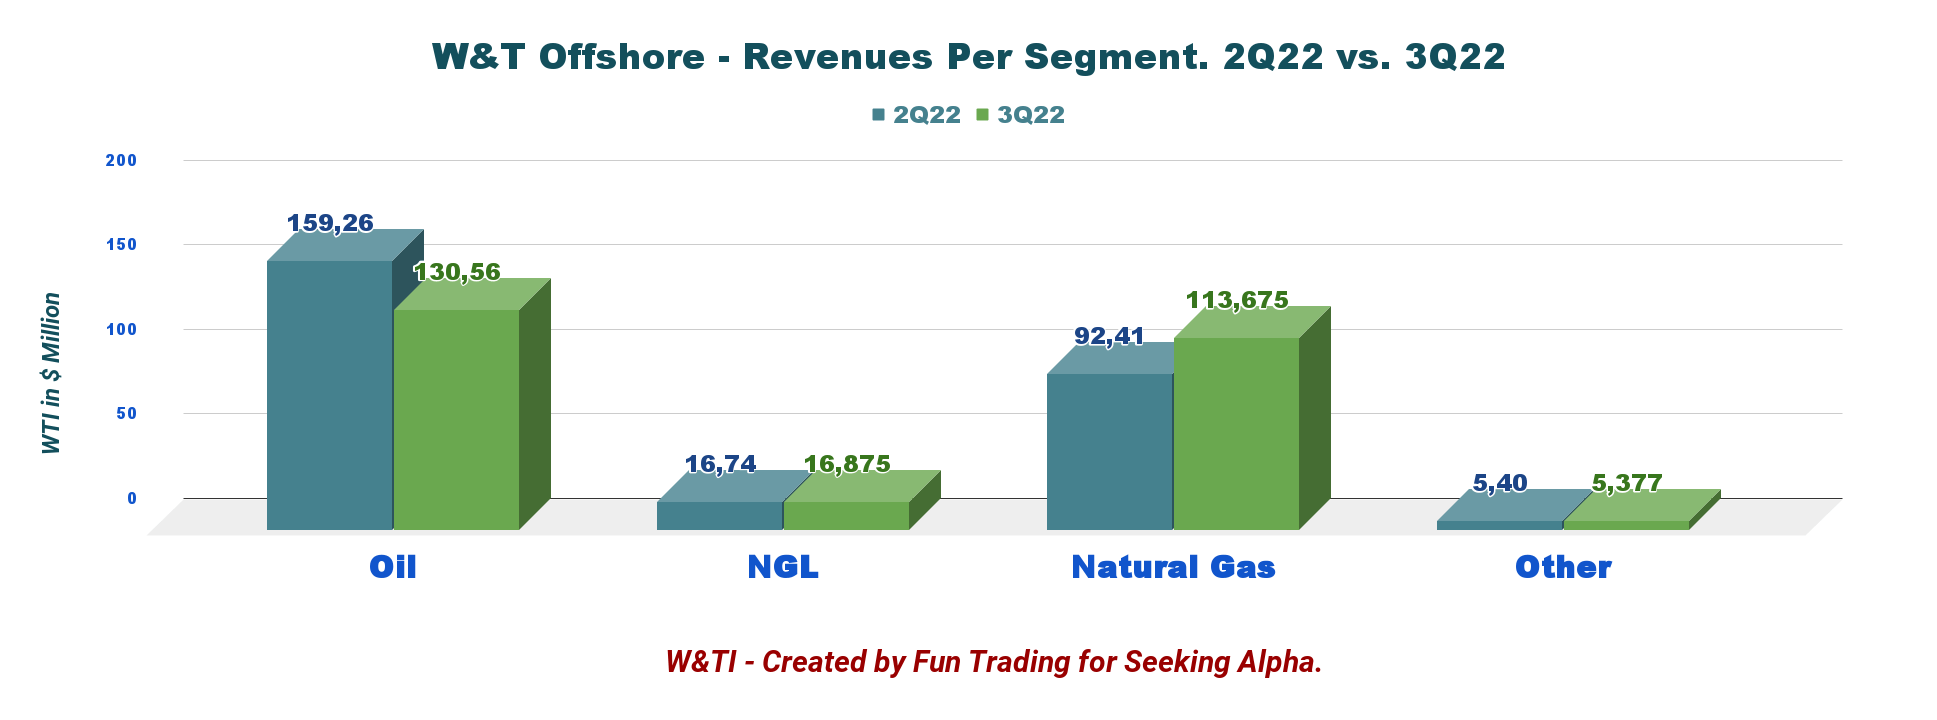
W&T’s average realized price per barrel of oil equivalent (“Boe”) before realized derivative settlements was a record of $68.39 per Boe in the third quarter of 2022, a decrease of 1.7% from $69.55 per Boe in the second quarter of 2022 and up significantly from $41.05 per Boe in the third quarter of 2021.
Before realized derivative settlements, crude oil, NGL, and natural gas prices for the third quarter of 2022 were $90.23 per Oil barrel, $37.17 per NGL barrel, and $9.89 per Mcf (up from $4.31), respectively.
Liquids (oil and NGL) represented 50% of the total production in the quarter.
WTI quarterly oil Production and price per Boe history (Fun Trading)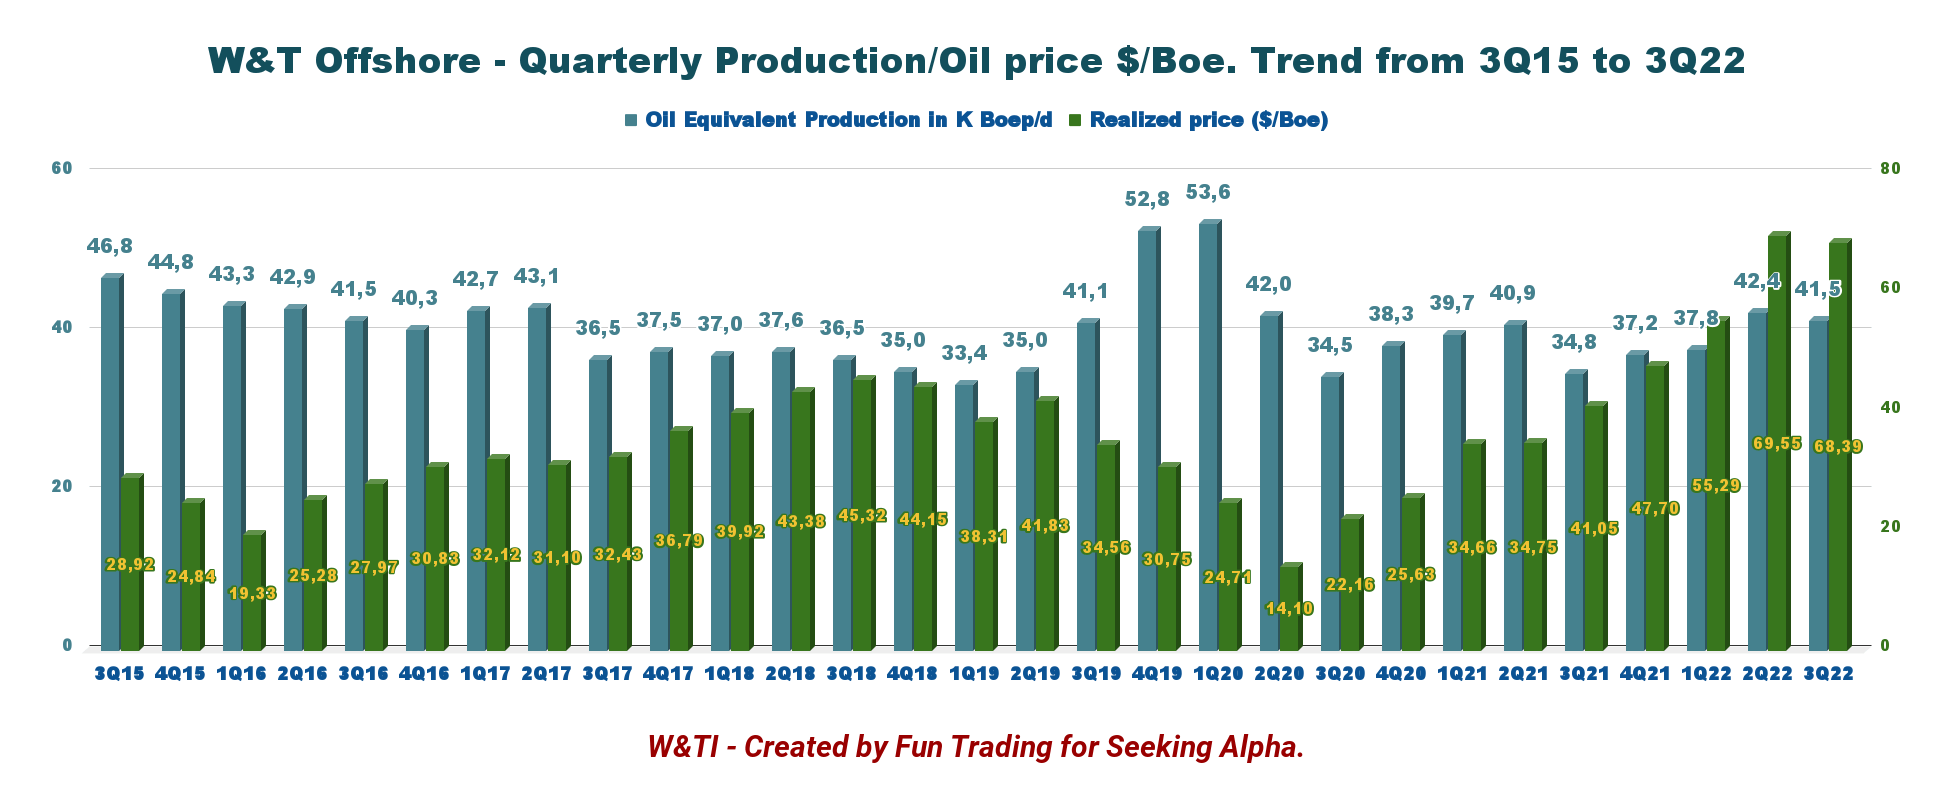
4 – Net debt is significantly down this quarter and is $254.3 million in 3Q22
WTI Quarterly Cash versus Debt history (Fun Trading)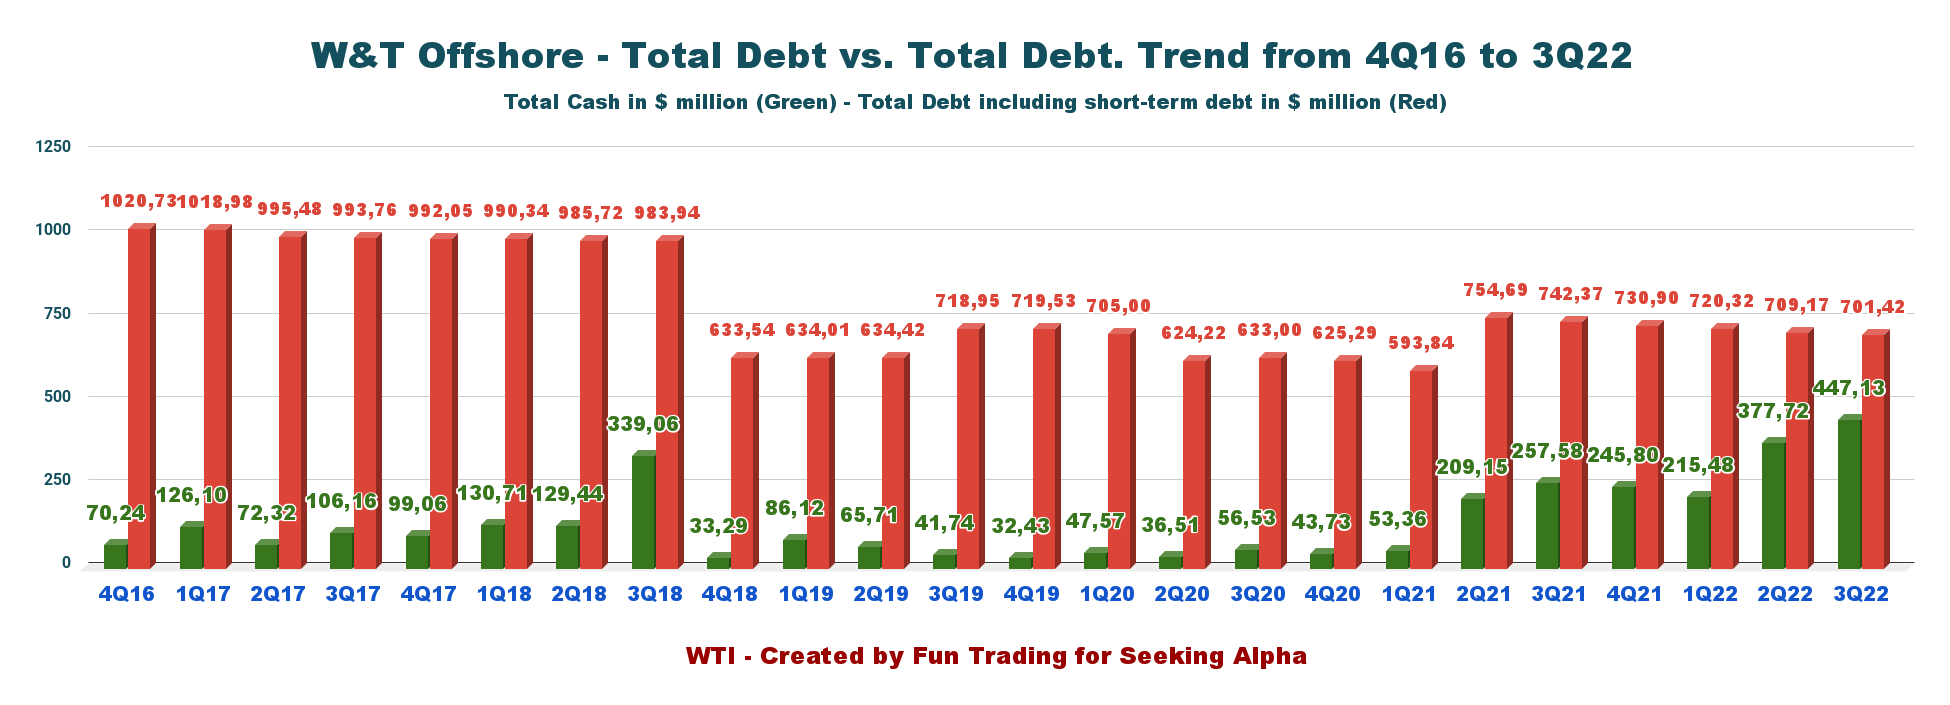
W&T had available liquidity of $497.13 million, comprised of $447.13 million in cash and cash equivalents and $50.0 million of borrowing availability under W&T’s first priority secured revolving facility provided by Calculus Lending LLC (“Calculus”).
The total debt consists of the non-recourse Mobile Bay term loan balance of $152.0 million and $549.5 million of 9.75% Senior Second Lien Notes, net of unamortized debt issuance costs for both instruments.
5 – Mid-year 2021 Proved Reserves, 2022 guidance, and acquisition
5.1 – Total 2021 Proved, Probable and Possible reserves (3P) jumped to 341.5 MMBoe with 47.3% liquids (unchanged this quarter).
The Company’s year-end 2021 SEC proved reserves were 157.6 MMBoe (excluding ARO), up 9% from 144.4 MMBoe at the year-end of 2020. However, the company increased the 1P reserve to 168.3 MMBoe mid-year or 2P to 250.1 MMBoe.
WTI Reserve 2021 (WTI Presentation)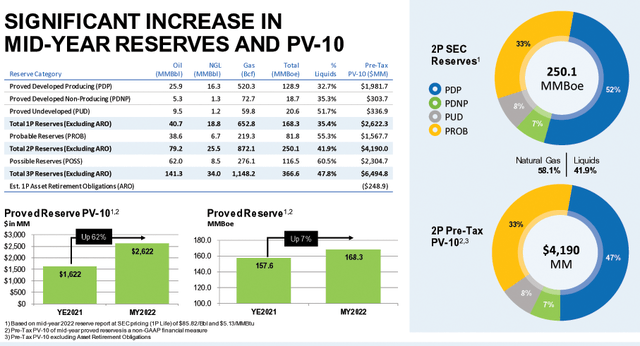
5.2 – 2022 guidance reduced by 1.5 K Boep/d in 4Q22.
Fourth quarter production guidance was reduced by 1.5 MBoe/d at the midpoint, primarily due to unplanned downtime at the outside-operated Neptune field and temporary maintenance downtime at the Mobile Bay field.
Production for 4Q22 is expected to be 38k to 42k Boep/d.
W&T Offshore reiterated its CapEx for 2022 at $70-$90 million, excluding acquisition opportunities.
Third quarter lease operating expense is expected to be between $62 million and $73 million, while cash G&A costs are expected to be between $17 million and $19 million.
For 2022, W&T Offshore reduced its capital spending budget to $65-$75 million from the prior stated $70-$90 million.
CEO Tracy Krohn said in the conference call:
We’re anticipating timing deferrals related to capital spending and now expect drilling in early 2023 that was originally expected in late 2022. As a result, we’re reducing our CapEx range for 2022 by $10 million at the midpoint to between $65 million and $75 million.
WTI 2022 guidance Press release (W&T offshore )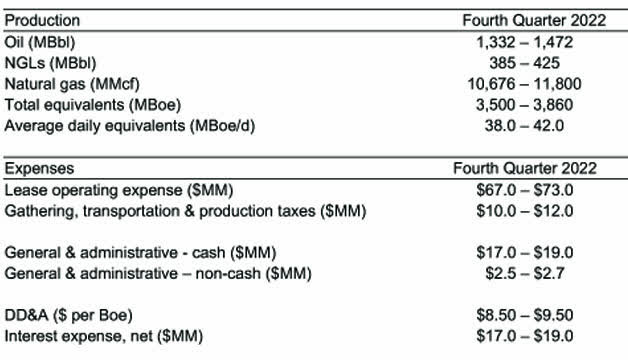
Technical Analysis And Commentary
WTI TA Chart short-term (Fun Trading StockCharts)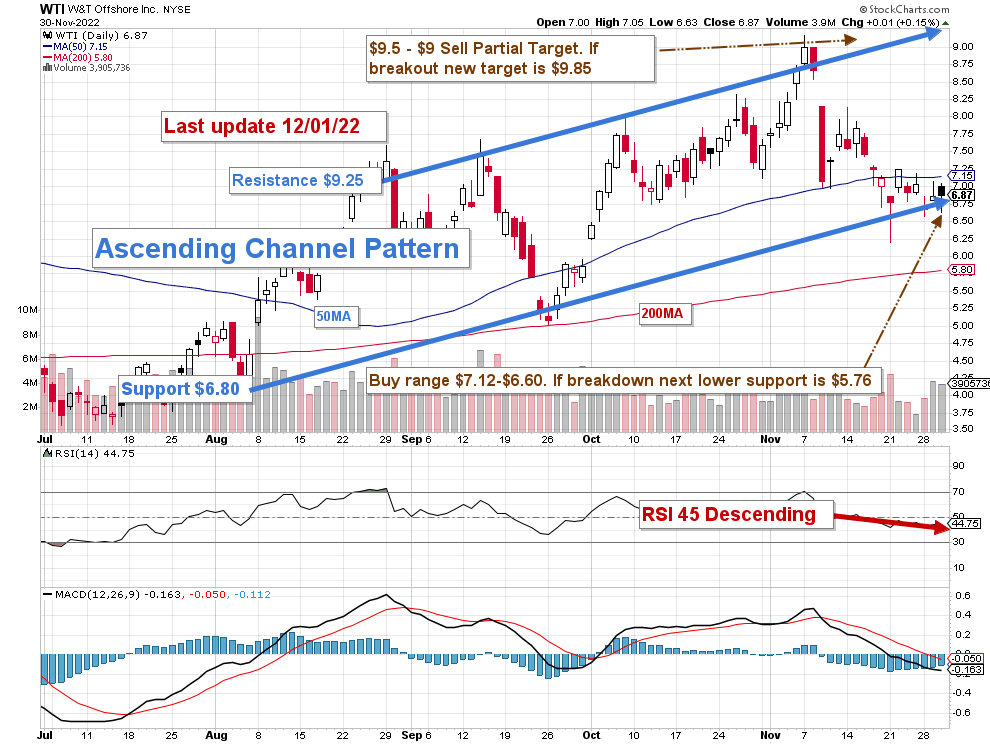
WTI forms an ascending channel pattern with resistance at $9.25 and support at $6.80. Ascending channel patterns are short-term bullish moving higher within an ascending channel, but these patterns often form within longer-term downtrends as continuation patterns.
The short-term trading strategy is to trade LIFO about 55%-65% of your position and keep your core long-term amount for a potentially higher payday.
I suggest selling gradually between $6.21 (mid-point) and $9.25 and waiting for a retracement between $7.15 and $6.80 with possible lower support at $5.80.
Since June, oil prices have retraced significantly, and West Texas trades now at $80.5.
WTI Price Brent and NG 1 year. (Fun Trading StockCharts) Thus, if oil prices turn even more bearish, WTI could quickly drop to the lower support I see below $6 and may even test lower support at $4.50, depending on the severity of the oil pullback. Conversely, if oil prices turn bullish again, WTI could retest resistance above $9.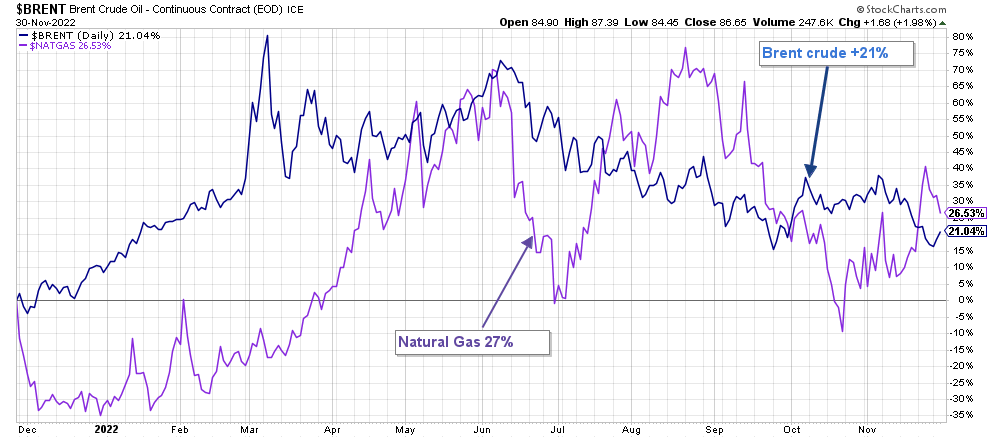
Watch oil prices like a hawk.
Warning: The TA chart must be updated frequently to be relevant. It is what I am doing in my stock tracker. The chart above has a possible validity of about a week. Remember, the TA chart is a tool only to help you adopt the right strategy. It is not a way to foresee the future. No one and nothing can.
Author’s note: If you find value in this article and would like to encourage such continued efforts, please click the “Like” button below as a vote of support. Thanks.
Be the first to comment