

DNY59/E+ via Getty Images
Article Purpose
Low volatility ETFs have a reputation for outperforming in market drawdowns but underperforming in bull markets. The net effect isn’t always in your favor, but proponents of the strategy claim the downside protection is worth it. Plus, basic math tells us that if you have a tighter range of returns, you can still come out ahead even if your average annual return is less than the market. That’s why, in the face of a possible recession, the category is worth exploring.
There are 28 low volatility U.S. Equity ETFs in my database, but only a handful are worth owning. The reason is that many are set up to only do well in a downturn, leaving you stranded should your market outlook turn out to be incorrect. This article will highlight three low-fee, high-quality options you may have overlooked and provide historical performance data on all 28 low volatility ETFs to help you make easy comparisons. I hope you’ll enjoy it.
Strategy Overview
Many ETFs aim to reduce volatility. One common way is by writing covered calls, offering investors a higher yield and downside protection but significantly limiting upside potential. I won’t discuss those today but will instead focus on funds that invest nearly 100% in equities most of the time.
As mentioned before, the objective is to limit the range of annual returns. The graphic below shows how the least volatile one will always produce the better annualized return as long as two portfolios have the same average annual return. I made these numbers up, but you can do as many simulations as possible and still come to the same conclusion.
The Sunday Investor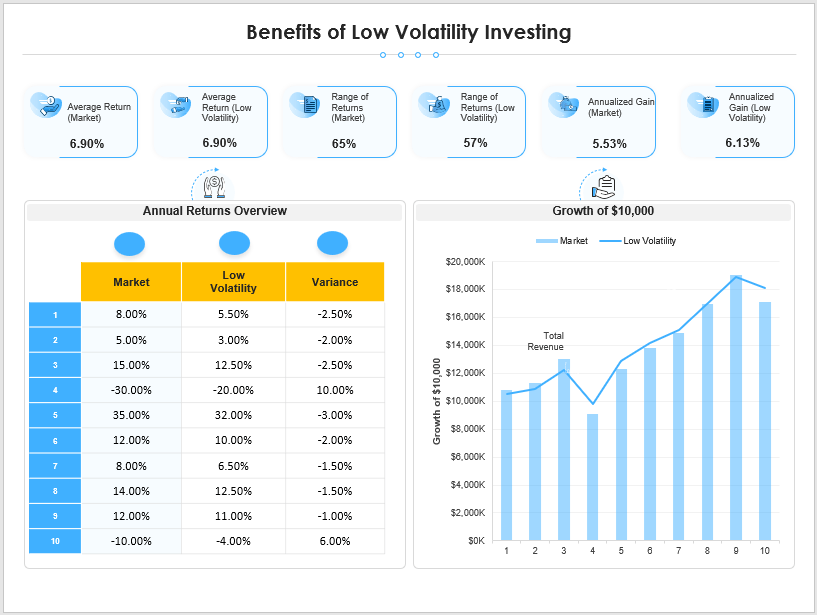
Low Volatility ETF Historical Performances
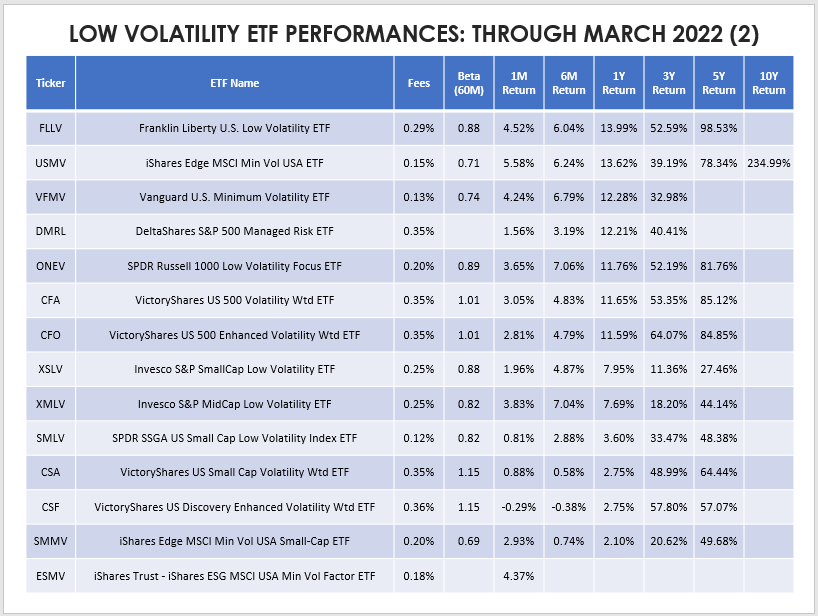
There are 28 low-volatility ETFs in my database. The table below highlights the median periodic returns compared with the 39 other categories I created. The sample size is large (838 ETFs), so I think it provides a reasonably accurate picture of how each category performed over time. For simplicity, I’ve sorted the results from best-to-worst performances in the last year from April 2021 to March 2022.
The Sunday Investor The Sunday Investor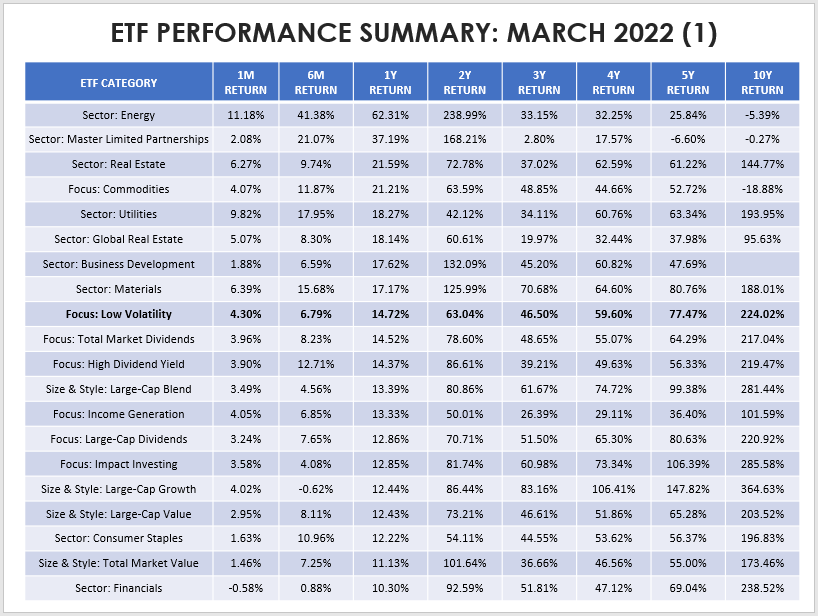
Low volatility ETFs had a one-year median return of 14.72%, which is a terrific result for diversified (i.e., non-sector) funds. However, over the last ten years, the median 224.02% return lags large-cap blend ETFs by 57%; against large-cap growth ETFs, the difference is an astounding 141%. That’s what happens in growth-favored bull markets, but as they say, past performance is not a guarantee of future returns. I think it’s time to accept the reality that the likelihood of the last decade repeating itself is very low.
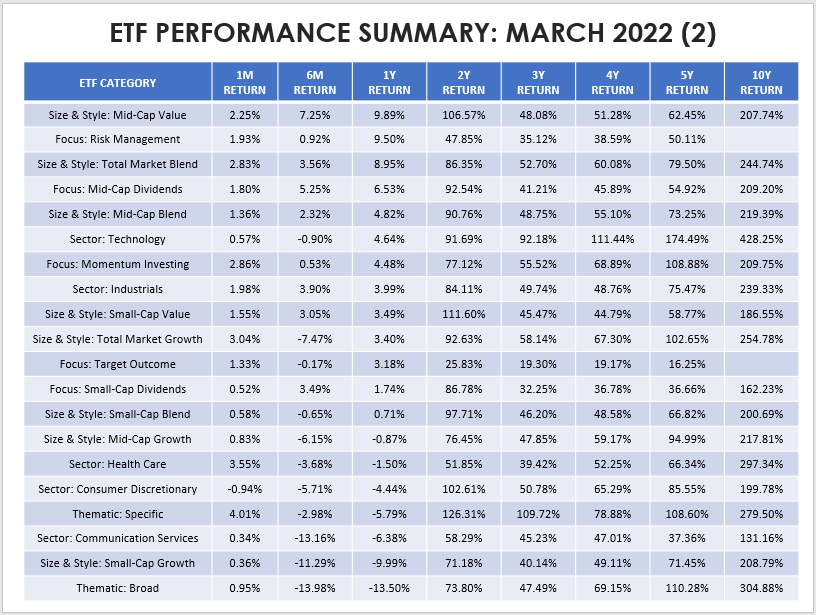
The tables below highlight the periodic returns for the 28 low volatility ETFs I track. The bolded ones are the subject of today’s article, and I’ll explain why with an analysis of each ETF’s fundamentals.
The Sunday Investor The Sunday Investor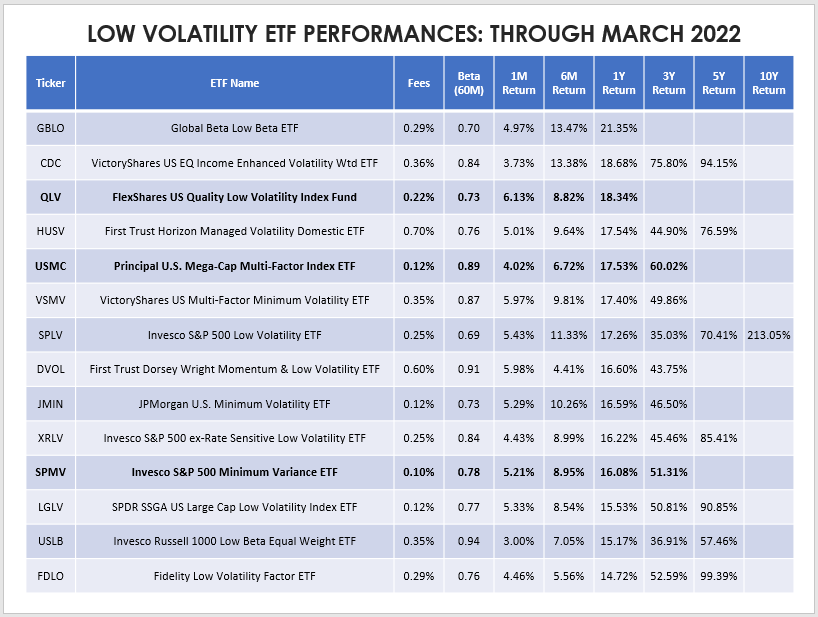
The three ETFs I selected are as follows:
- FlexShares US Quality Low Volatility Index Fund (NYSEARCA:QLV)
- Principal U.S. Mega-Cap Multi-Factor Index ETF (NASDAQ:USMC)
- Invesco S&P 500 Minimum Variance ETF (BATS:SPMV)
These ETFs have several things in common, including a relatively short history, low expense ratio, and a current portfolio that’s of reasonably good quality. There are other high-quality ETFs, like the VictoryShares US EQ Income Enhanced Volatility Weighted ETF (CDC). However, I’ve reviewed that before, and this article aims to explore the alternatives. So, let’s begin.
FlexShares US Quality Low Volatility Index Fund
QLV’s strategy is somewhat complex, but I appreciate the approach as someone who developed low volatility equity portfolios in the past. The managers appear to be proponents of Modern Portfolio Theory (“MPT”) since they seek to optimize a portfolio’s weights after selecting constituents based on management efficiency, profitability, and cash flow. Security constraints are shown below, and the entire Index strategy is here.
FlexShares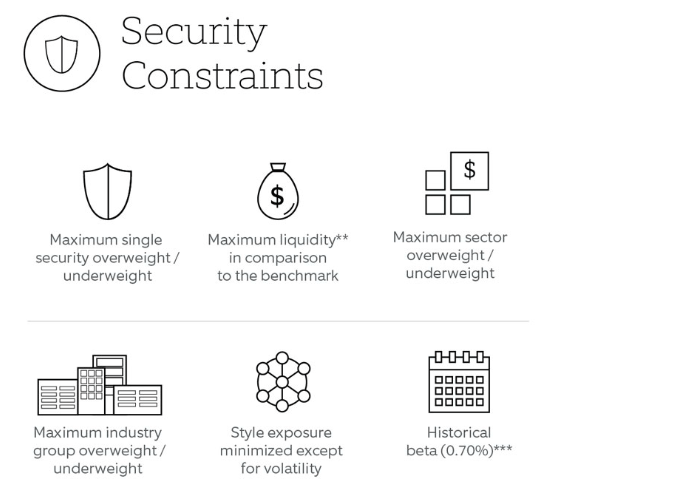
Unlike other strategies that select the least volatile securities over a certain period, optimizing is done in recognition that a portfolio’s volatility is not the same as the weighted-average volatility of its constituents. Efficiencies exist, specifically by selecting securities that have low correlations with each other. I liken it to a manager assembling a baseball team. It’s not as simple as picking the best players; they have to get along, too, and that’s what MPT is all about.
QLV rebalances quarterly and has a quality tilt. Another great feature of QLV is that the Index has a target turnover rate of just 12%. Excessive turnover, especially for value stocks (which often are low volatility), can be disastrous if the timing is wrong. Value investing requires patience, and I’m glad the Index provider explicitly states that.
Performance-wise, QLV has been excellent. The graph below shows performance since its inception against the two largest ETFs in the category by AUM: the iShares Edge MSCI Minimum Volatility ETF (USMV) and the Invesco S&P 500 Low Volatility ETF (SPLV).
Portfolio Visualizer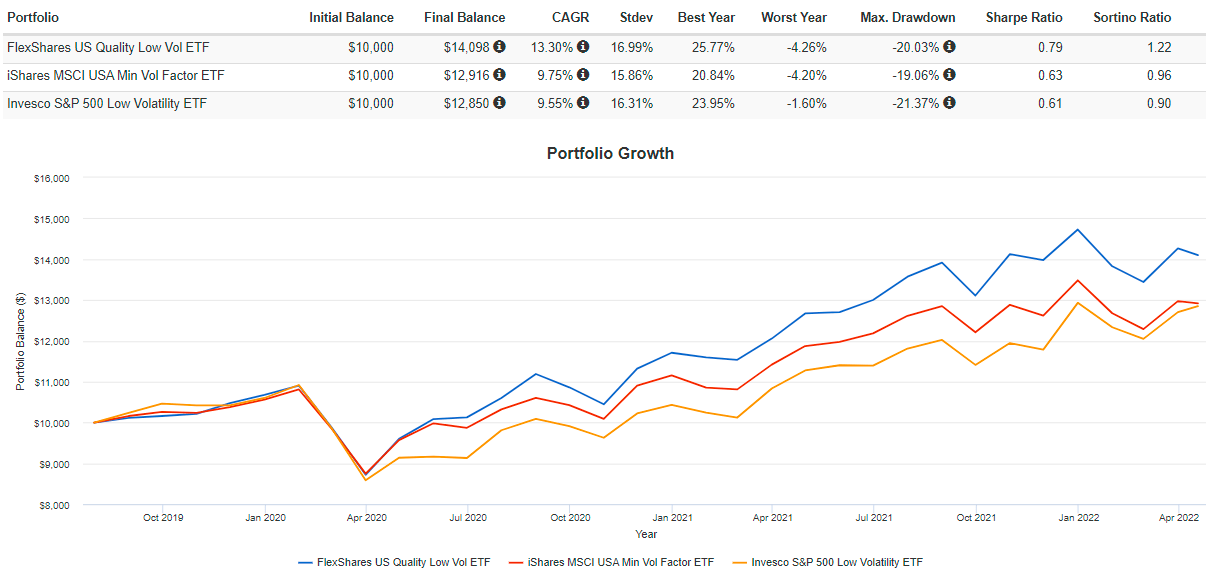
QLV has gained an annualized 13.30% compared to 9.75% and 9.55% for USMV and SPLV. It’s been slightly more volatile, but not by much. As a result, QLV’s risk-adjusted returns (Sharpe and Sortino Ratio) were superior.
The following table highlights selected fundamental metrics for QLV’s top 20 industries. I’ll do this for each ETF and then provide a summary at the end, so you don’t have to scroll back and forth.
The Sunday Investor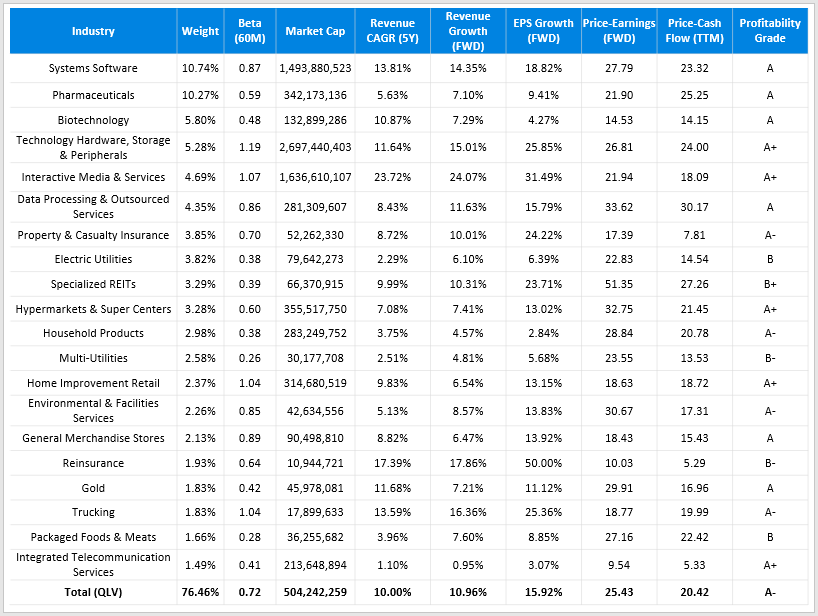
As shown, QLV’s five-year beta is currently 0.72, and nearly all industries have betas of less than one. There are some exceptions, specifically in the technology sector, but that’s expected. QLV has a large-cap bias with a weighted-average market capitalization of over $500 billion and double-digit revenue and EPS growth rates. The forward P/E of 25.43 is about the same as SPY, so I don’t think there’s any valuation edge here. Instead, I believe QLV will perform well if the bull market resumes but has the opportunity for substantial outperformance in a drawdown – exactly how low volatility ETFs should operate.
Principal U.S. Mega-Cap Multi-Factor Index ETF
Think bigger is better? USMC follows a quantitative-based strategy that selects large-cap stocks with the highest market capitalizations, giving higher weights to less volatile securities. The Index methodology, as described on its fund page, is below.
Principal ETFs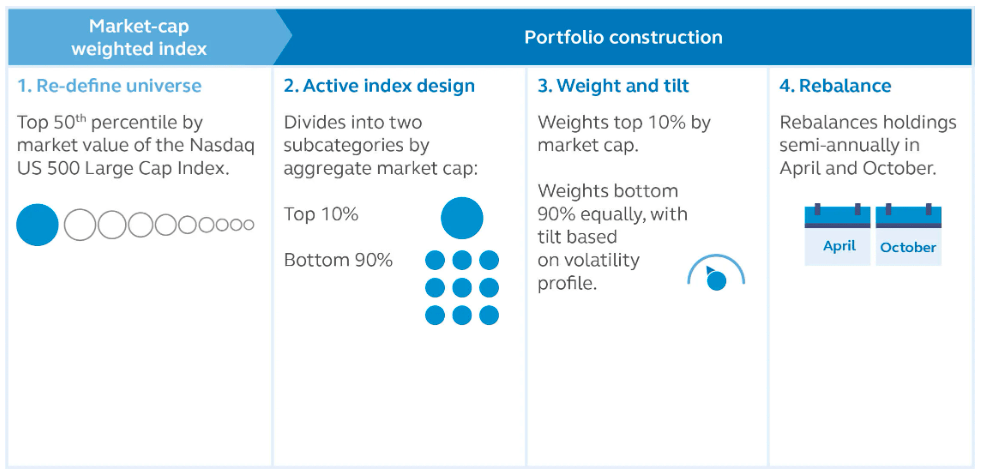
USMC’s benchmark Index, the Nasdaq US Mega Cap Select Leaders Index, only has 47 holdings, so it’s a reasonably concentrated play. Let’s see how it’s done against USMV and SPLV since its October 2017 launch.
Portfolio Visualizer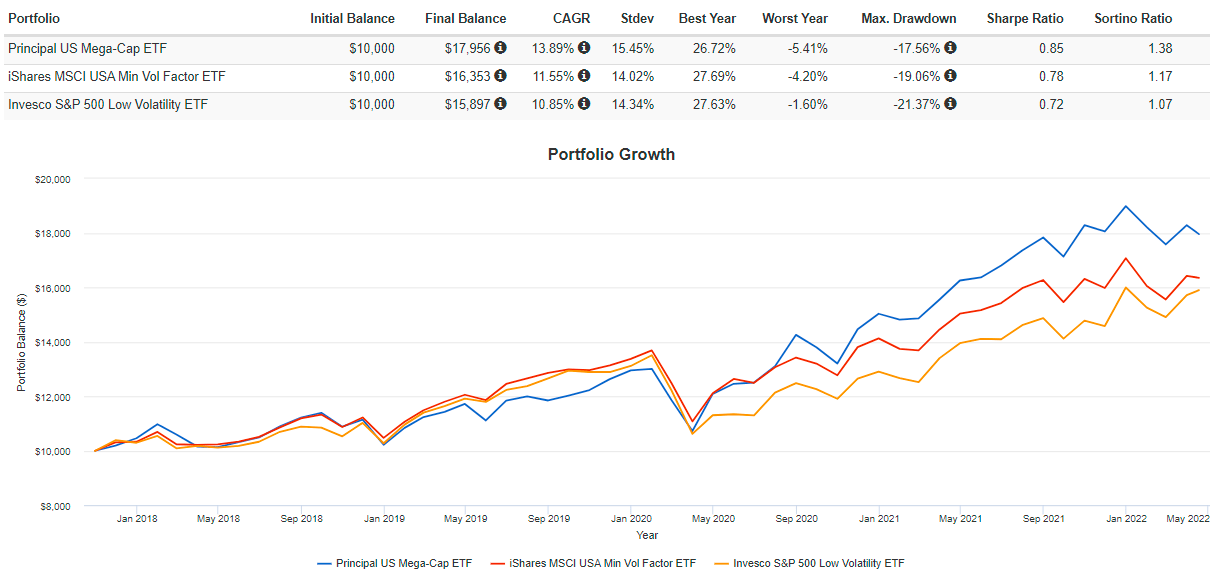
Like QLV, we see a better annualized growth rate of 13.89% alongside marginally higher volatility, as measured by standard deviation. Still, risk-adjusted returns were better, and the graph nicely shows how USMC outperformed after the pandemic. That’s the growth part of the portfolio kicking in; as I’ve stated many times before, your portfolio needs to have the proper balance between growth and value if your outlook is wrong.
The table below highlights statistics for USMC’s top 20 industries. There are many similarities, but the exposure areas are quite different. If you’re looking to keep quality high, you’ll likely appreciate USMC’s makeup more. Its weighted-average Seeking Alpha profitability grade is an “A” compared to an “A-” for QLV.
The Sunday Investor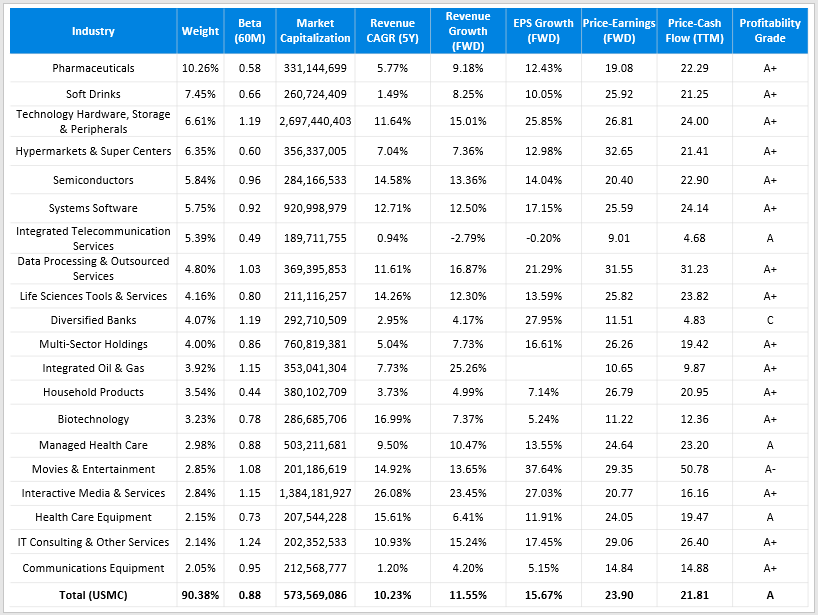
USMC’s concentration is reflected in that 90% of its constituents are in just 20 industries. You’ll still get double-digit revenue and EPS growth, but for a slightly lower forward P/E of 23.90. The key negative is a much higher 0.88 five-year beta, but I think it has a place for index investors wanting a slightly less volatile portfolio but aren’t yet willing to give up on the mega-caps.
Invesco S&P 500 Minimum Variance ETF
SPMV tracks the S&P 500 Minimum Volatility Index, which optimizes constituent weights using a model developed by Northfield, a risk management analytics provider. The model minimizes forecasted volatility subject to certain constraints, including stock and sector-level exposures. Like QLV, turnover is limited to 20%. However, sector exposures can’t deviate more than 5% from the parent Index, the S&P 500. Like USMC, it could be appropriate for investors wanting to only dabble in low volatility ETFs. The Index is rebalanced semi-annually in March and September, and you can find the methodology document here.
Since August 2017, SPMV has outperformed USMV and SPLV by an annualized 1.08% and 1.72%, respectively. Again, we see slightly higher volatility, but this time it resulted in worse risk-adjusted returns compared to USMV.
Portfolio Visualizer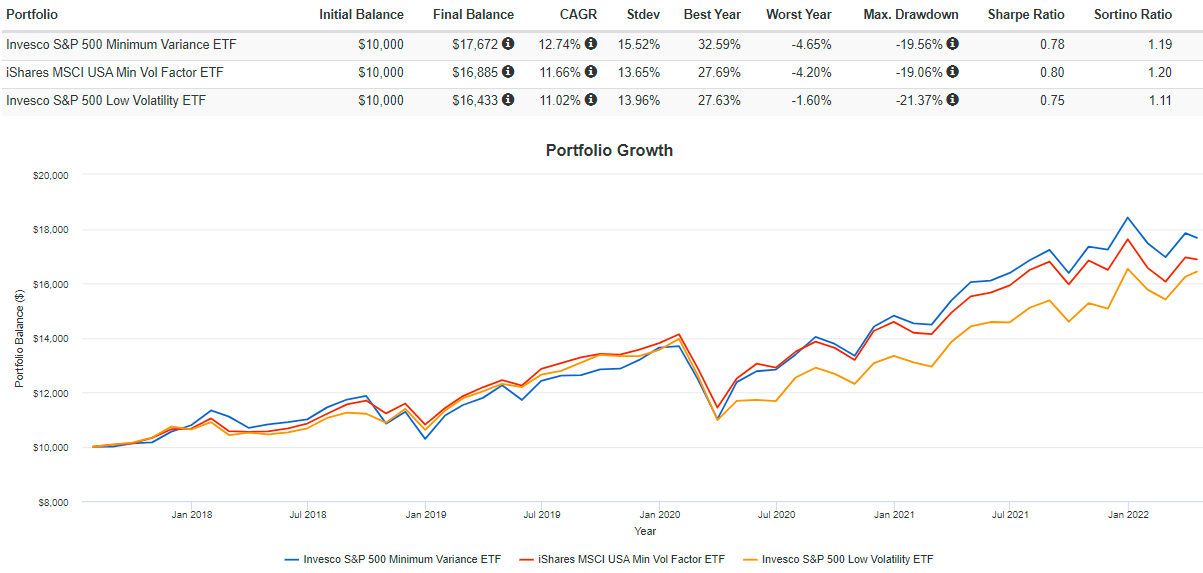
It’s disappointing that SPMV has racked up just $25M in AUM, especially since it’s the sixth-best-performing ETF in the category over the last four years. High AUM can indicate a high-quality portfolio, but sometimes, it’s just a function of better marketing. SPMV’s 0.10% expense ratio is the cheapest, so I think it deserves to be in the mix. Here’s a look at its top 20 industries:
The Sunday Investor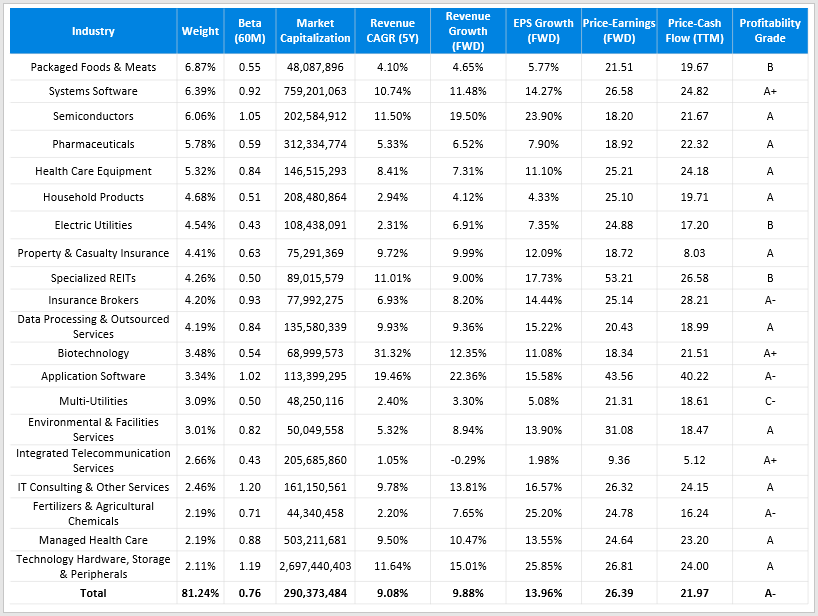
SPMV has nearly 7% exposure to Packaged Foods and Meats stocks, including Mondelez International (MDLZ) and General Mills (GIS). In contrast, QLV and USMC have 1.66% and 0% exposure to this industry, so it’s a different take. However, sales and EPS growth rates are lower, and the 26.37x forward P/E valuation is the highest. You may be able to find a spot for it in your portfolio, but only if you lack exposure to its top industries. Based on its significantly lower weighted-average market capitalization, you’ll also be targeting the lower-weighted large-cap stocks, which could be beneficial for diversification purposes.
Additional Information
The following table summarizes all the fundamental metrics mentioned earlier for QLV, USMC, and SPMV. I’ve also included some additional descriptive statistics and technicals for each ETF’s current portfolio. Note that this is different from what the ETFs experienced, and I think it’s necessary given that ETFs are dynamic products whose constituents and weightings routinely change.
The Sunday Investor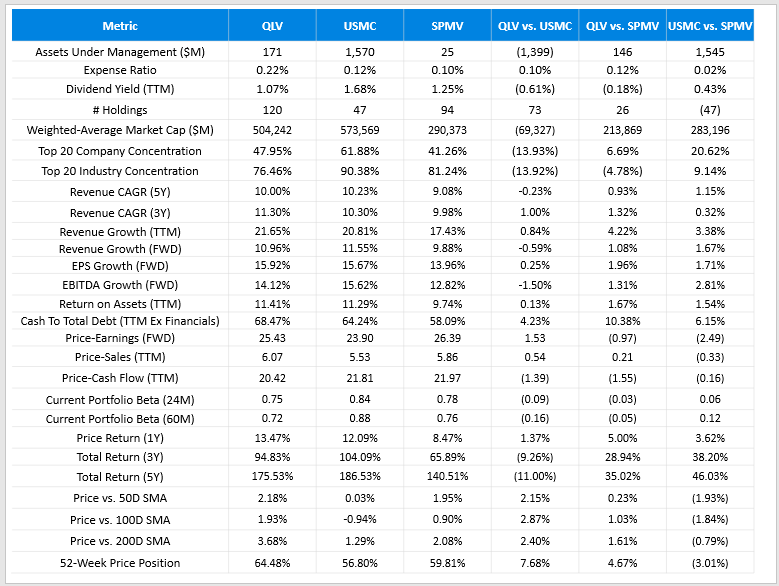
Finally, this last table shows industry concentration differences between the three ETFs. There’s little value in buying an ETF if it already has a lot of overlap with the rest of your holdings, so I hope this information can help guide you to making an efficient capital allocation decision.
The Sunday Investor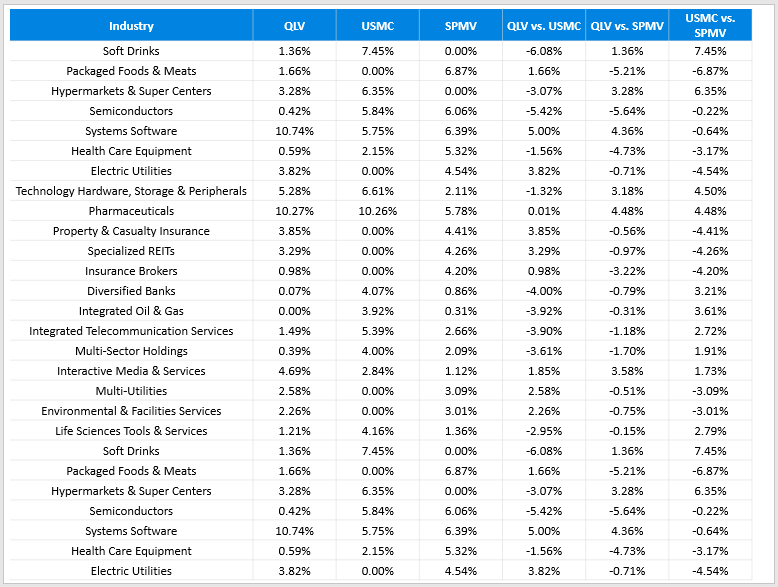
Investment Recommendation
Low volatility ETFs can play an essential part in protecting your portfolio in a market downturn. However, not all low volatility ETFs are created equal. Many work well only in corrections, and since markets usually go up, they are destined to underperform in the long run. Instead, I recommend insisting on low volatility, high profitability, solid revenue and earnings growth rates, and a valuation at or below the market. In my view, QLV, USMC, and SPMV check many of those boxes and are my picks to perform well.
I hope the information presented in this article was helpful, and if you’d like further information on any of the other ETFs mentioned in the tables, feel free to leave a comment.
Be the first to comment