

IvelinRadkov
Investment Thesis
If you’re looking to capture a solid dividend yield in the small-cap space, the WisdomTree U.S. SmallCap Dividend ETF (NYSEARCA:DES) is a great choice. This broad-based ETF holds over 650 securities across 75 GICS industries, distributes a 3% annual dividend yield paid monthly, has better growth prospects than most large-cap counterparts, and has seen its relative performance improve in the recent bear market. However, small-cap dividend investors must know what they’re giving up by investing in this category. Small-cap dividend companies tend to be less profitable than non-dividend-paying ones, and for only an additional 1% in yield compared to a broad-based small-cap value ETF, they may not be worth the trouble. Still, this article will provide the strengths and weaknesses of DES and three other alternatives and hopefully help you make the best decision for your portfolio.
ETF Overview
The Basics
WisdomTree’s website overviews some essential information you should know upfront. First, its expense ratio of 0.38% is high but is the lowest among other small-cap dividend funds (described later), and it’s also well-established with a track record dating back to June 2006. DES has $1.93 billion in assets under management, 63.95 million shares outstanding, and a 30-day average daily trading volume of 235,564. WisdomTree also lists an implied liquidity of 1.80 million shares per day. For reference, the WisdomTree U.S. LargeCap Dividend ETF (DLN) has an implied liquidity of 75.81 million shares, demonstrating that large-cap stocks are much more liquid than small-cap stocks.
WisdomTree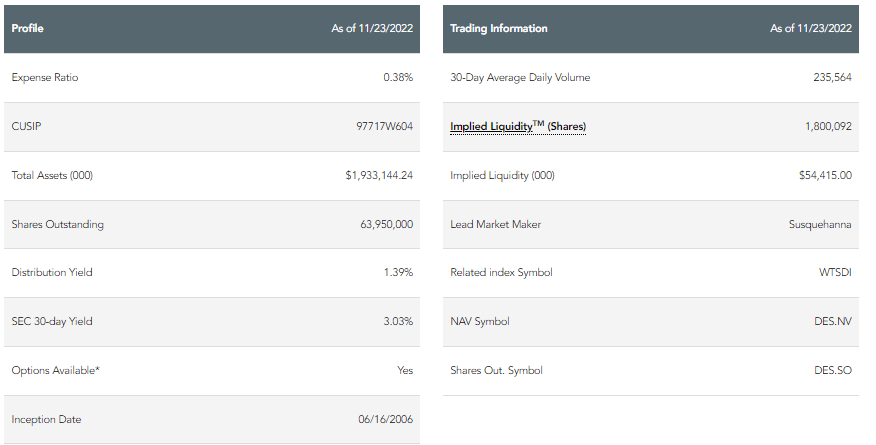
Strategy Discussion
DES tracks the WisdomTree U.S. SmallCap Dividend Index, a broad universe of stocks targeting the small-cap segment of the U.S. dividend-paying market. The process begins by removing the 300 largest stocks by market cap, then selecting the bottom 25% of the remaining stocks that pay a dividend. The median market cap for DES’s holdings is $994 million.
WisdomTree applies a quality screen to its domestic dividend ETFs, including DES. The screen examines quality (return on equity, return on assets, gross profits over assets, and cash flow over assets) and momentum (six- and twelve-month risk-adjusted returns). Stocks falling in the bottom decile of this equally-weighted composite score are excluded. In addition, stocks are removed if they fall in the bottom half of the composite rankings and place in the top 5% by dividend yield. It’s these little things that make WisdomTree ETFs unique. However, DES still holds over 650 securities, so it’s not a focused portfolio. The idea is to encourage investors to use DES as their core small-cap holding, possibly as an alternative to more popular funds like the Vanguard Small-Cap Value ETF (VBR).
Finally, DES is aggregate dividend-dollar weighted, a cross between the dividend yield and market capitalization weighting schemes. WisdomTree estimates the twelve-month cash dividends a company will pay by annualizing its most recent dividend and multiplying it by the number of outstanding shares. The emphasis is on high dividends, but larger companies with more shares (and more earnings they can distribute) have an inherent advantage.
Small-Cap Dividend Alternatives
You may be surprised that so few small-cap dividend ETFs exist. In my ETF database, I could only find five others:
- WisdomTree U.S. SmallCap Quality Dividend Growth Fund (DGRS)
- ProShares Russell 2000 Dividend Growers ETF (SMDV)
- First Trust Small Cap U.S. Select Equity ETF (RNSC)
- KFA Small Cap Quality Dividend ETF (KSCD)
- O’Shares FTSE Russell Small Cap Quality Dividend ETF (OUSM).
None of these alternatives follow a strict dividend-yield weighting scheme, which is telling. It begs the question if small-cap stocks should be paying high dividends, given their limited profits. There’s likely a market for high-income investors wanting small-cap exposure, but an ETF would be designed by now if that strategy were historically successful. As it stands, DES, with its 2.75% trailing yield, is among the highest in the small-cap space.
Sector Exposures and Top Ten Holdings
DES has many small-cap dividend-paying Financials securities, totaling 26.11% of the portfolio. 18.07% of this exposure is in the Regional Banks industry, spread among 192 companies. It’s a remarkable concentration level for what you’d assume is a well-diversified portfolio.
WisdomTree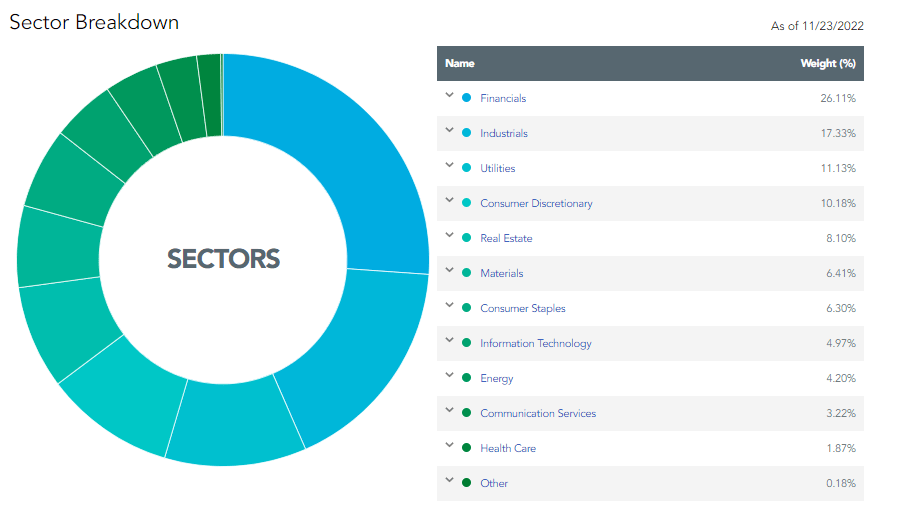
Next is Industrials at 17.33%, which is much better balanced. Industrial Machinery (3.70%), Trading Companies & Distributors (3.52%), and Construction Machinery & Heavy Trucks (2.50%) are the top three industries, followed by 16 others. In total, DES holds 101 stocks in this sector.
Rounding out DES’s top three sectors is Utilities, comprised of Gas Utilities (5.43%), Electric Utilities (2.12%), Multi-Utilities (1.93%), and Water Utilities (1.63%). These 24 companies tend to be larger, as demonstrated by an average $2.4 billion market capitalization. Therefore, these companies may soon be among the first to graduate to the WisdomTree U.S. MidCap Dividend Fund (DON). There are stocks in DON with market capitalizations as low as $2.03 billion, and 13 DES Utilities stocks (9.96% of the portfolio) are bigger. If this shakeup were to materialize, the result would be a decidedly less defensive fund, illustrated by these stocks’ low 0.56 five-year betas.
Finally, DES’s top ten holdings will reveal little because the ETF is broad-based. However, I have listed them below, identifying South Jersey Industries (SJI), Cogent Communications (CCOI), and New Jersey Resources (NJR) as the most prominent three. These companies currently yield 3.53%, 6.34%, and 3.17%.
WisdomTree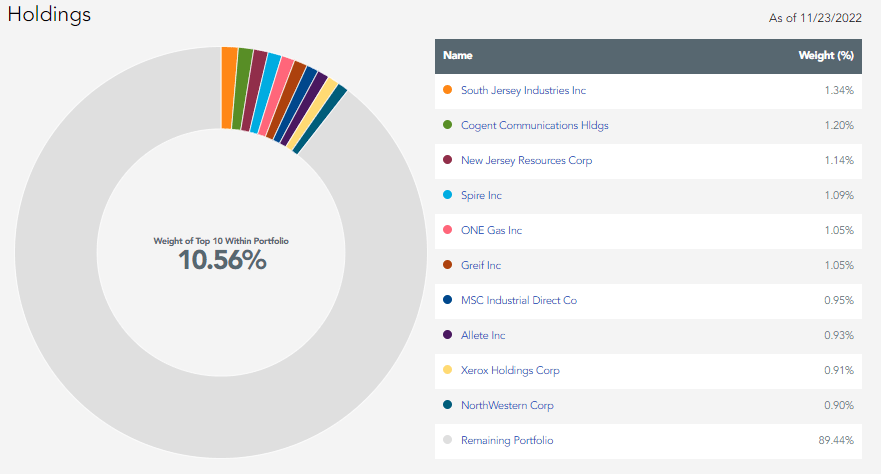
Performance Analysis
Performance vs. DGRS
Unfortunately, the small-cap dividend ETF alternatives listed earlier don’t have a significant track record. DGRS has the longest, dating back to July 2013, and adds a growth component to small-cap dividend-paying stocks. Let’s see how the two ETFs have performed against each other since DGRS’s inception.
Portfolio Visualizer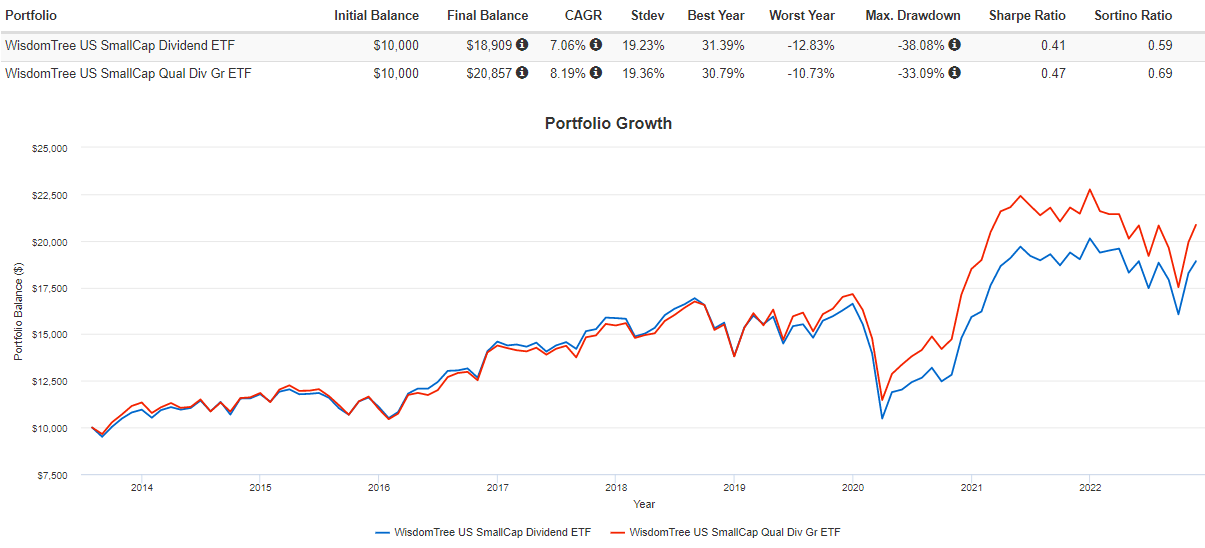
DES has gained an annualized 7.06% compared to 8.19% for DGRS, a 1.13% per year underperformance with similar volatility. The Q1 2020 drawdown of 38.08% set DES back, and that’s reflected in a lower Sortino Ratio, a standard measure of downside risk-adjusted returns. DES is slightly outperforming DGRS this year (6.06% loss vs. 8.35% loss) but is still doing much worse than WisdomTree’s mid- and large-cap dividend ETFs, which are down just 0.52% and 1.23%, respectively.
From an income perspective, DES started as a solid investment, but DGRS has demonstrated superior dividend growth over the last few years. A $10,000 initial investment in July 2013 would yield a YTD portfolio income of $459 ($551 annual) for DGRS compared to $390 YTD ($468 annual) for DES.
Portfolio Visualizer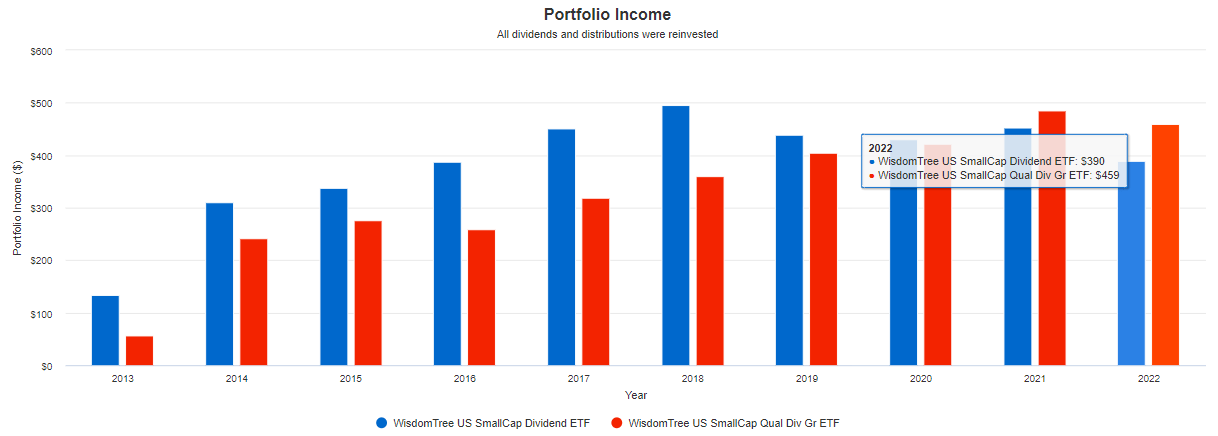
Seeking Alpha highlights DES’s poor dividend growth on its Dividend Scorecard page for the fund. Over the last five years, dividends have grown by only 1.24% per year. DGRS’s five-year dividend growth rate is much better at 13.14%. In my view, income investors should consider their time horizons first when deciding which ETF to choose. If they don’t have an immediate need for income, it’s best to favor the higher growth fund.
Seeking Alpha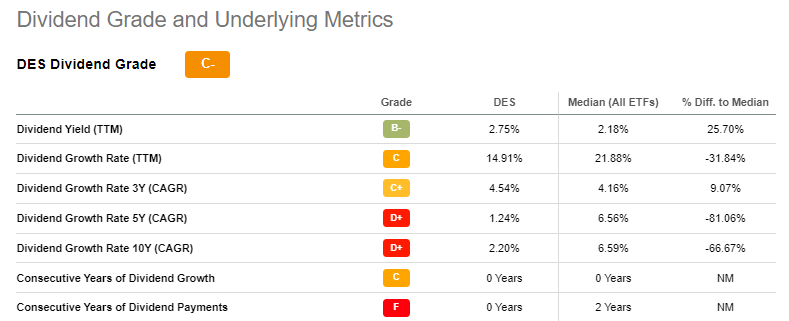
Performance vs. VBR
Dividend ETFs are often value-oriented, so DES investors can also consider VBR or the SPDR S&P 600 Small Cap Value ETF (SLYV), one of the best-performing small-cap value ETFs in the last decade. VBR and SLYV yield 1.96% and 1.92%, so there is an evident sacrifice in dividends. However, total returns were much more substantial. It’s additional evidence indicating how investing in small-cap stocks with high dividends isn’t an optimal strategy.
Portfolio Visualizer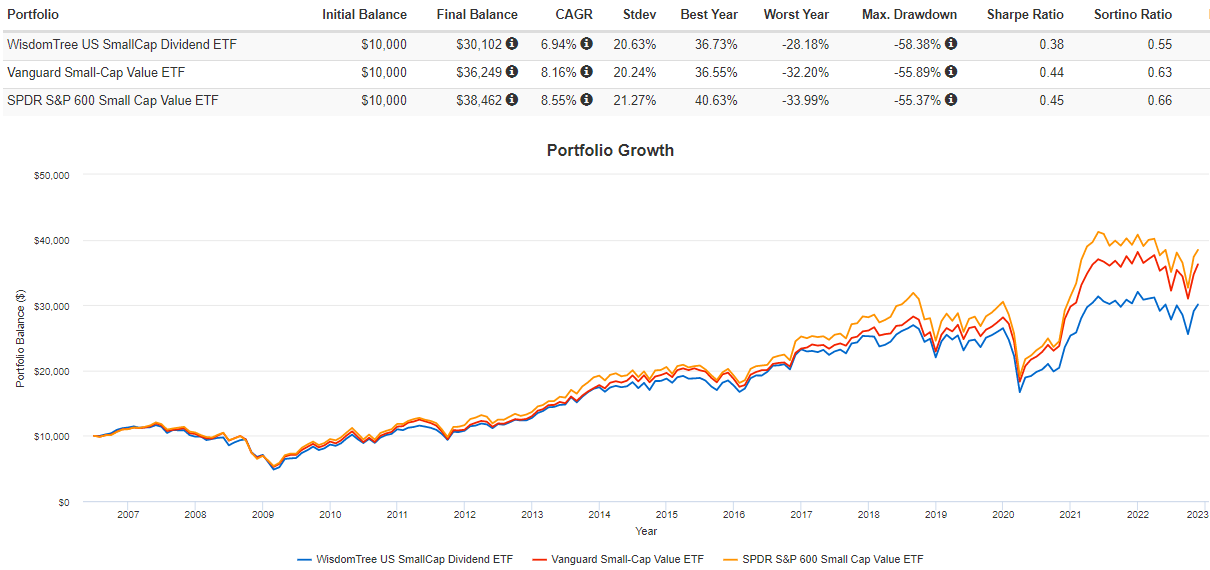
DES has gained 6.94% per year since July 2006, or 1.21% and 1.71% per year less than VBR and SLYV, with a similar level of volatility. That difference is substantial. On a $10,000 initial investment, SLYV shareholders ended up with $8,360 more. Furthermore, there were only a few periods where DES was the better investment, assuming an investor had a three-year time horizon. The annualized rolling returns graph below shows that the last time DES outperformed was for the three-year period ending June 2012. That’s a long time to wait for the high-dividend strategy to pay off.
Portfolio Visualizer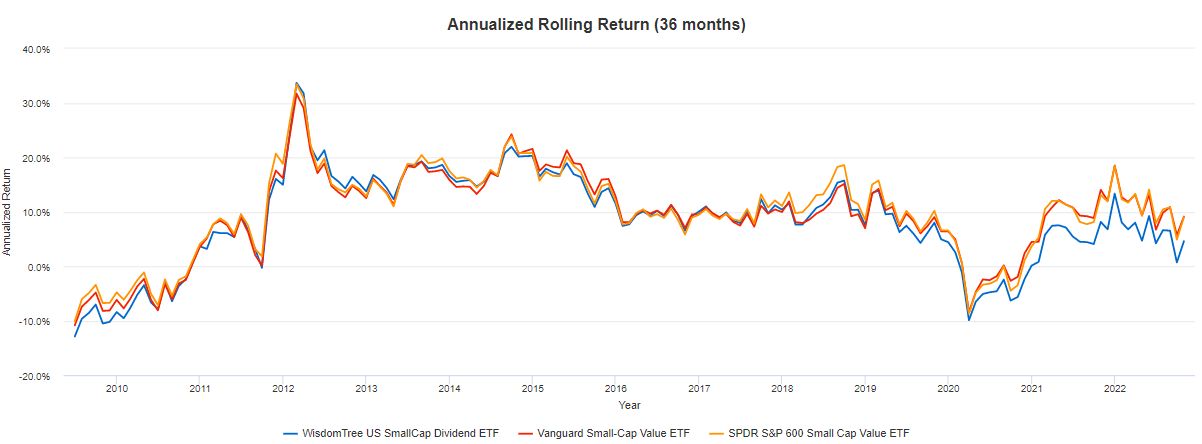
Fundamental Analysis
I’ve broken down DES by its top 25 industries in the table below and included several relevant fundamental metrics for dividend investors. In addition, I’ve provided summaries for DGRS, VBR, and SLYV for easy comparison.
The Sunday Investor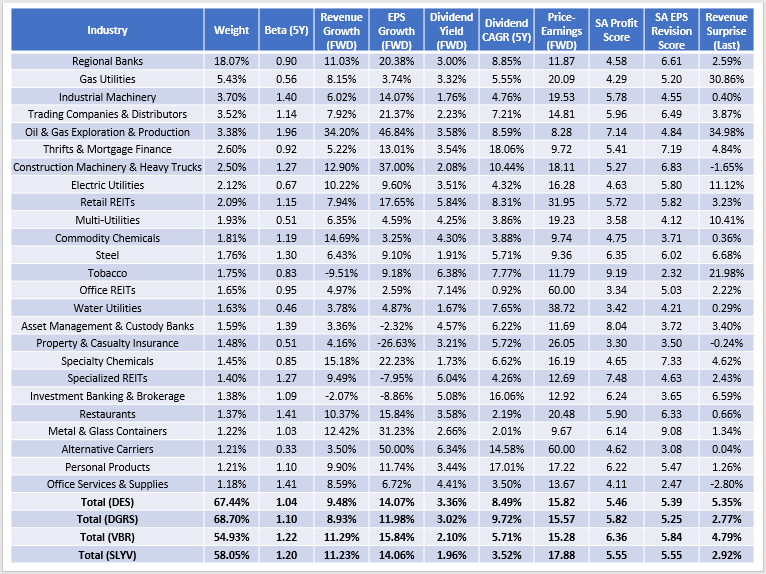
First, let’s compare DES with DGRS, as they are the two dividend-focused ETFs. The two have roughly the same level of concentration in their top 25 industries (67.44% and 68.70%) and a similar price-earnings ratio (15.82 vs. 15.57), but DES is less volatile, as indicated by its 1.04 five-year beta. DES also has superior estimated sales and earnings growth, a better gross dividend yield (3.36% vs. 3.02%), and better performance last earnings season, as indicated by its last revenue surprise figure (5.35% vs. 2.77%). In my view, DES wins, hands down. After adjusting for its 0.38% expense ratio, DES investors can expect a dividend yield close to 3%.
However, less risk-averse investors may consider VBR, a better-diversified ETF with a 0.07% expense ratio. Its expected forward yield is about 2% after fees, but it’s a higher-quality ETF, as suggested by its Seeking Alpha Profitability Score (6.36/10 vs. 5.46/10). In addition, VBR has a better sales and earnings growth rate and a cheaper valuation. Those are some significant sacrifices for a mere 1% extra in dividends.
Investment Recommendation
DES is one of the better small-cap dividend ETFs available, and if you’re adamant about buying into that space and keeping risk low, it makes sense. DES is a monthly payer that should yield about 3%, and as far as fundamentals go, it looks better than DGRS. However, it’s reasonable to question if small-caps should be paying high dividends in the first place. Quality appears weak, and the fact that so few small-cap dividend ETFs exist suggests the strategy isn’t worth pursuing. As an alternative, investors should consider VBR. It’s better diversified, has more robust growth prospects, and generally is a higher quality ETF. Thank you for reading, and I look forward to any comments below.
Be the first to comment