

pchoui
Investment Thesis
Winnebago Industries (NYSE:WGO) has built a portfolio of premium brands in the recreational vehicles industry. These strong brands have powered persistent earnings growth in recent years and have a long runway for growth ahead. Led by a shareholder-friendly management team that has developed a track record of delivering strong returns on equity relative to industry peers, WGO offers a great investment opportunity as the share price has been beaten down in recent months.
Business Description
WGO has been manufacturing recreational vehicles since 1958, and through these recreational vehicles, WGO empowers its customers to explore the outdoor world. WGO’s products include Class A, B, and C recreational vehicles. In addition, they also sell travel trailers, 5th wheels, and even boats and pontoons. If you are new to the industry and have no idea what these are, the image below will help you understand WGO’s product offerings.
Image from Baird 2022 Global Consumer, Technology & Services Conference presentation 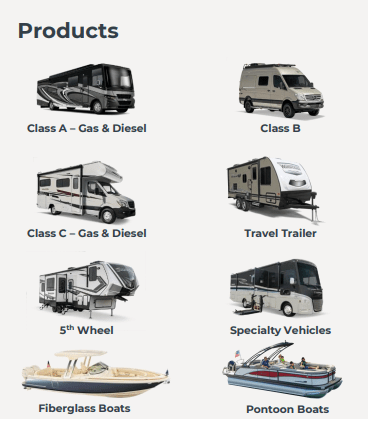
Its namesake brand, Winnebago, is the class B RV market share leader with 38% share. Winnebago also manufactures class A and C RVs, which management sees as a significant market share opportunity. In recent years WGO has prioritized inorganic growth with several significant acquisitions, including Grand Design in 2016 and Newmar in 2019. These were both welcomed additions to WGO’s portfolio of brands with Grand Design as the 5th wheel segment leader while Newmar is the luxury class A leader. In addition, WGO has diversified into the boating industry by acquiring Chris Craft in 2018 and Barletta Boats in 2021, the 5th largest pontoon manufacturer and one of the fastest growing pontoon companies in the industry.
These acquisitions have helped WGO rapidly grow revenues from $975 million in 2016 to $3.6 billion in 2021.
WGO data from Baird 2022 Global Consumer, Technology & Services Conference presentation 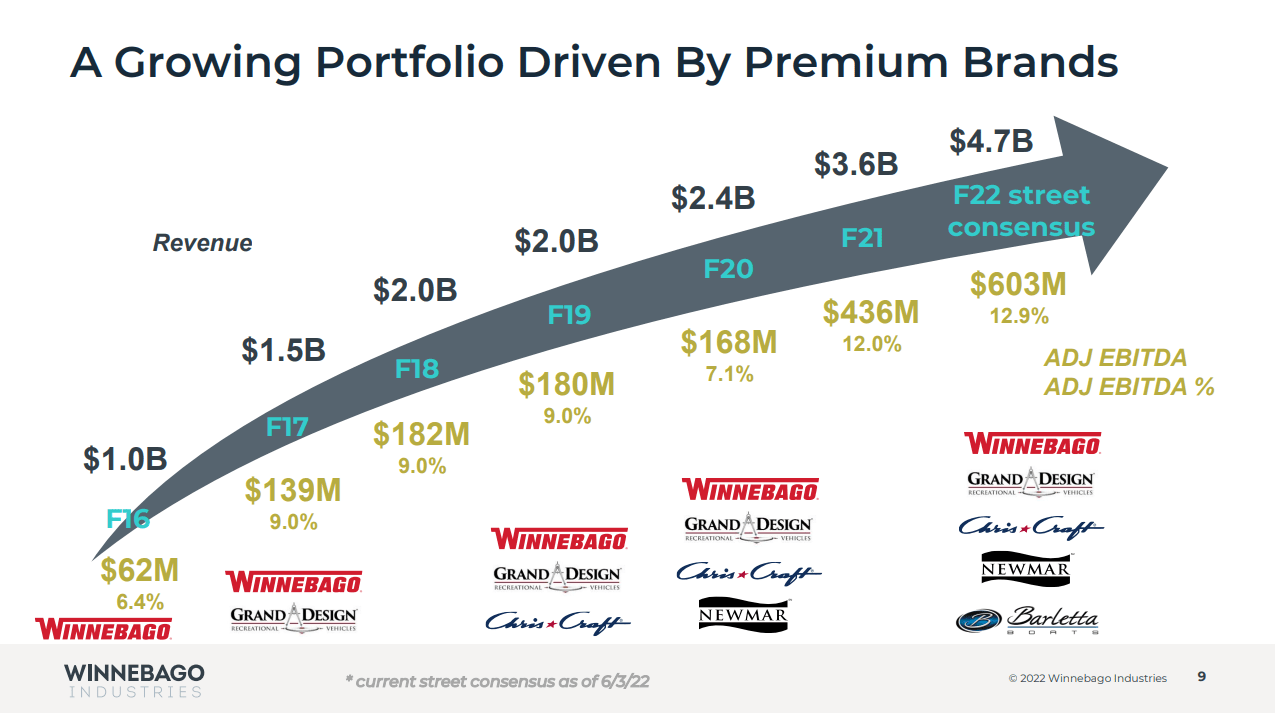
WGO’s market share has grown rapidly during this period, with a 3.3% RV market share in 2016 and a 12.5% market share in 2021.
WGO data from Baird 2022 Global Consumer, Technology & Services Conference presentation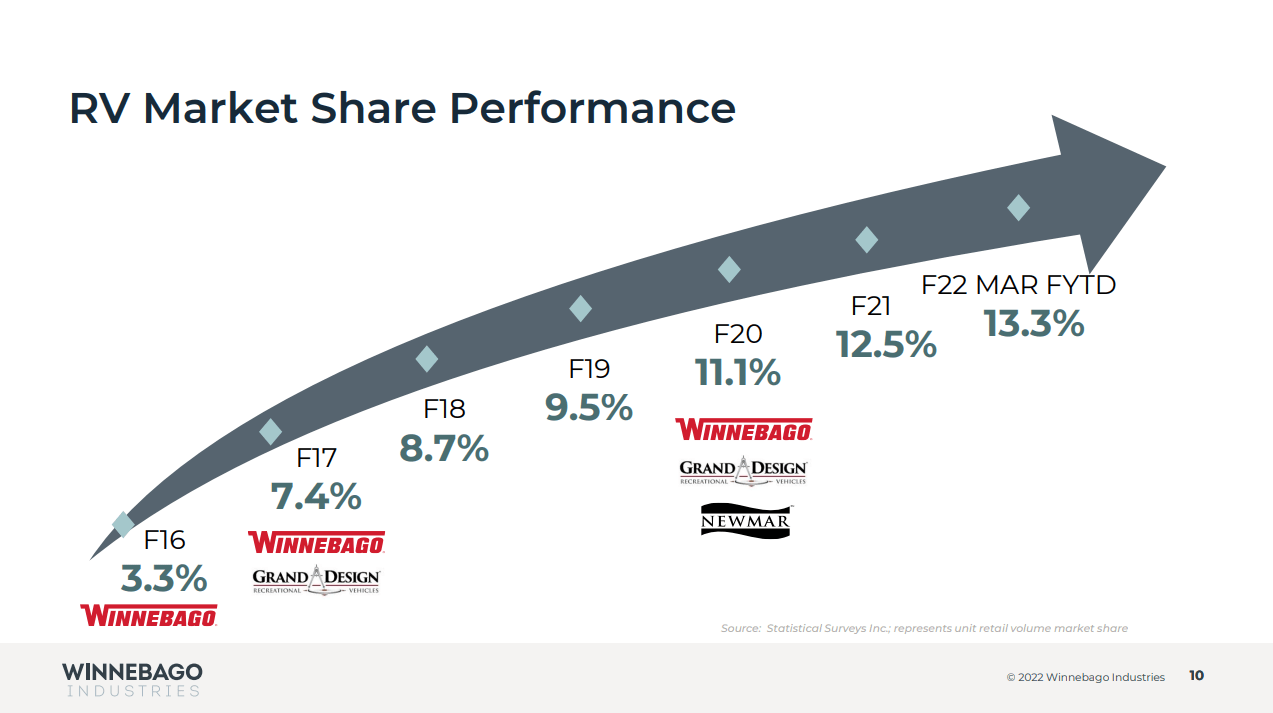
Despite this recent acquisition spree, WGO has managed to keep debt-to-equity levels low at 0.46 as management has committed to rapidly paying down debt post acquisitions.
Management’s Track Record
Management has delivered strong returns on equity. Over the last decade, WGO has had an average return on equity of 21.36%, with just one year under 15%, which happened to be the year of the Covid-19 Pandemic in 2020. Over the trailing 12 months, WGO has delivered a 34.48% return on equity compared to a sector median of 14.98%.
WGO data by Stock Analysis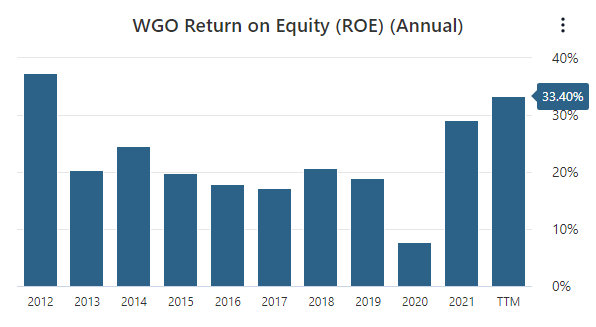
Besides ROE, WGO has delivered robust operating margins compared to the leisure products industry and industry rival Thor Industries, Inc. (THO), outperforming both every year since 2017. WGO almost doubled THO’s operating margin last year 11.20% to 6.86%.
WGO data by MSN Money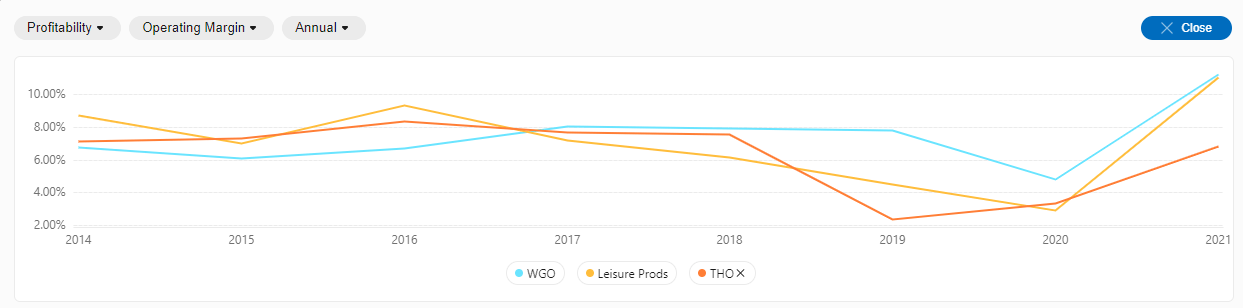
Management is also increasingly becoming more shareholder friendly as they’ve returned more capital to shareholders through dividends and share repurchases.
WGO data from Baird 2022 Global Consumer, Technology & Services Conference presentation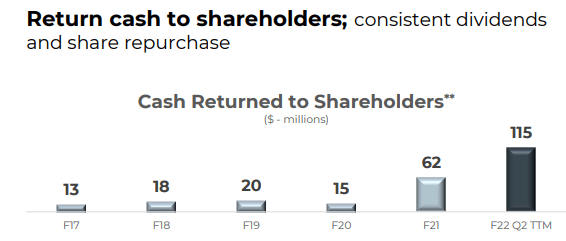
With WGO’s stock price losing more than 30% of its value year to date, management has taken this opportunity to buy back even more shares, as evident in the 2022 Q3 Earnings Call, CFO Bryan Hughes stated:
Additionally, our dividend this year is running at a pace that is 50% higher than it was last year. Combining share buybacks with dividends, we have returned a robust $187 million to shareholders on a trailing 12-month basis through the third quarter of fiscal 2022. This is approximately 7.3 times the prior year’s fiscal third quarter trailing 12-month period.
Opportunities For Growth
WGO has done an excellent job winning market share in the recreational vehicle industry for many years. With recent acquisitions of Chris Craft and Barletta Boats, WGO will attempt to do the same in the $170 billion marine industry. With 100 million Americans going boating annually, it’s easy to see the industry’s appeal. The marine industry has been growing fast, with a compound annual growth rate of 7.1% from 2015-2020. According to industry experts, the marine industry’s growth rate will accelerate in the future with an expected CAGR of 11.3% through 2025. It’s still early for WGO in the marine industry, with the Barletta acquisition closing less than a year ago.
Still, WGO is already seeing Barletta gain market share as they are now the 5th largest pontoon boat manufacturer. WGO will continue to leverage its manufacturing expertise to ramp up production and find operational efficiencies in Barletta and Chris Craft. They will also utilize their best-in-class sales teams to win market share in this new industry. If WGO can execute on this, then they should be able to find meaningful growth in the marine industry for many years to come.
Another area of growth for WGO is their Advanced Technology Group which has been working to develop an all-electric RV. WGO recently had this all-electric RV on display at the Tampa RV Supershow earlier this year. All-electric RVs would be a long-term play but WGO currently has one concept vehicle in use. It has a reported range of 125 miles, can be fully charged in 45 minutes, and can be charged at dedicated charging stations across the nation which are currently in use. I believe this is an exciting opportunity for WGO, which could take many years to realize. WGO’s existing customer base are people who enjoy the outdoors and are environmentally conscience, so I believe developing an all-electric RV is another opportunity for WGO to win market share in the long term.
Risk Factors
In recent times, several macroeconomic factors, including inflation and higher interest rates, have weighed down consumer spending, negatively affecting WGO’s business as most of WGO’s products are bigger ticket items, including RVs and boats. Though WGO can do little to change the macroeconomic environment, they can control their production schedules and cut spending to help navigate through difficult times ahead, just as they have done in the past, including the recent pandemic, where they remained profitable.
An economic recession may be lurking soon, but WGO has built a resilient business with a strong portfolio of brands and a balance sheet to match. In addition, WGO has more working capital than it’s had in the past decade, which can be used to pay off debt, or perhaps another timely acquisition awaits.
Valuation
To place a value on WGO, we will run comparative and discounted cash flow analyses. To begin, we’ll start with the comparative analysis and look at highest, lowest, and average price-to-earnings ratios the market has paid for WGO over the past five years, which are 4.51, 14.54, and 22.51. We’ll also look at the sector median PE, which is 9.06. Finally, we’ll multiply these ratios by the average analyst estimate of 2023 earnings which is $9.04.
| Scenario | PE | 2023 Earnings Estimate | Intrinsic Value Estimate | % Change from Current price |
| Bear Case | 4.51 – Current PE | $9.04 | $40.77 | -22% |
| Average | 14.54 – 5 year average | $9.04 | $131.44 | 151% |
| Bull Case | 22.51 – 2017 PE | $9.04 | $203.49 | 288% |
| Sector Median Valuation | 9.06 | $9.04 | $81.90 | 56% |
At least on a comparative analysis, WGO appears to have a more significant upside than downside. Investors would realize a very nice return if the market were to get bullish and apply the 22.51 multiple that we saw in 2017 to next year’s earnings estimate. Of course, WGO is currently sitting at the lowest PE level we’ve seen over the last few years, so the market is very bearish on the outlook of WGO. However, even still, if WGO were to see its trailing 12 months earnings cut by 2/3rds, we would be left with earnings of $3.91 per share, and at WGO’s current price, we’d have a PE ratio of 13.36, which is still less than the five year average of 14.54. This shows me that WGO has minimal downside risk from here.
Turning to the discounted cash flow analysis, we will begin by taking the average of the last five years of free cash flows and applying a 7% growth rate for the next ten years and a 2.5% growth rate into perpetuity to figure out the terminal value. Using the average of the last five years of free cash flows, we will see that we are assuming a modest drop in 2021 free cash flow to start the DCF analysis.
This free cash flow drop is fair as I like to be conservative when doing this analysis. In addition, we use a 7% growth rate for the first ten years because rule 72 tells us that a 7% growth rate will double the original investment in 10 years, which I think is fair to assume for WGO. We will then use a discount rate of 10.55% based on a weighted average cost of capital calculation I have done. With that, the DCF analysis gives us an intrinsic value of $74.06, representing an upside of 42.23% from the current share price of WGO. Interestingly, WGO opened the year at a share price of $75.
Writer’s research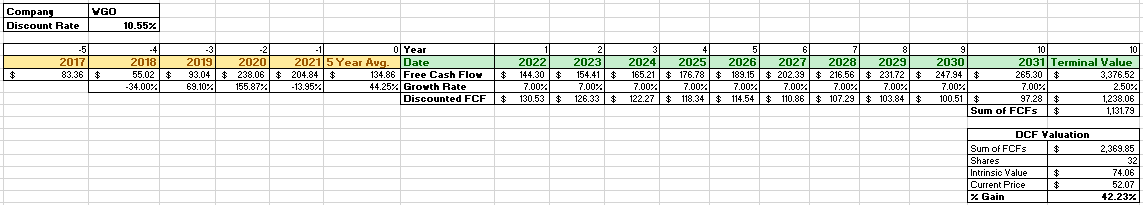
Summary
At the current earnings multiple of 4.51 that the market is paying for WGO, investors are concerned about the outlook of this company. As the current macroeconomic environment has deteriorated over the past few months, so has WGO’s share price. It is my stance that management has done an excellent job of adding premium brands to WGO’s portfolio, they continue to invest in the business and look to penetrate new markets. Management has navigated WGO through difficult times, including the recent pandemic, and I believe they can do it again. I think this is an excellent buying opportunity for WGO, but please let me know your thoughts in the comments section below.
Be the first to comment