


jetcityimage
Thesis
When JPMorgan Chase (NYSE:JPM) released its Q2 earnings report, it disappointed the media, but did not disappoint buyers waiting to pounce on a supposedly weak Q2 card.
The bank temporarily suspended buybacks and increased its reserves in response to its stress test and a looming economic slowdown/recession. As a result, the consensus EPS estimates were revised through FY23, reflecting the impact of these headwinds.
Yet, JPM stock has recovered its post-earnings losses as the buyers rejected the selling pressure decisively. We have also discussed in a pre-earnings article that JPM had a validated bear trap (meaning the market rejected further selling downside resolutely). Consequently, the post-earnings sell-off initially invalidated the bear trap but was quickly revalidated as the buyers absorbed the selling pressure.
As a result, it created a robust re-entry signal, further corroborating its pre-earnings price action.
Therefore, we are increasingly confident that JPM has likely seen the worst of its sell-off and is unlikely to re-test lows below $100 in the medium-term. Notwithstanding, there could be short-term volatility, as it’s near-term overbought, given last week’s recovery.
Therefore, we reiterate our Buy rating on JPM, with a near-term price target of $126 (potential upside of 9.8%).
JPM Stock Key Metrics
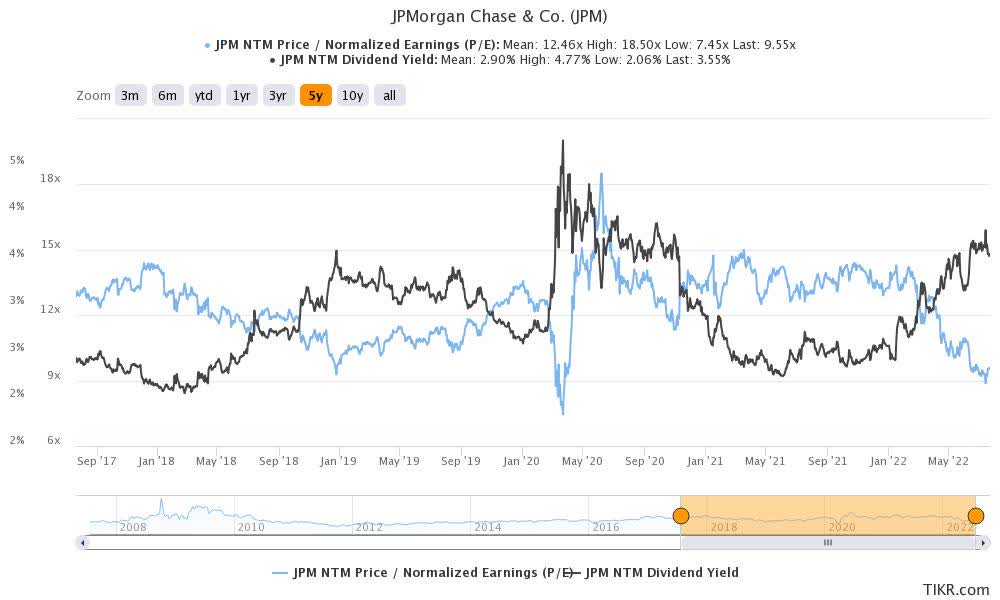
JPM NTM valuation metrics (TIKR)
As seen above, the market had already anticipated a weak Q2 for JPMorgan heading into its earnings release. In addition, we noted in our pre-earnings article that JPM traded at an NTM normalized P/E of 9.54x, well below its 5Y and 10Y mean of 12.51x and 11.39x, respectively. Therefore, we believe the market has already factored in the near-term recessionary headwinds and potential EPS estimates revision.
Berenberg also weighed in on the weakness in its investment banking fees. The firm articulated that the market has likely anticipated it, as it added (edited):
The headwinds of reduced investment banking activity, paused stock buybacks, and rising expenses are temporary and downside risks to the bank’s share price are now more limited. JPMorgan shares are trading at ~20% discount to their long-run average. It has been clear for some time that 2022 would not be a good year for investment bank revenues. The cyclicality is part of any investment bank’s operations, and JPMorgan’s revenue remains buoyant by historical standards. – Seeking Alpha
JPM last traded at an NTM normalized P/E of 9.55x (Vs. 5Y mean of 12.46x, implying a 23.3% discount). Therefore, the market appears willing to support its current valuation based on the recovery in the last two weeks. As a result, we are confident that unless things take a marked turn for the worse, JPM is unlikely to revisit the $100 in the medium-term. But Why?
The Street Remains Confident Of A Recovery By FY23
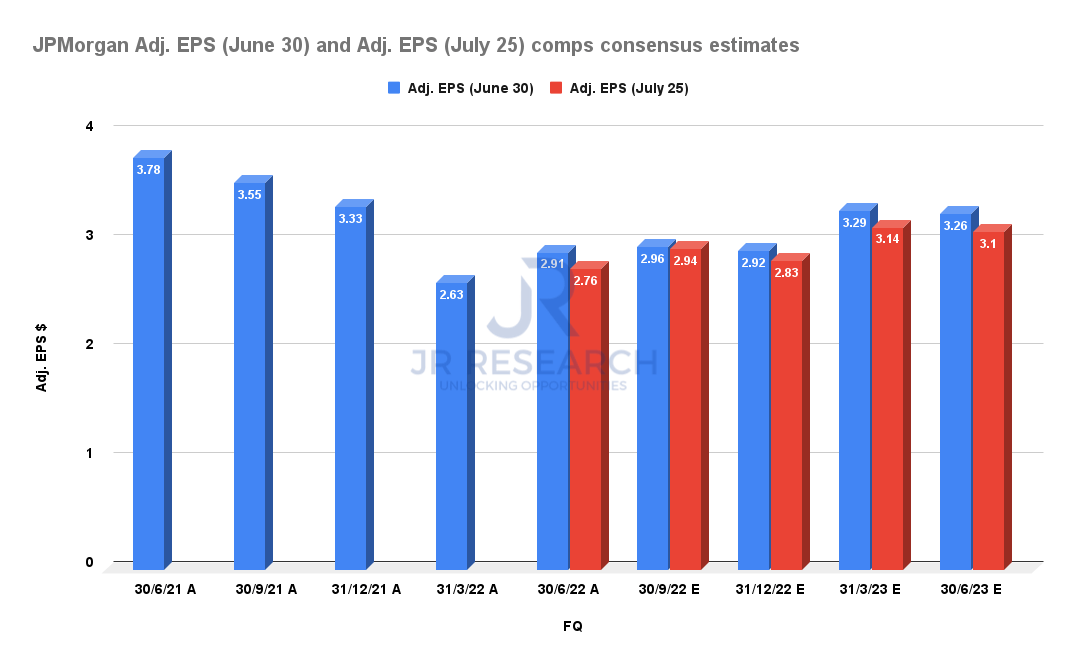
JPMorgan adjusted EPS comps consensus estimates (S&P Cap IQ)
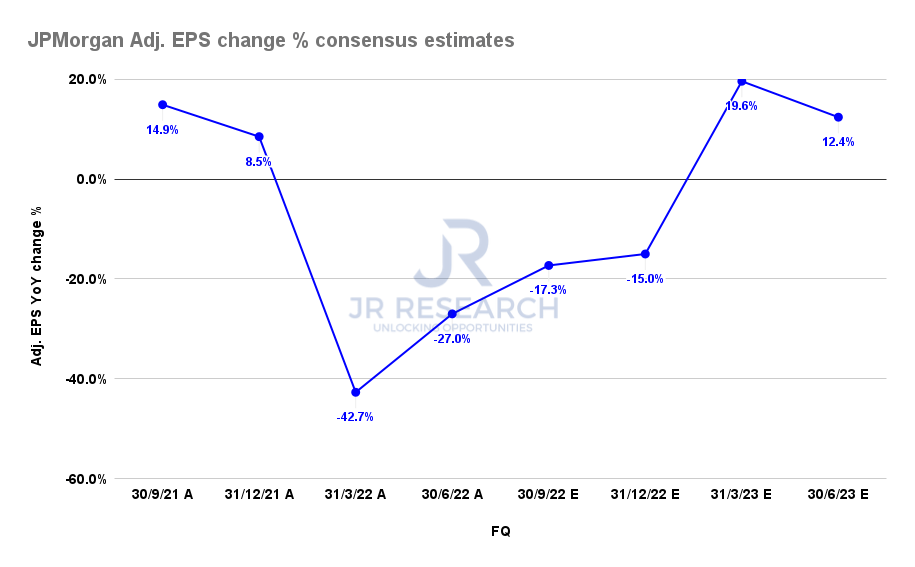
JPMorgan adjusted EPS change % consensus estimates (S&P Cap IQ)
As seen above, the consensus estimates (bullish) were revised downwards after its Q2 release. Therefore, we believe bearish/pessimistic JPM investors sold off their shares rapidly after its earnings card, as they were expecting a deeper sell-off.
But, the market decisively rejected those bears. We believe the market is forward-looking and anticipates a recovery from FY23. As seen in the second chart above, JPMorgan’s adjusted EPS should recover significantly from Q1’23 after lapping challenging 2021 comps amid an economic slowdown.
As a result, JPM last traded at an FY24 normalized P/E of 8.73x, which is 30% below its 5Y mean. For JPM to head back below $100, JPM’s FY24 normalized P/E would fall to 7.6x, in line with its COVID lows. We think such a prognosis is unlikely unless things become as bad as the COVID pandemic. And the market is not buying that, given its post-earnings reaction.
JPM – Price Action Has Been Strengthened
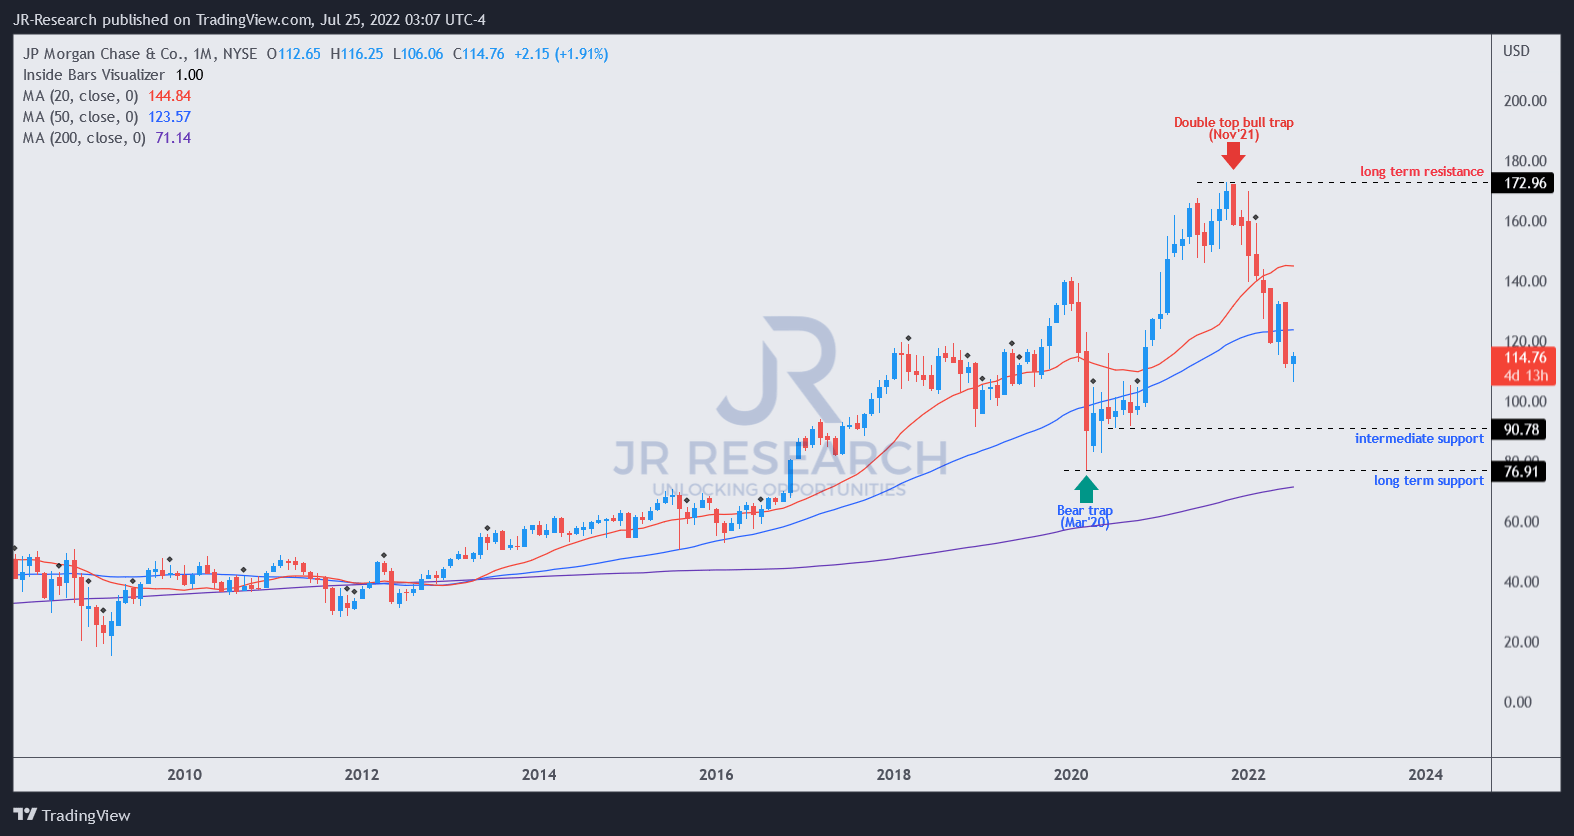
JPM price chart (monthly) (TradingView)
JPM remains supported along its critical 50-month moving average (blue line), which has undergirded its long-term uptrend for the past ten years. As long as its current price levels remain supported, we believe JPM should maintain its long-term bullish bias. We also believe that the current levels have attracted long-term dip buyers to add exposure, further corroborating the buying support.
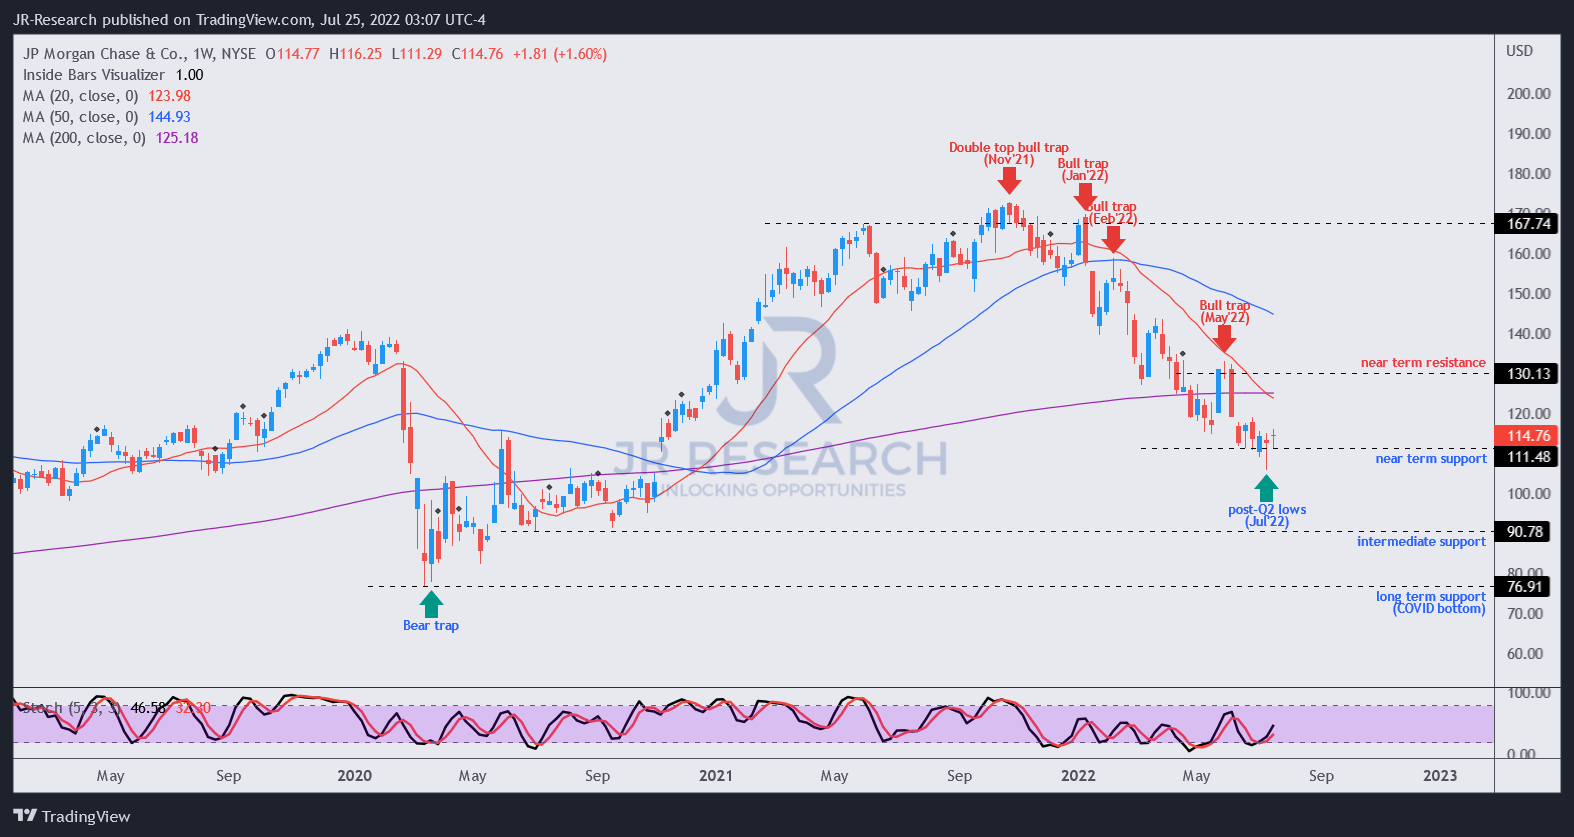
JPM price chart (weekly) (TradingView)
However, JPM remains mired in a medium-term downtrend. But, we observed that the post-earnings sell-off two weeks ago did not cause damage to our pre-earnings bear trap.
Even though the sell-off initially invalidated the price structure, the sharp recovery has revalidated it, resulting in a potent re-entry signal. Such a signal suggests that the market astutely used the weak sentiment after its earnings release to “trick” bearish/pessimistic investors into giving up their shares. As a result, it forced an initial steep selldown, before recovering all its losses.
Therefore, the price action is looking increasingly constructive for JPM.
Is JPM Stock A Buy, Sell, Or Hold?
We reiterate our Buy rating on JPM.
Its post-earnings sell-off and re-entry signal has increased our confidence that JPM has likely seen its worst sell-down. Notwithstanding, it seems to be overbought in the near term. So, investors can consider a retracement first before adding exposure.
We believe JPM is unlikely to re-test its $100 level in the medium-term. Instead, we believe the macro headwinds are transitory, suggesting a robust earnings recovery from FY23.
Be the first to comment