

Andrew Burton
Following my September article, Alibaba’s share price did not break out higher to repass the technical fakeout and chose to break below the $73 support region, bottoming so far at $58. This article will cover the latest news and technical analysis about Alibaba.
The GameStop chairman will be hoping to add his Midas touch to a reported latest stake in the Chinese E-Commerce giant.
After taking a minority stake, Cohen is actively pressing Alibaba (NYSE:BABA) to accelerate its share buyback plan and what weight his reported stake of hundreds of millions of dollars will hold with the company currently valued at $300 billion is yet to be seen.
His position in Alibaba reported by The Wall Street Journal follows an announcement by the Chinese company several months ago that it was commissioning $15 billion towards its share repurchasing scheme.
Ryan Cohen is a household name for retail traders after his input in the rise of share prices for companies such as Bed Bath & Beyond (BBBY) and GameStop (GME).
Traders hoping to capitalize on his latest vision for a bullish move in Alibaba which he hopes will see a double-digit sales expansion and near twenty percent growth over the next five years will be cautious even with a protracted reopening of the Chinese economy because of the crackdown on tech companies coming from Beijing.
Cohen joined GameStop in 2021 after revealing a 13% stake in the retailer, which may have contributed to the share price rise at the time.
The issue is that if Cohen’s midas touch and bullish vision does not work this time, traders following this move could be caught in an equity that is yet to cement a macro bullish breakout pattern.
Aside from regulatory issues in China, a plan possibly weighing on an accelerated buyback scheme and projected growth figures that could be questionable, Cohen’s bet could come to fruition.
Now we will move to the macro chart to see what investors are technically buying if following this move, and what proof there may be of a future price prediction from the monthly chart. But before we do, it is the weekly chart we turn to first as Alibaba has been on the move and is looking for an area to create the rejection that can lead to that macro future price prediction and there is some interesting viewing on this chart.
We can see below on the weekly chart the three-wave pattern has long seen its wave one replication and is now looking to arrive at the Fibonacci 423 circa $120. In my book, The Ward Three Wave Theory, I explain how a numerical copy of wave one in that timeframe you are trading, is all that is available for a future price reading. Of course, a wave may continue past this target and must do in order for waves to climb through the time frames, and here is a classic example. The weekly has climbed to the last stage of the Fibonacci projection being the 423% and is now looking to the monthly chart to create the rejection to propel this equity higher in the next timeframe.
Alibaba weekly (C Trader)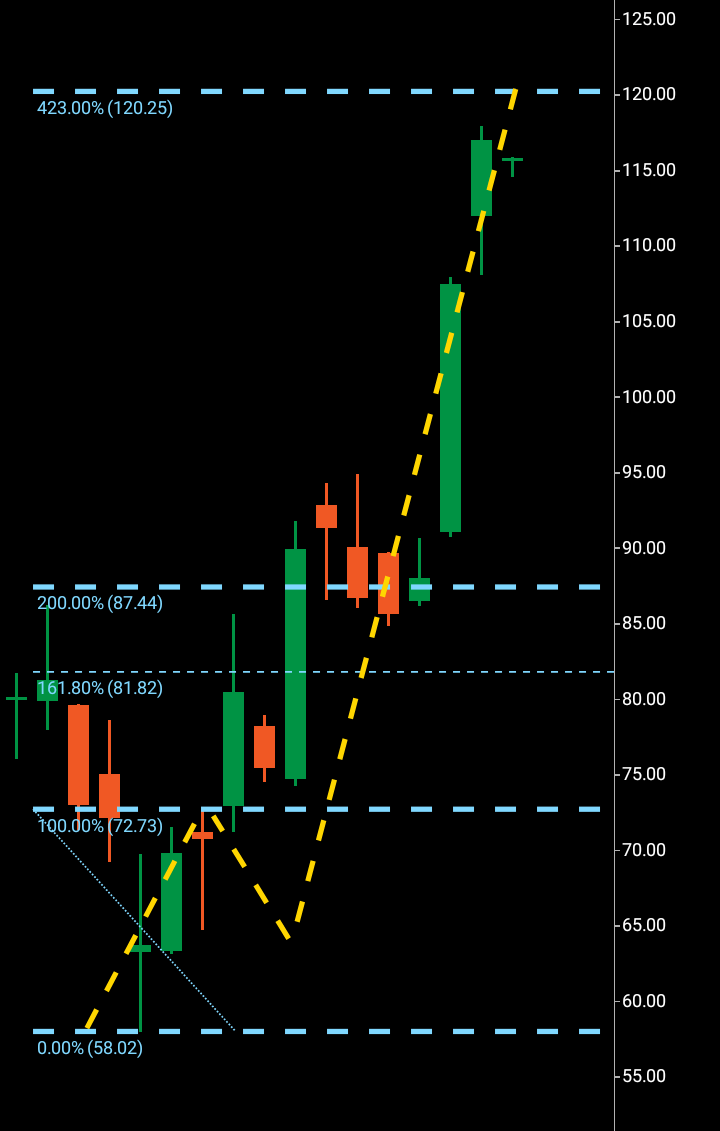
So is this price region of $120 where we could find the wave two rejection for the monthly three-wave pattern? Possibly…
Now we will move to the monthly chart to examine what investors are technically buying, at the moment as there is no rejection printed yet giving way to a macro third wave, so technically it is a blind buy for the moment.
We will just transfer the pattern from the weekly chart in formation rather than look at a naked monthly chart. We can see there is no rejection yet. A rejection must form and print on the said timeframe candle in bearish form in order to pave the way for the third wave. As we speak, there is none formed yet and no evidence of a future bullish price target.
Alibaba monthly (C Trader)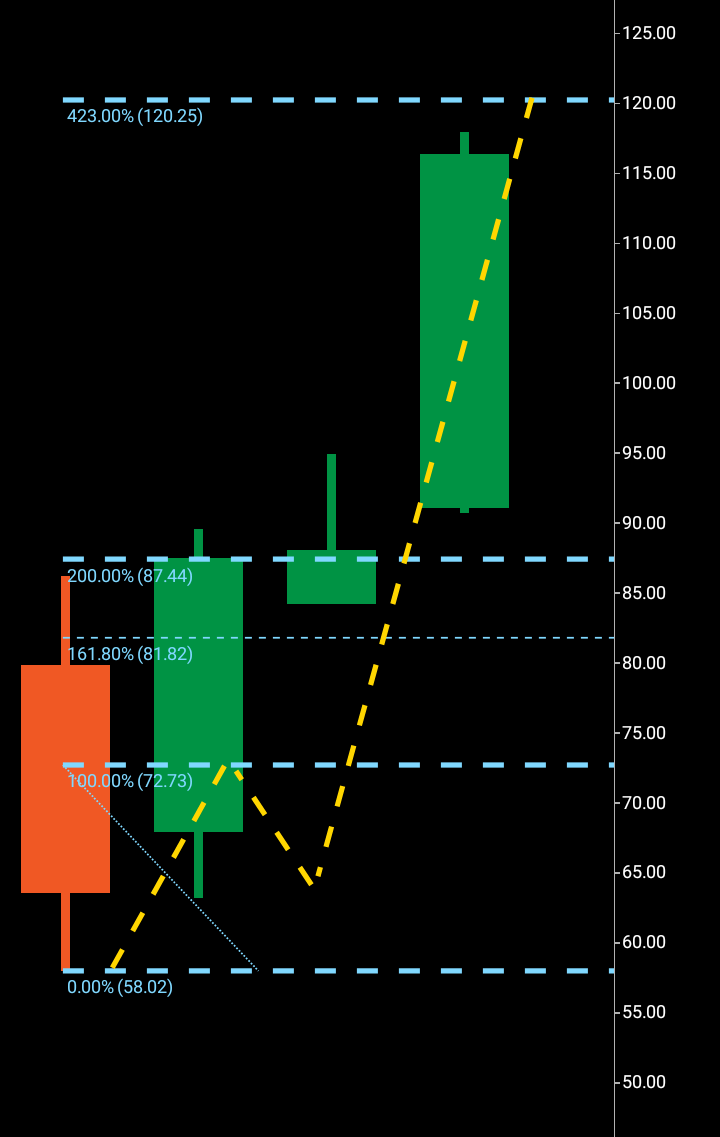
To finalize, Alibaba has seen quite a buy up from $58 climbing through the higher time-frames to the monthly chart looking to create a final three-wave pattern which is the penultimate timeframe to gauge a future price reading from. The share price may continue to climb, it may form the rejection around now at $120. It may not form the monthly rejection at all and drop lower below the $58 region. I have selected hold on a technical basis and will be publishing an updated article with Seeking Alpha should the monthly rejection and third wave breakout form with bullish target.
About the Three Wave Theory
The three-wave theory was designed to be able to identify the exact probable price action of a financial instrument. A financial market cannot navigate it way significantly higher or lower without making waves. Waves are essentially a mismatch between buyers and sellers and print a picture of a probable direction and target for a financial instrument. When waves one and two have been formed, it is the point of higher high/lower low that gives the technical indication of the future direction. A wave one will continue from a low to a high point before it finds significant enough rejection to then form the wave two. When a third wave breaks into a higher high/lower low, the only probable numerical target bearing available on a financial chart is the equivalent of the wave one low to high point. It is highly probable that the wave three will look to numerically replicate wave one before it makes its future directional decision. It may continue past its third wave target, but it is only the wave one evidence that a price was able to continue before rejection that is available to look to as a probable target for a third wave.
Be the first to comment