

Zoom v2022 Dan Rieck
DISCLAIMER: This note is intended for US recipients only and, in particular, is not directed at, nor intended to be relied upon by any UK recipients. Any information or analysis in this note is not an offer to sell or the solicitation of an offer to buy any securities. Nothing in this note is intended to be investment advice and nor should it be relied upon to make investment decisions. Cestrian Capital Research, Inc., its employees, agents or affiliates, including the author of this note, or related persons, may have a position in any stocks, security, or financial instrument referenced in this note. Any opinions, analyses, or probabilities expressed in this note are those of the author as of the note’s date of publication and are subject to change without notice. Companies referenced in this note or their employees or affiliates may be customers of Cestrian Capital Research, Inc. Cestrian Capital Research, Inc. values both its independence and transparency and does not believe that this presents a material potential conflict of interest or impacts the content of its research or publications.
Preparing For A Successful Middle Age
Zoom Video Communications (NASDAQ:ZM) had a baptism of fire in public markets. What was merely an easy-to-use and unusually cash-generative provider of videoconferencing tools in 2019 became a verb sometime in 2020. Pressure indeed. With that came insane rates of growth – peaking at 369% in the Jan-21 quarter vs. the Jan-20 quarter – and a valuation to match.
Here’s the revenue history:
ZM Revenue History (Company SEC Filings, YCharts.com)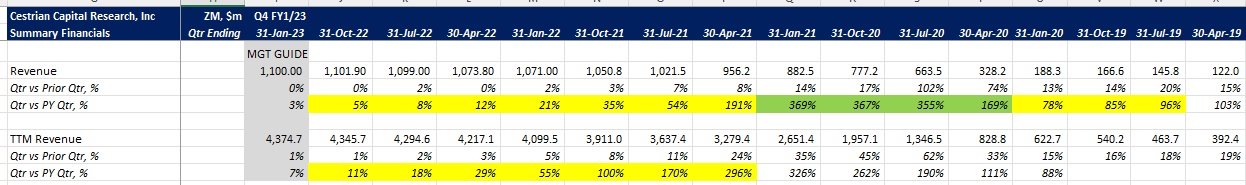
And here’s how its EV/TTM revenue multiple has moved (note, the below chart is to the 31 Jul 2022 quarter only – see below for current valuation multiples, which have dropped further).
ZM EV/TTM Revenue Multiple (YCharts.com)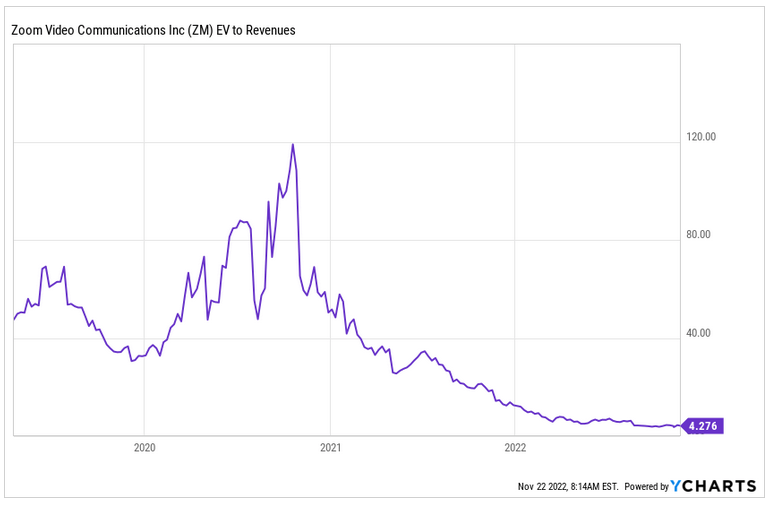
As with many go-go stocks of its ilk, ZM is moving to an earnings and cash flow based valuation as its revenue growth normalizes. This is a painful period in which to own or try to own the stock. Multiple expansion is in essence free money when you can ride that wave – multiple contraction is like being mugged and having that good free money taken right back off of you.
This is why you see charts like this one for pandemic darlings.
ZM vs indices (YCharts.com)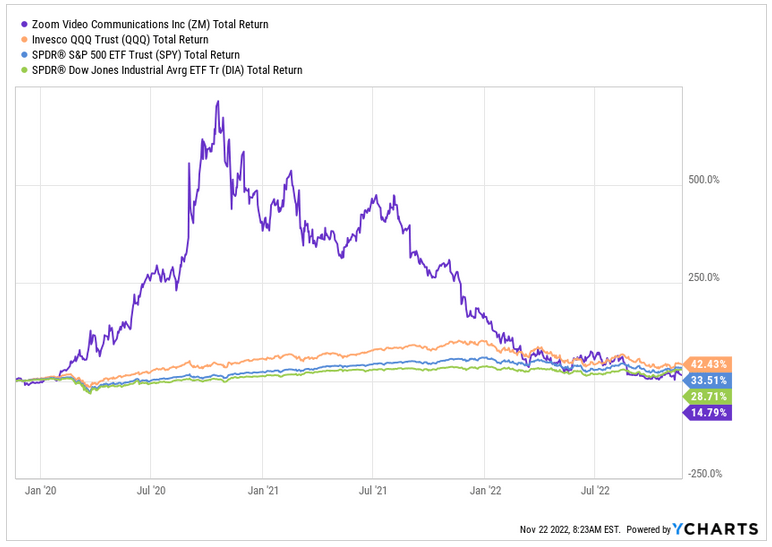
Easy money on the way up – painful lesson on the way down. Overall, if you buy and hold names like this when they are in hypergrowth, you’re deluding yourself. Better to own any of the major indices as you can see (and the chart above excludes dividends – it will be still more damning of ZM if we charted total return).
It’s easy to assume that it’s all over for names like Zoom – that this correction now is the same as the dot-com crash in 2001-2003, or the subprime crash in 2008-2010. And for some pandemic darlings, that’s undoubtedly the case. Those whose business models no longer make sense or cannot be made to scale or run economically. Where free money and lots of it is the only source of viable ignition for the stock. As always, though, in investing, it’s wise to not assume something is the case, not to merely follow the crowd, but instead to do your own work and reach your own conclusion.
Here’s our view on Zoom. In essence:
- Growth is flat now, compared to an insanely high growth comparable prior period, but as time passes, growth rates ought to tick up to 10%-15% on a sustainable basis. Using remaining performance obligations as a long-run indicator, right now RPO (the total value of customer contracts which have been signed but not yet delivered) is growing at some 32%; RPO represents 75% of TTM revenue; and around two-thirds of the RPO is expected to be recognized as revenue in the next twelve months. The relationship between RPO growth and recognized revenue growth is non-linear, but generally speaking, a company growing its contract book like this isn’t going to see growth at zero for very long.
- Cash generation remains strong, albeit the company’s skill in managing working capital has gone awry for a couple of quarters recently. Unlevered pretax FCF margins are down from a peak of 45% in late 2020 to a current 20%, both on a TTM basis. Margins could fall further, of course, but we think 15%-20% cash flow margins at a revenue growth rate of 10%-15% is long-term viable.
- The balance sheet remains a fortress, with over $5.5bn of net cash on hand – no debt whatsoever, we might add.
So as time passes we expect the fundamentals to normalize into a solid, Steady-Eddie, cash-generative software/services business. That’s not a company whose stock is going to trade at a gazillion times revenue – but it’s capable of trading at above the current multiples and with faster growth too – so we may see some multiple expansion and some improvement in the thing that the multiple multiplies.
Here are the numbers up to and including the quarter reported yesterday after the close.
ZM Fundamentals (Company SEC Filings, YCharts.com)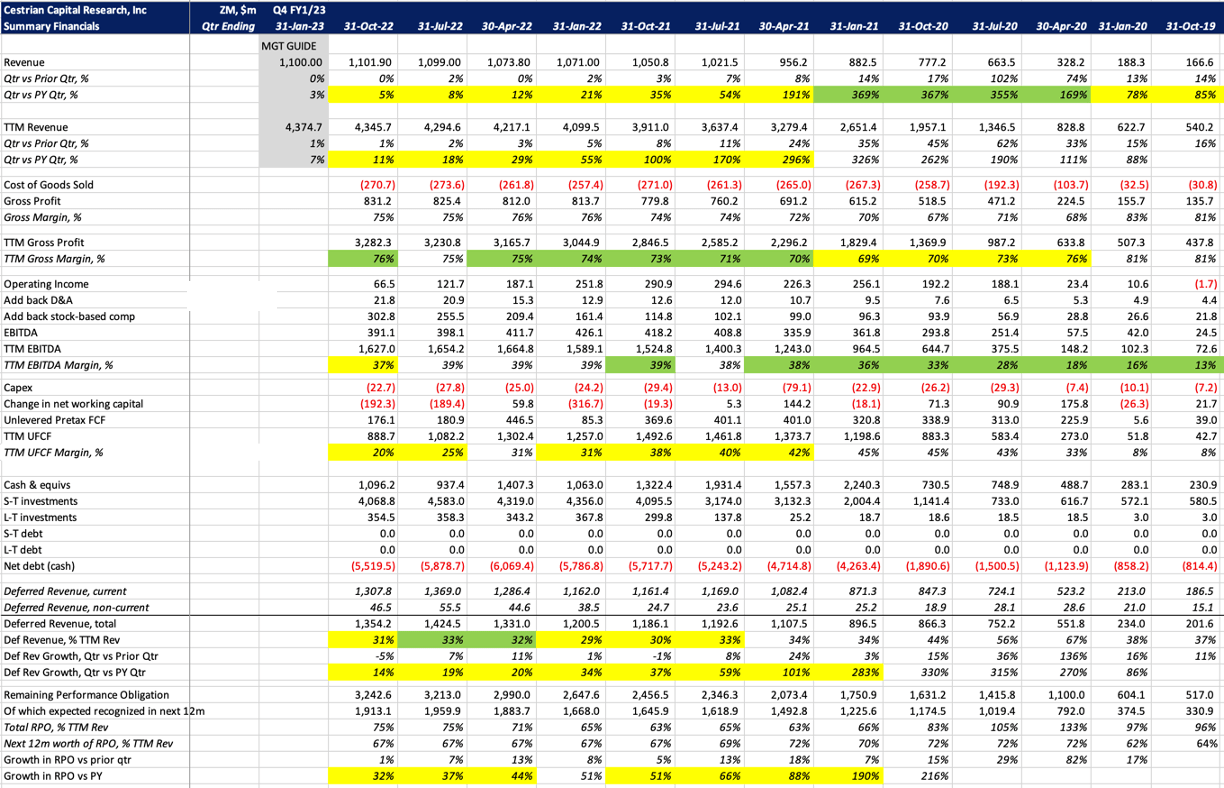
Valuation:
ZM Valuation (Company SEC filings, YCharts.com)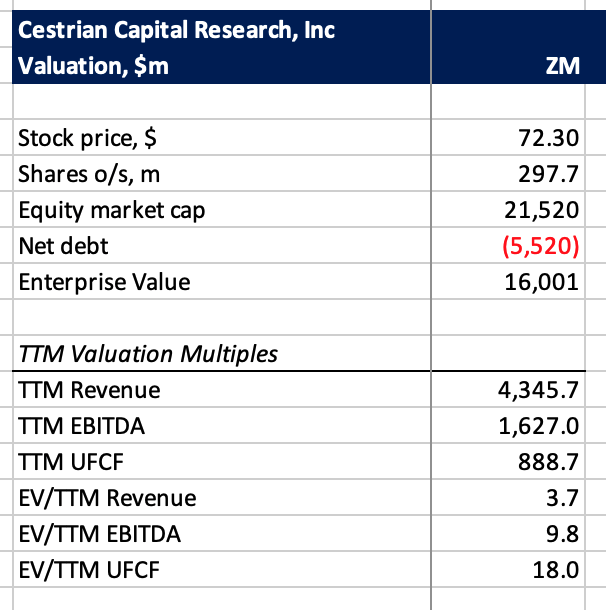
The cash flow multiple is elevated by that working capital outflow. Care needed here in case that turns out to be bad debt. For now, we are just watching.
And now the stock chart. To our old and tired eyes, this looks very much like institutional accumulation is going on at the lows. The volume x price chart (the horizontal bars on the right-hand side) has its clock started at the all-time highs, so the volume shown there is only that which has traded since those highs. Stock traded down here at the lows is only post slide, none of it dates to the 2019-2020 period when the stock was last at this level. That’s a lot of volume-changing hands right now, and whoever is doing the selling, that’s not Chad doing the buying. So we believe that ZM is under slow accumulation today, in anticipation of the developments we lay out above (none of which are rocket science of course, and indeed are well known to longtime software/services investors as What Happens When Former Rock Star Growth Stocks Become Middle-Aged).
You can open a full-page version of this chart here.
ZM Chart (TrendSpider, Cestrian Analysis)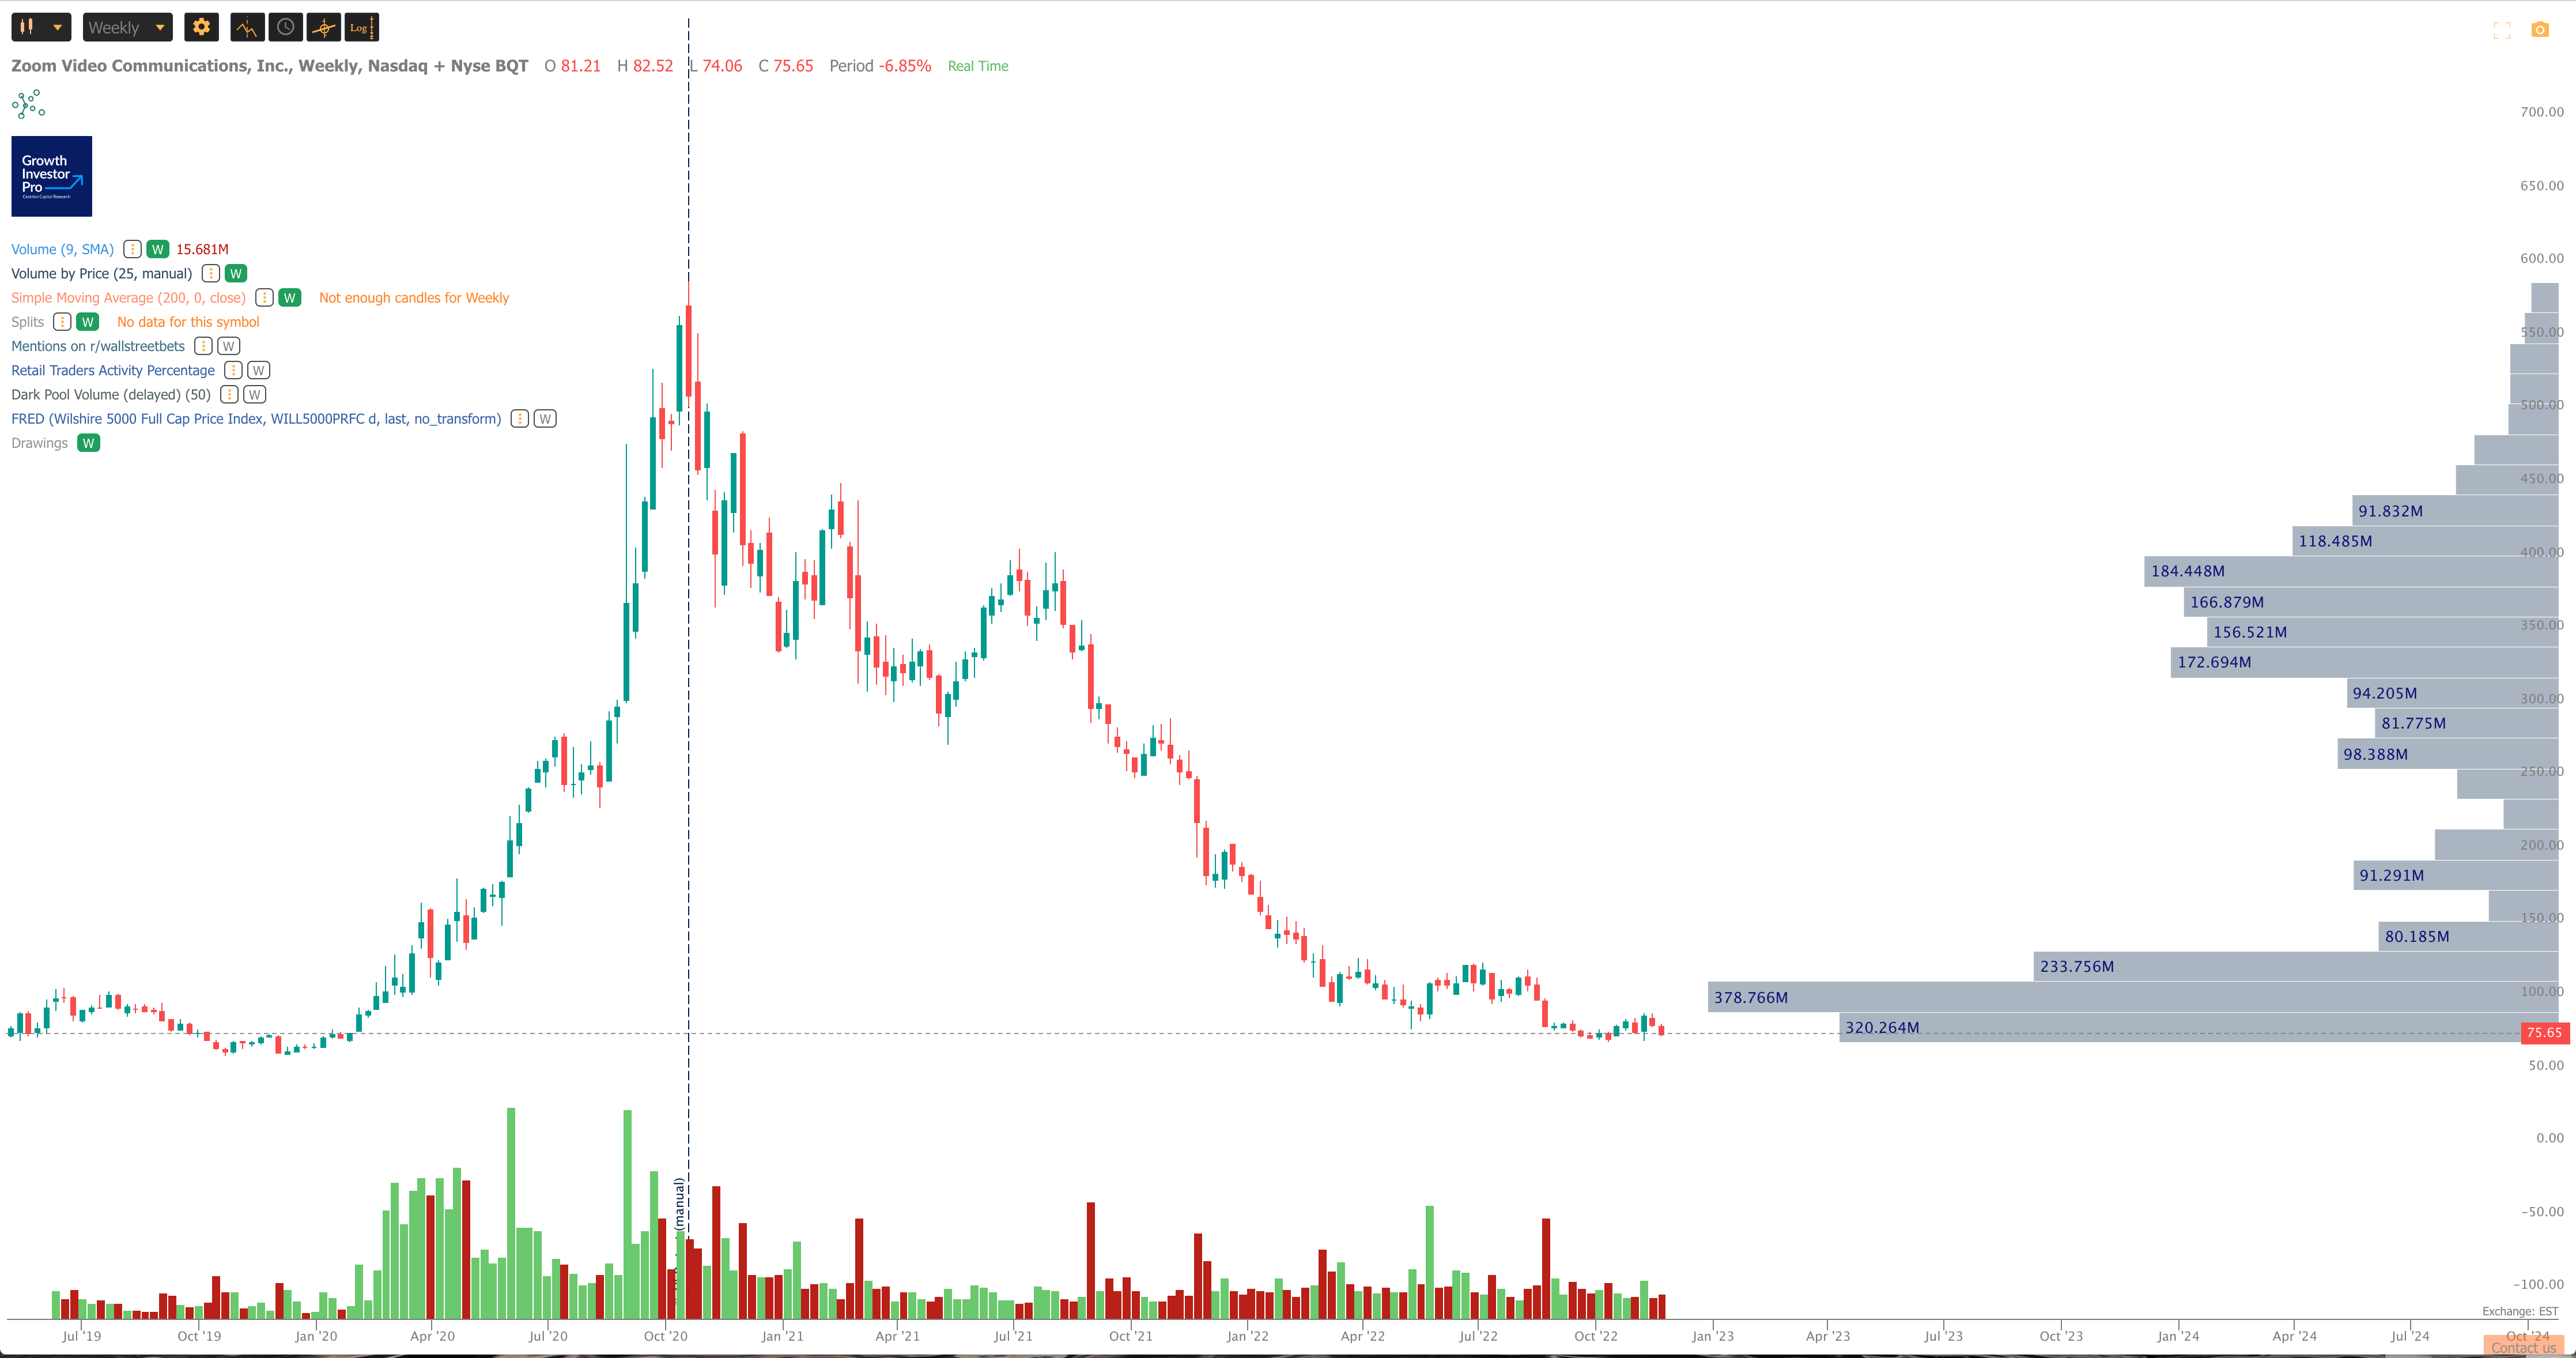
Hold rating for now because there’s likely no burning reason to buy today, but we believe a slow accumulation strategy can be rewarded here, if you’re patient – as patient as Big Money. Which is one of the ways they got to be Big Money, by the way.
Cestrian Capital Research, Inc – 22 November 2022.
Be the first to comment