

mphillips007/iStock via Getty Images
The S&P 500/SPX (SP500) closed another relatively bearish week. We are now bouncing around critical support at 3,900. This level is significant; if a decisive breach pierces this crucial support point, the market can go substantially lower. Perhaps more importantly, the bearish technical setup is supported by a decelerating growth environment and a progressively worsening fundamental image.
Therefore, there is a remarkably high probability that the market can continue moving lower intermediate term. The next significant point of entry target for the SPX is around a possible double bottom in the 3,600 range. However, the SPX can slide to new lows in a slightly more bearish scenario, making the next reasonable buy-in target around 3,000 SPX.
SPX 1-year chart
SPX (Stock Charts)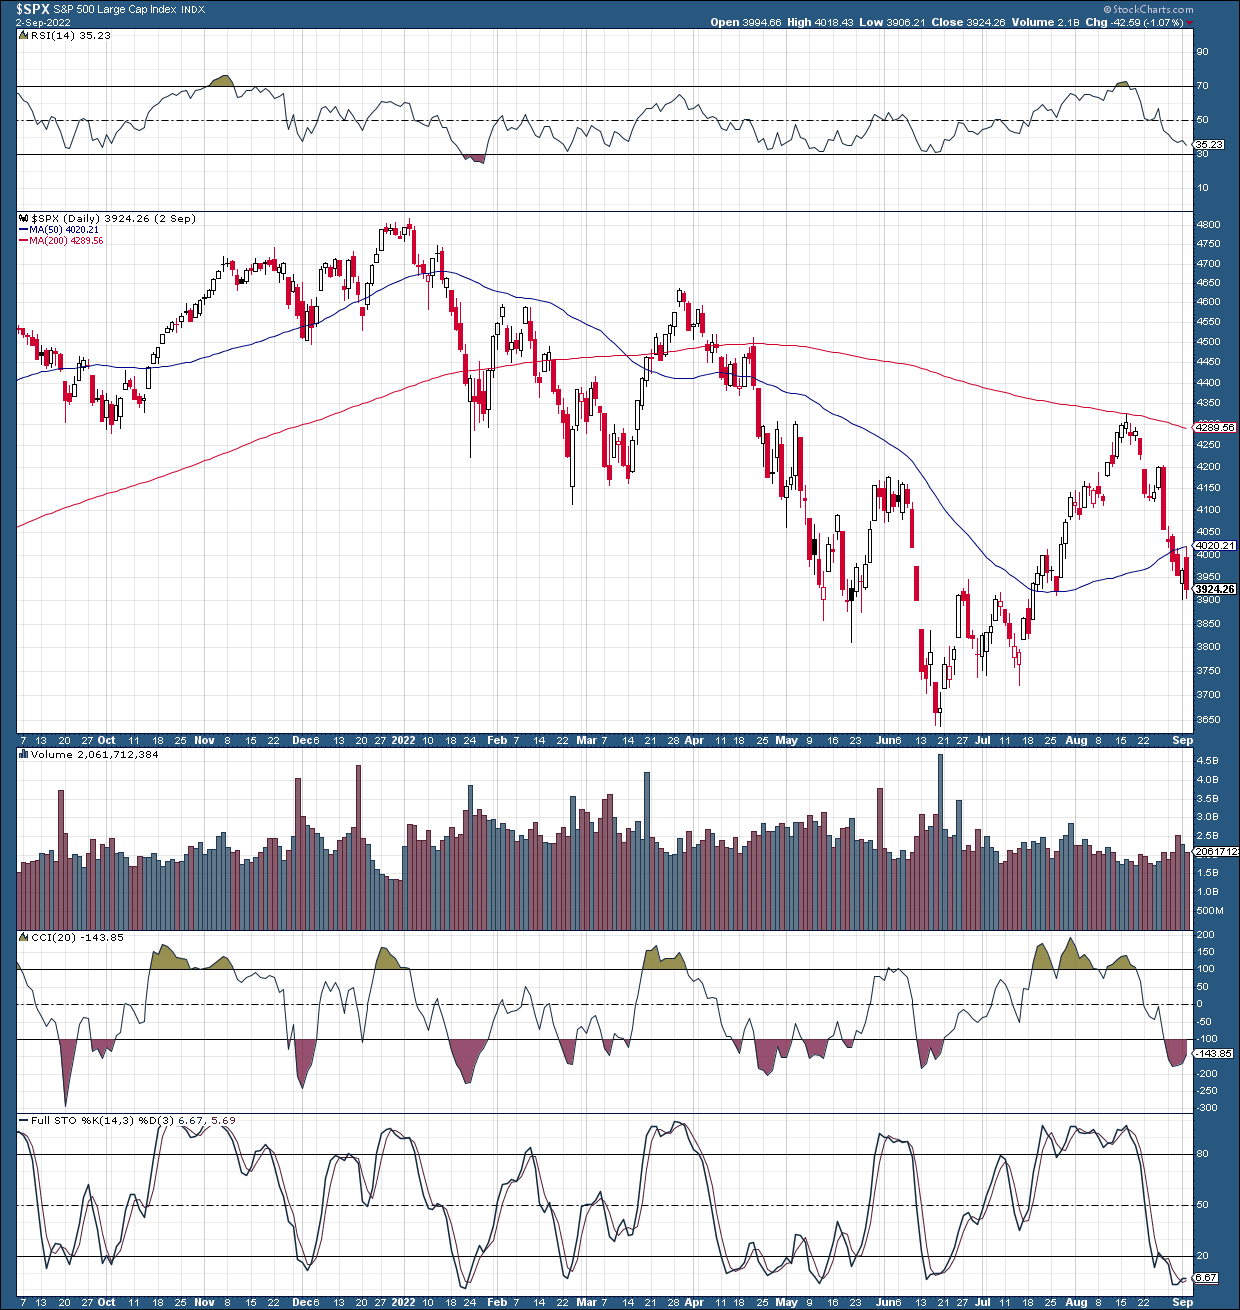
The chart is relatively negative here, and SPX could stumble to new lows. We see a distinct head and shoulders pattern forming now, and if the critical neckline support gives out at 3,900, SPX could fall precipitously. Also, notice that the SPX is not anywhere near being oversold yet. Typically, we identify several telling factors in these technical bear market tops and subsequent selloffs.
When buy interest momentum ran out, more people began taking profits (mid-August). Then, there was an attempt at a rally around a near-term support level. However, this bear market rally attempt failed as most buying interest had gotten exhausted. Then, we saw an exciting phenomenon as the hedging and the shorting came in. This dynamic is what we witnessed post the Jackson Hole Fed event. In the subsequent decline stage, we should see the combination of advanced hedging and shorting along with increased selling, likely even more so by retail investors.
This bearish phenomenon may last several more months, but there is a threat of having a more prolonged decline. My base-case bear market bottom target remains 3,000 SPX, roughly 23% lower than current levels. However, the outlook for an eventual bottom during a more extensive bear market drop is in the 2,400-2,800 range, roughly 28-38% lower from here.
Thankfully, we have probabilities:
- A hold at 3,900 support – 15%
- A temporary double bottom around 3,600-3,700 support – 25%
- A drop to the 3,000-3,400 range – 35%
- An overshoot to the 2,800-2,400 (longer-term bearish case) level – 20%
Note: Probabilities are based on numerous factors, including fundamental, technical, and psychological analyses.
Now, Let’s Get Down To The Fundamentals
At Jackson Hole, the Fed made it quite clear that the easy ride had ended. We have a remarkably complex inflation problem in the U.S. and globally, and there is no way to resolve it without significant monetary tightening. The Fed made it abundantly clear that the increased interest rate environment, slower growth, and a weakening labor market would bring pain to households and businesses. That’s all still to come!
Inflation CPI Data: 25-Years
CPI Inflation data (Trading Economics)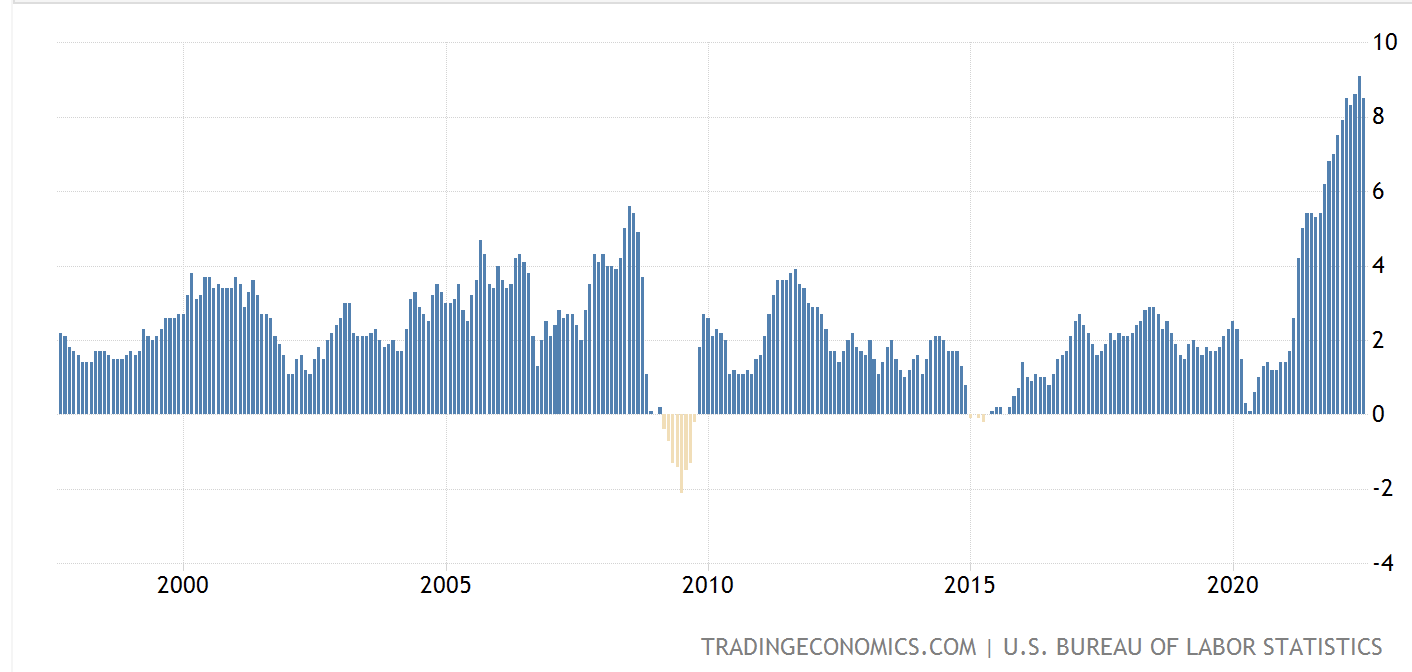
Inflation is hovering around 8-9%, and there is no guarantee that it will be significantly lower soon. If investors are waiting for the normalized inflation rate to reach 2% any time soon, many could be in for a rude awakening. We have not seen anything near this level of inflation since the very early 1980s. Also, things were much better than in many respects. General debt levels and leverage were considerably lower, and the economy hadn’t been addicted to an ultra-low-rate economic environment.
Now, we see that all the easy money expanded over the last 20 years is showing up in massive inflation. This truly is a problem no Fed has faced before. Yes, Paul Volcker battled similar inflation in the 1970s and 1980s, but the Fed Chair raised the benchmark to 20%. What is the Fed going to do now? The benchmark will be around 3% after the next meeting, but how will it bring down inflation hovering around 9%?
Fed Funds Rate: Long-Term
Fed benchmark (Trading Economics)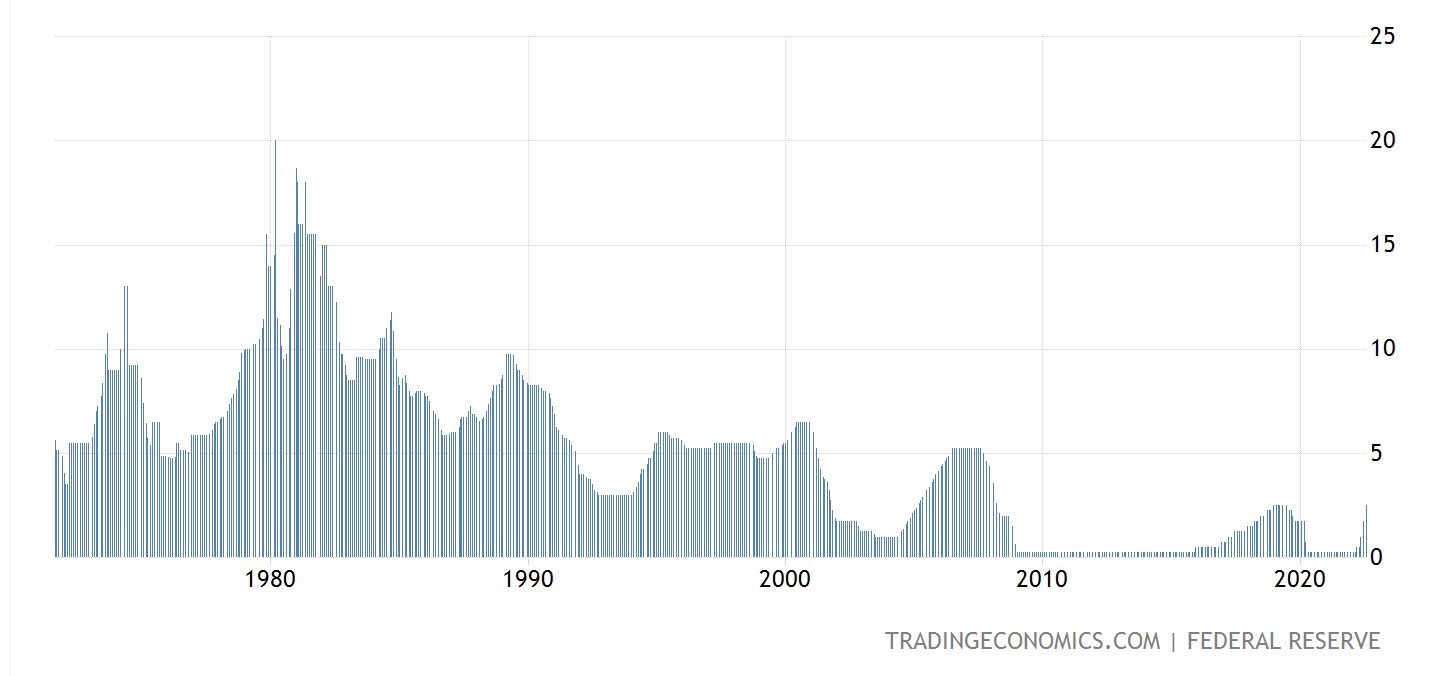
Due to the unprecedented inflation dynamic, the Fed may raise rates for longer and higher than in past cycles and previously anticipated. It’s plausible that the Fed funds rate may reach 4.50-5% or higher before we see a meaningful decline in inflation. The market is not pricing in such a regressive rate path and should react increasingly negatively as reality gradually sets in.
The Labor Market Is Slipping
Jobs report (Investing)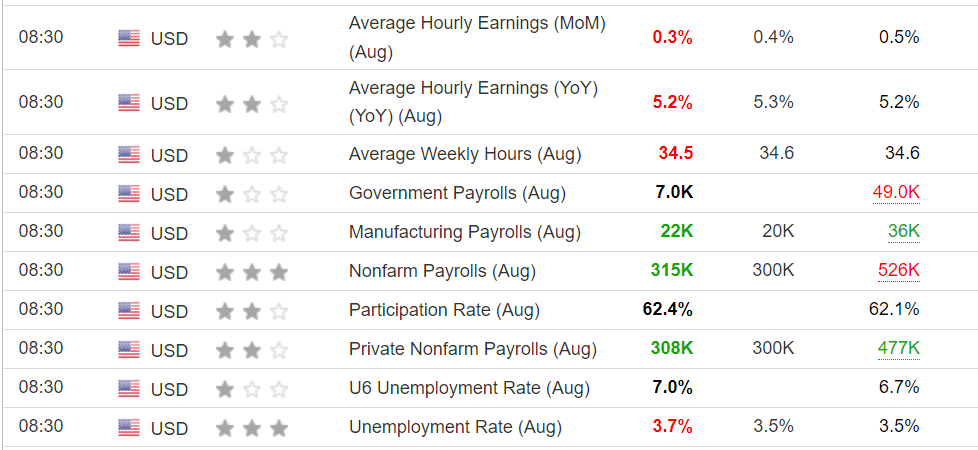
One of the most telling statements out of Jackson Hole was that the Fed is essentially prepared to tolerate a softer jobs market to bring price stability and inflation back to acceptable levels. This dynamic suggests that the Fed will remain relatively hawkish despite the probability of a worsening jobs market in the near term. While nonfarm payrolls came in roughly in line, the unemployment rate ticked up to 3.7%. While this “unexpected” rise may not be a cause for concern yet, we may be entering a trend of higher unemployment. Additionally, average hourly earnings missed estimates, implying that employees are not seeing the kind of pay rises consistent with inflation. This phenomenon should continue weighing on consumer confidence and spending, probably worsening in the coming months.
Perhaps most importantly, this jobs number wasn’t bad, goldilocks material even, and the market failed to rally. This dynamic implies that the market will have difficulty rallying due to inline or slightly better than expected data. On the contrary, now that the Fed is taking the punch bowl away, bad news will be regarded as bad news again. Therefore, the market should see more data-driven selloffs in the coming months. Previously, when we received poor jobs or other vital economic results, the market had the Fed put from support. Well, no more. The party is over, and we may see a whole new ball game for equities from here.
The Bottom Line: More Pain Ahead
The Fed will continue raising rates relatively aggressively and implementing other tightening measures like QT. The increasingly tightening monetary atmosphere will continue weighing on consumer confidence, corporate profits, economic growth, and equity prices. Valuations remain elevated and probably need to decrease more before the bear market ends. We also need to consider lower than anticipated earnings, growth and earnings declines, and worsening EPS estimates as the tightening cycle intensifies.
Shiller P/E Ratio
Shiller P/E (Multpl)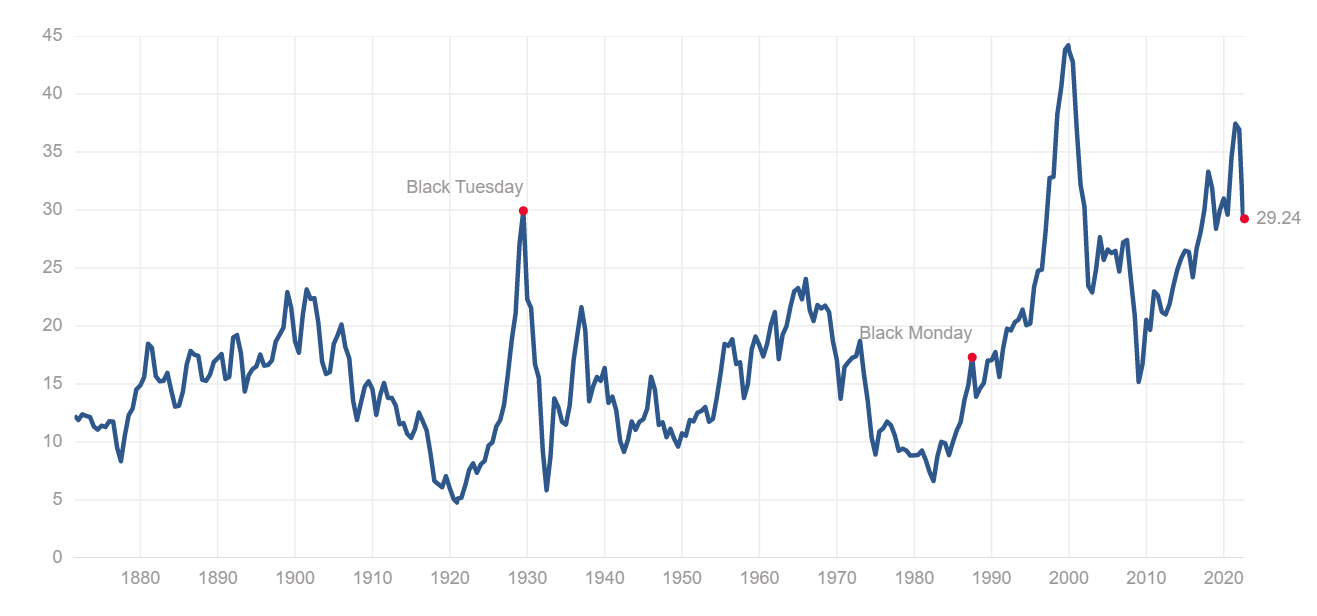
While the Shiller P/E came down to around 29 recently, stocks likely need a more significant reset valuation-wise. The economic environment has switched to a much tighter atmosphere, and the Fed is not likely to “pivot” or stop tightening soon. Therefore, we can expect to see lower levels in the S&P 500 and stocks in general as we advance into the fall months. My base-case bear market bottom target remains 3,000 SPX, but we may see a more extensive drop into the 2,400-2,800 range in a more bearish case outcome.
Be the first to comment