


Almost everything soared today.
peepo
Get ready for charts, images, and tables because they are better than words. The ratings and outlooks we highlight here come after Scott Kennedy’s weekly updates in the REIT Forum. Your continued feedback is greatly appreciated, so please leave a comment with suggestions.
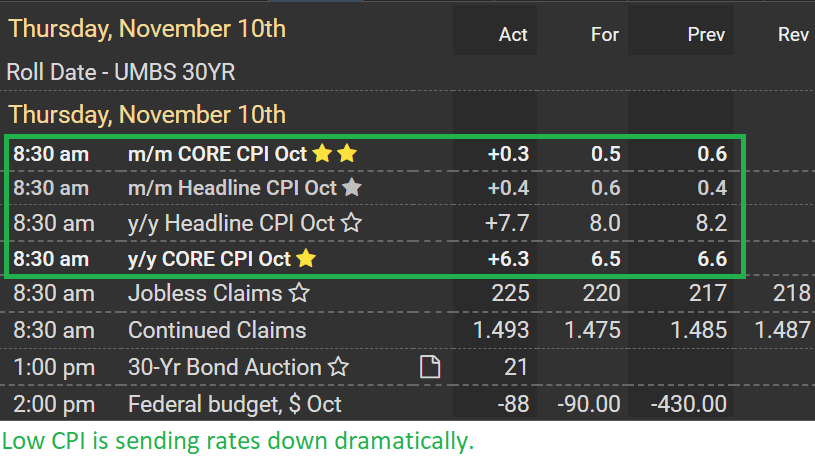
Just a quick update for readers on today’s massive rally. This rally is on CPI (Consumer Price Index) readings coming in lower than expected:
MBS Live
While those headline numbers for inflation still look high, we’ve seen 4 consecutive months where the month-over-month reading came in low. Excluding shelter, CPI came in just under 0.2%. That leads to about a 2.3% annualized rate.
Clearly, 2.2% is vastly below the 7.7% year-over-year metric investors are seeing in the headline figure. However, the monthly figure there of 2.2% is actually the highest reading in the last 4 months.
How Terrible is CPI: Shelter?
CPI: Shelter came in with a reading of 0.8% month-over-month. Just how terrible is that reading?
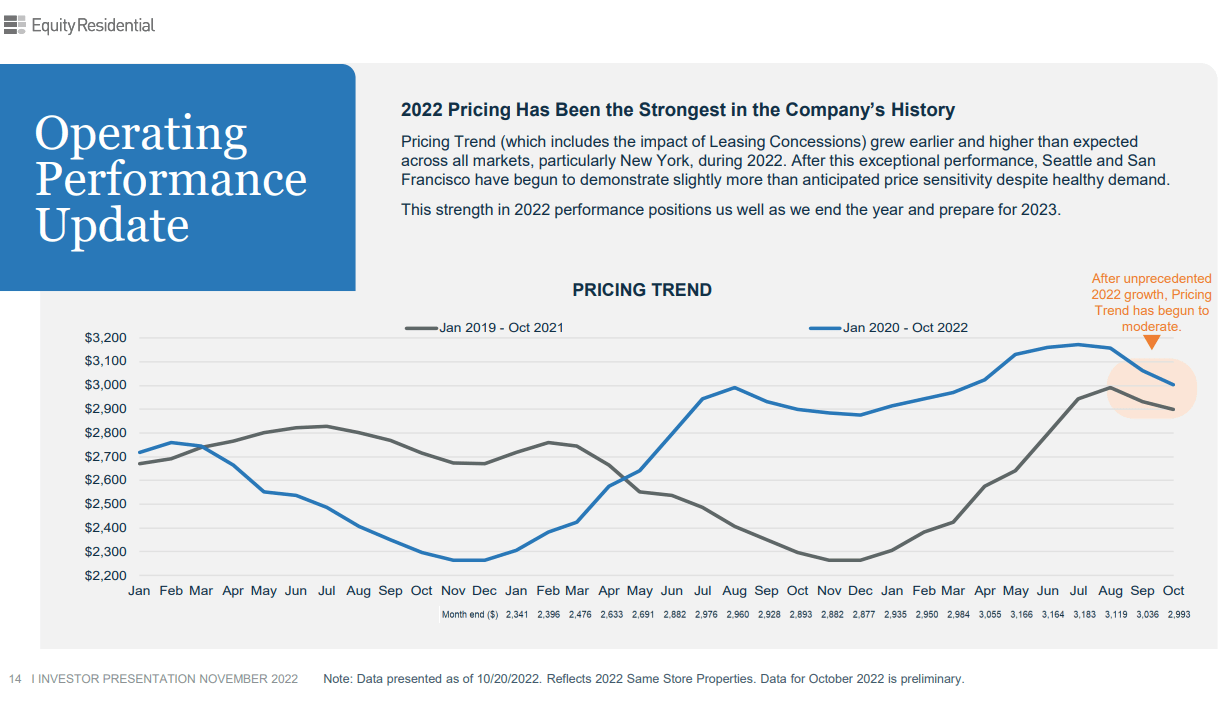
I’ll let Equity Residential (EQR) explain:
Equity Residential Investor Presentation
You’ll notice that market rents as determined by the rate on new contracts are dipping. Down from a high of $3,183 for July to $2,993 in October.
Some people might be inclined to think this is just EQR, but it is not. Wharton Professor of Finance Jeremy Siegel hammered that lesson on inflation home:
If you put the actual home and rental price and index in… you get negative core inflation.
Annualizing Four Months
On a “seasonally adjusted basis”, the rate of inflation excluding shelter would come in at less than 0.2% on an annualized basis.
Without the “seasonal adjustment”, the rate of inflation excluding shelter would come in at negative 1.1% on an annualized basis.
By all accounts, we had substantial growth in market prices for goods, services, and rents prior to July. Since then, the growth rate flopped and the only thing keeping it afloat is using year-over-year comparisons and including the lagged value for “CPI: Shelter”.
He says the Federal Reserve should just be sticking with rates as they are, but projects they will go with a 50-basis point hike anyway.
Plunging Rates
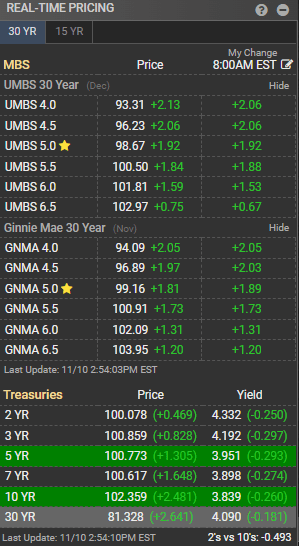
Mortgage rates are falling with MBS (mortgage-backed securities) prices soaring.
MBS Live
While MBS prices are rising substantially, Treasury yields are also soaring higher. That’s a mix of positive and negative factors. Spreads are still very wide, though the magnitude of spreads will also depend on how you read them. Some investors use OAS (option-adjusted spreads) to account for volatility and some use a zero-volatility spread. Each method has advantages and disadvantages.
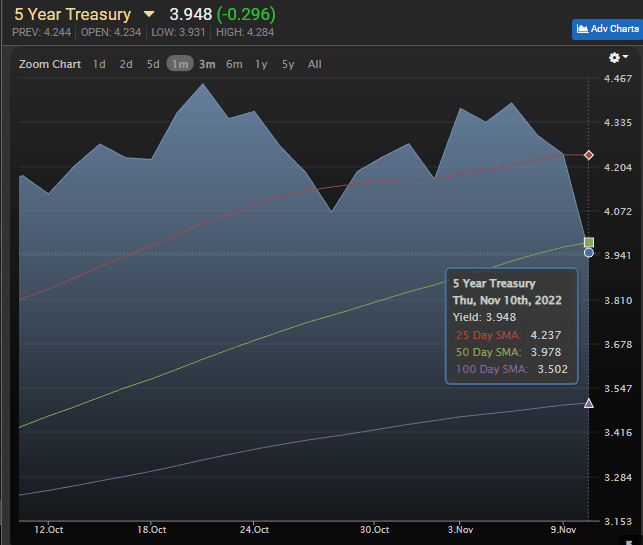
Looking at the trends in bond yields, we can see the 5-year Treasury just broke below the 25-day and 50-day moving averages:
MBS Live
That’s a big drop.
Falling rates reflect investors thinking the Federal Reserve may get the picture. A reduction in rate hikes would help the economy, though so far, the Federal Reserve has been intent on declaring they would continue pushing rates higher.
We went into greater depth on the market in our subscriber update.
Bearish Outlooks
I’ll run through a few of them very briefly.
Bearish on ARMOUR Residential REIT (ARR). While the movement in rates today may have been positive, shares trade at a material premium to projected BV from the end of last week. Even if the REIT had a good day for BV, it would be unlikely to offset the share price. As it stands ARR’s market cap isn’t particularly large. Time for a share offering? Shares are already 31.5% off their lowest close, which was just one month ago.
Cherry Hill Mortgage (CHMI) is in a similar position except it barely has a premium to the estimated book value from the end of last week. However, CHMI is pretty small and a share offering would give them a larger equity base to spread their overhead costs across. Probably not what shareholders want to hear given the decline in either of these names. Bearish on CHMI also. Shares are up 26.5% from their lowest close, which was also one month ago.
Two Harbors (TWO) lands on the list for a pretty high price-to-book as well. Spreads between MBS and Treasury rates are still wide, which is favorable for investing the proceeds from an offering.
If investors expect those spreads to narrow, they may want to consider other REITs at much larger discounts. Another bearish outlook for TWO. Shares are up 34.2% from their lowest close. Like the others, it was precisely one month ago.
To be clear, the substantial majority of the mortgage REITs set their 52-week lows on 10/10/2022.
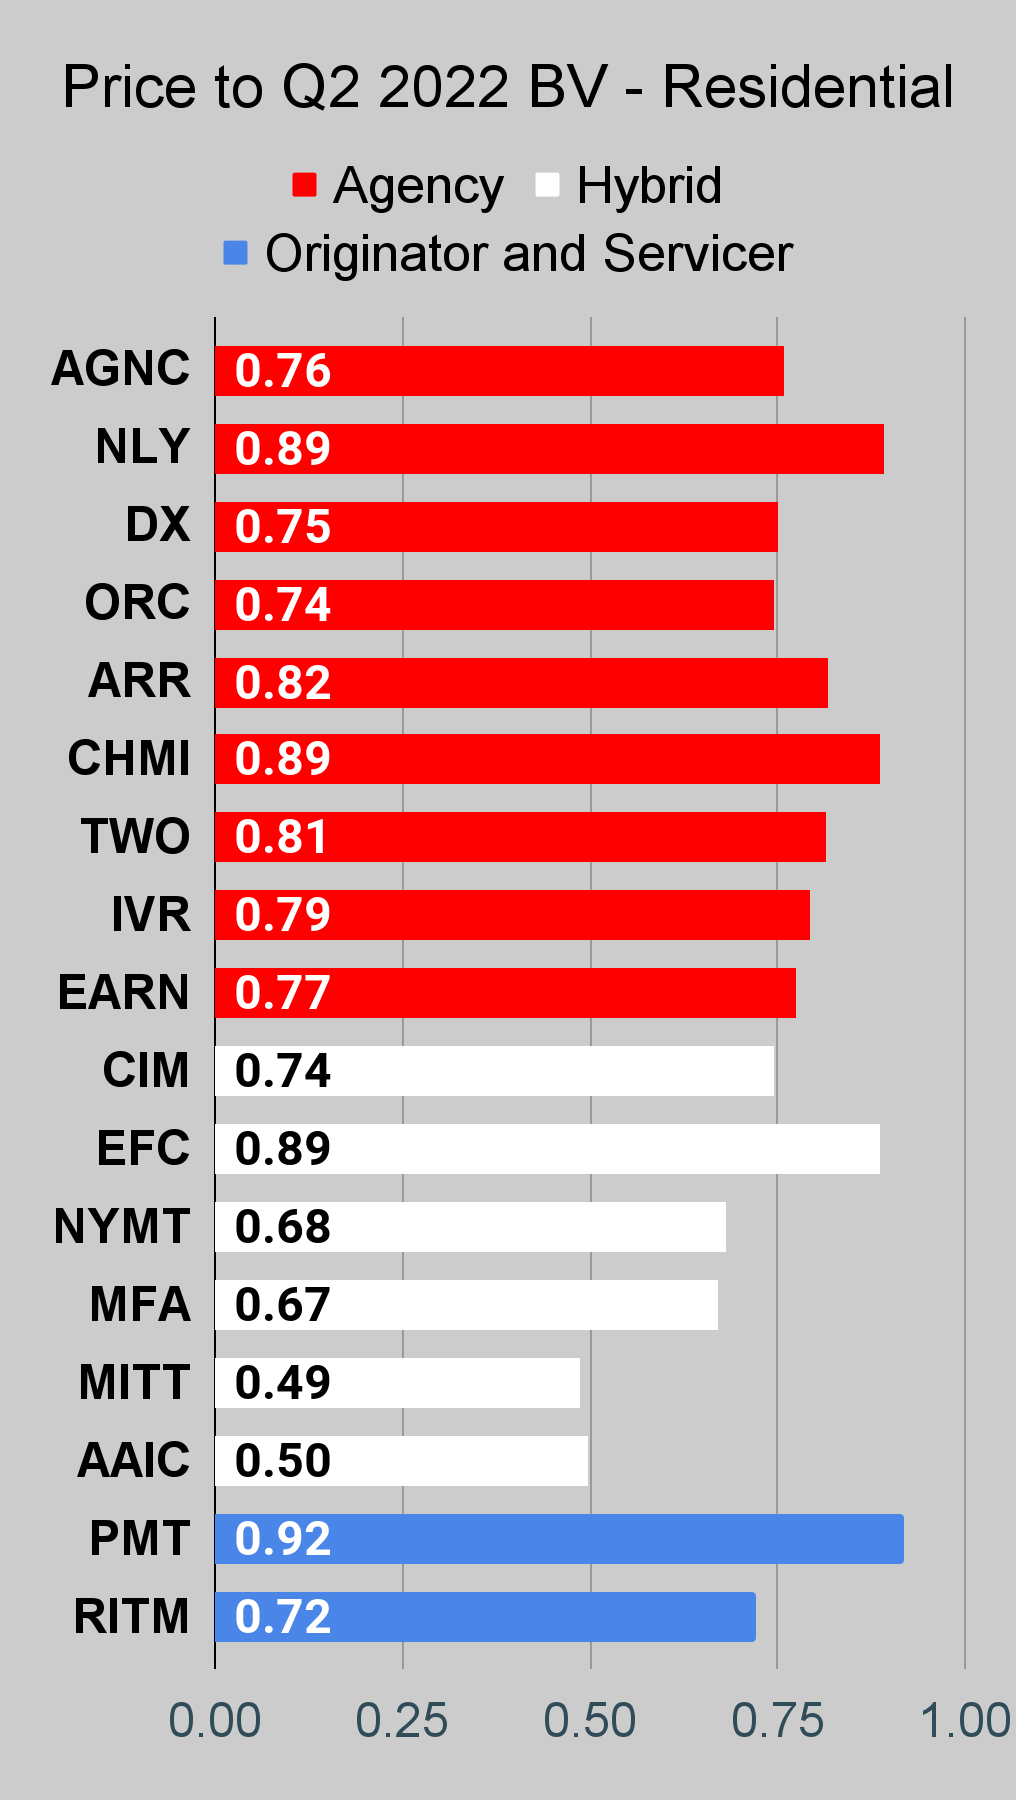
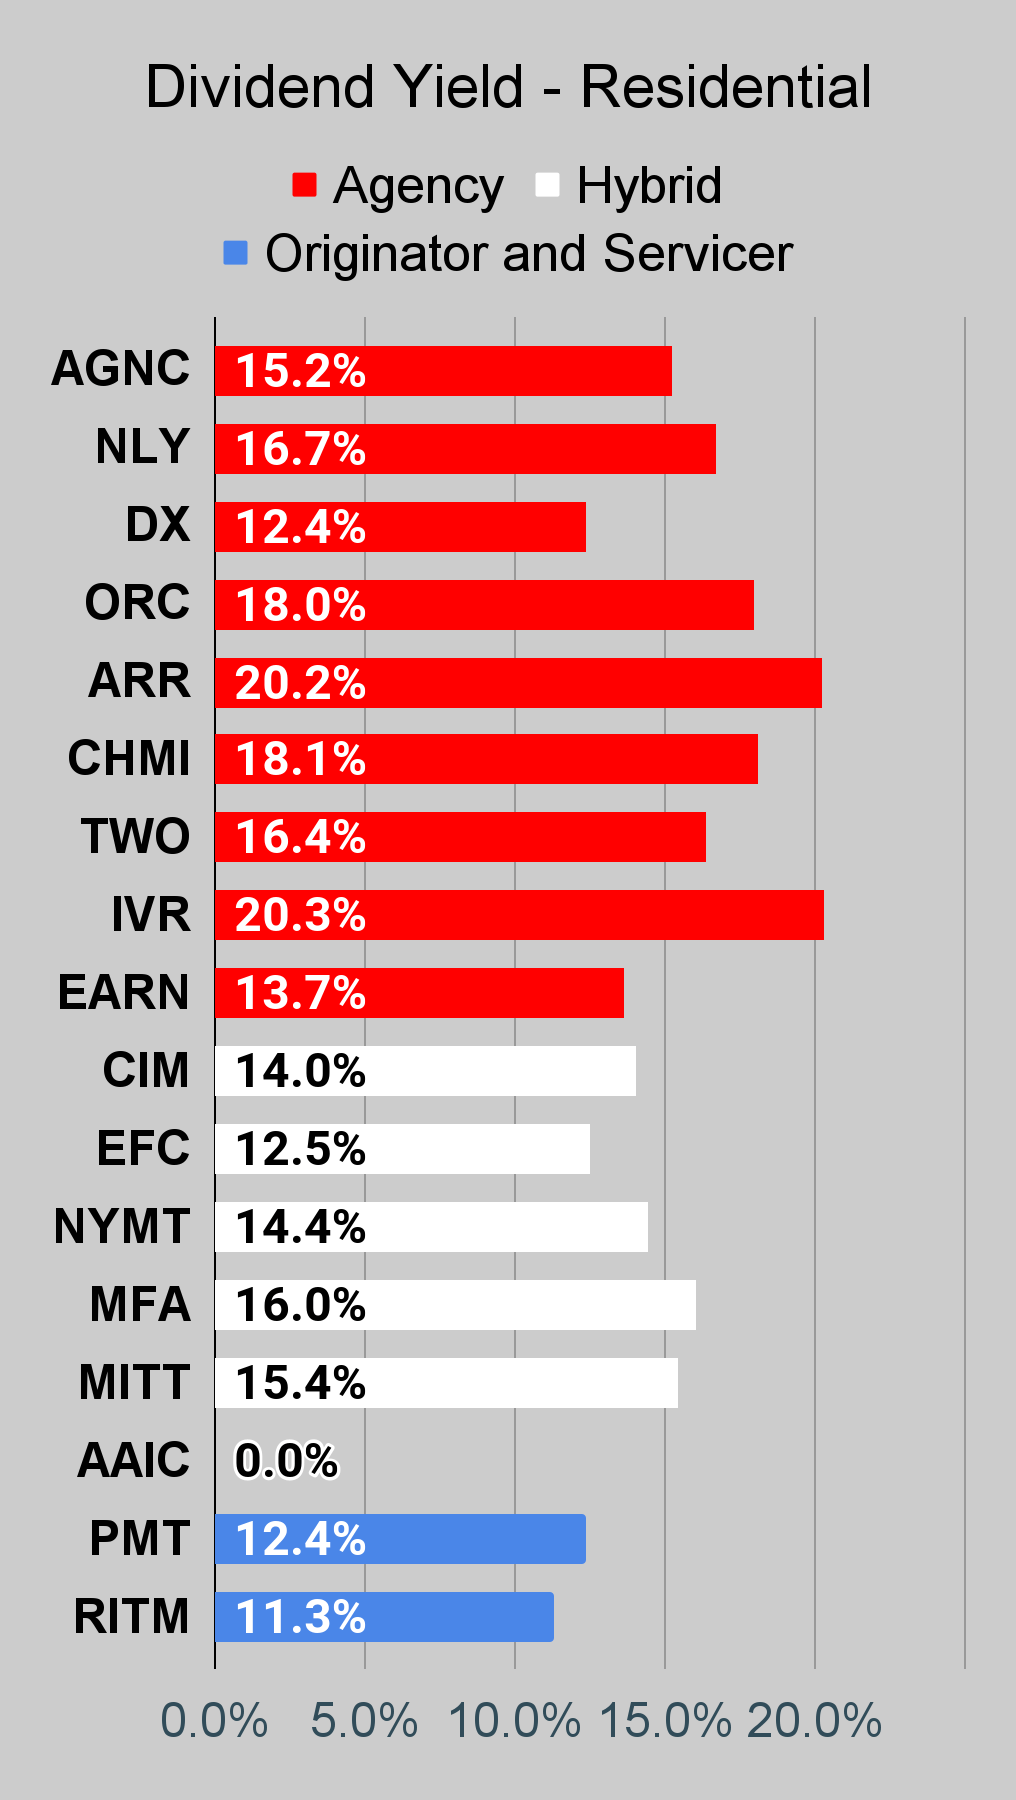
Looking at these REITs by dividend yield, it was 20.2% for ARR, 18.1% for CHMI, and 16.4% for TWO. I cannot stress enough that investors should be focusing on the price-to-book ratios rather than being blinded by the dividend yield. The dividend yield is looking backwards at the prior dividend while book value is giving you information about the current value within the portfolio.
Bullish Outlooks
Moving over to shares where we can get bullish, I’ll highlight AGNCP (AGNCP). Shares have rallied respectively off their 52-week low, but still offer a significant value to investors. You might think that if the Federal Reserve stops raising rates and even cuts rates, that would surely be a disaster for investors in AGNCP. However, AGNCP actually traded above $25.00 for quite a while with the Federal Funds rate around 0% and long-term Treasury yields closer to 1%:
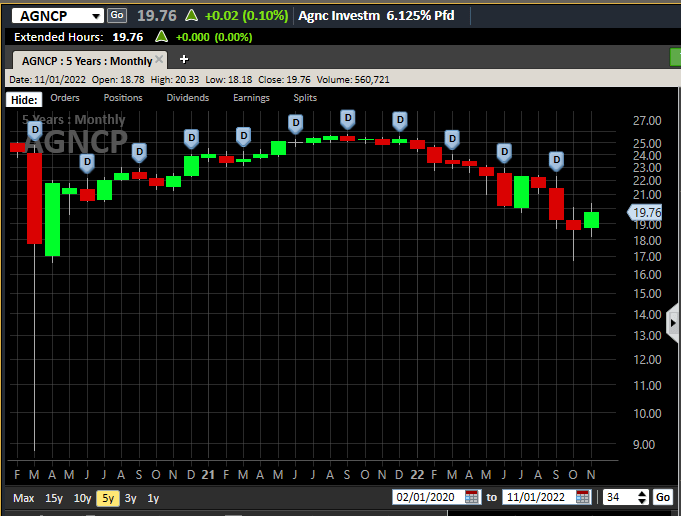
Street Smart Edge
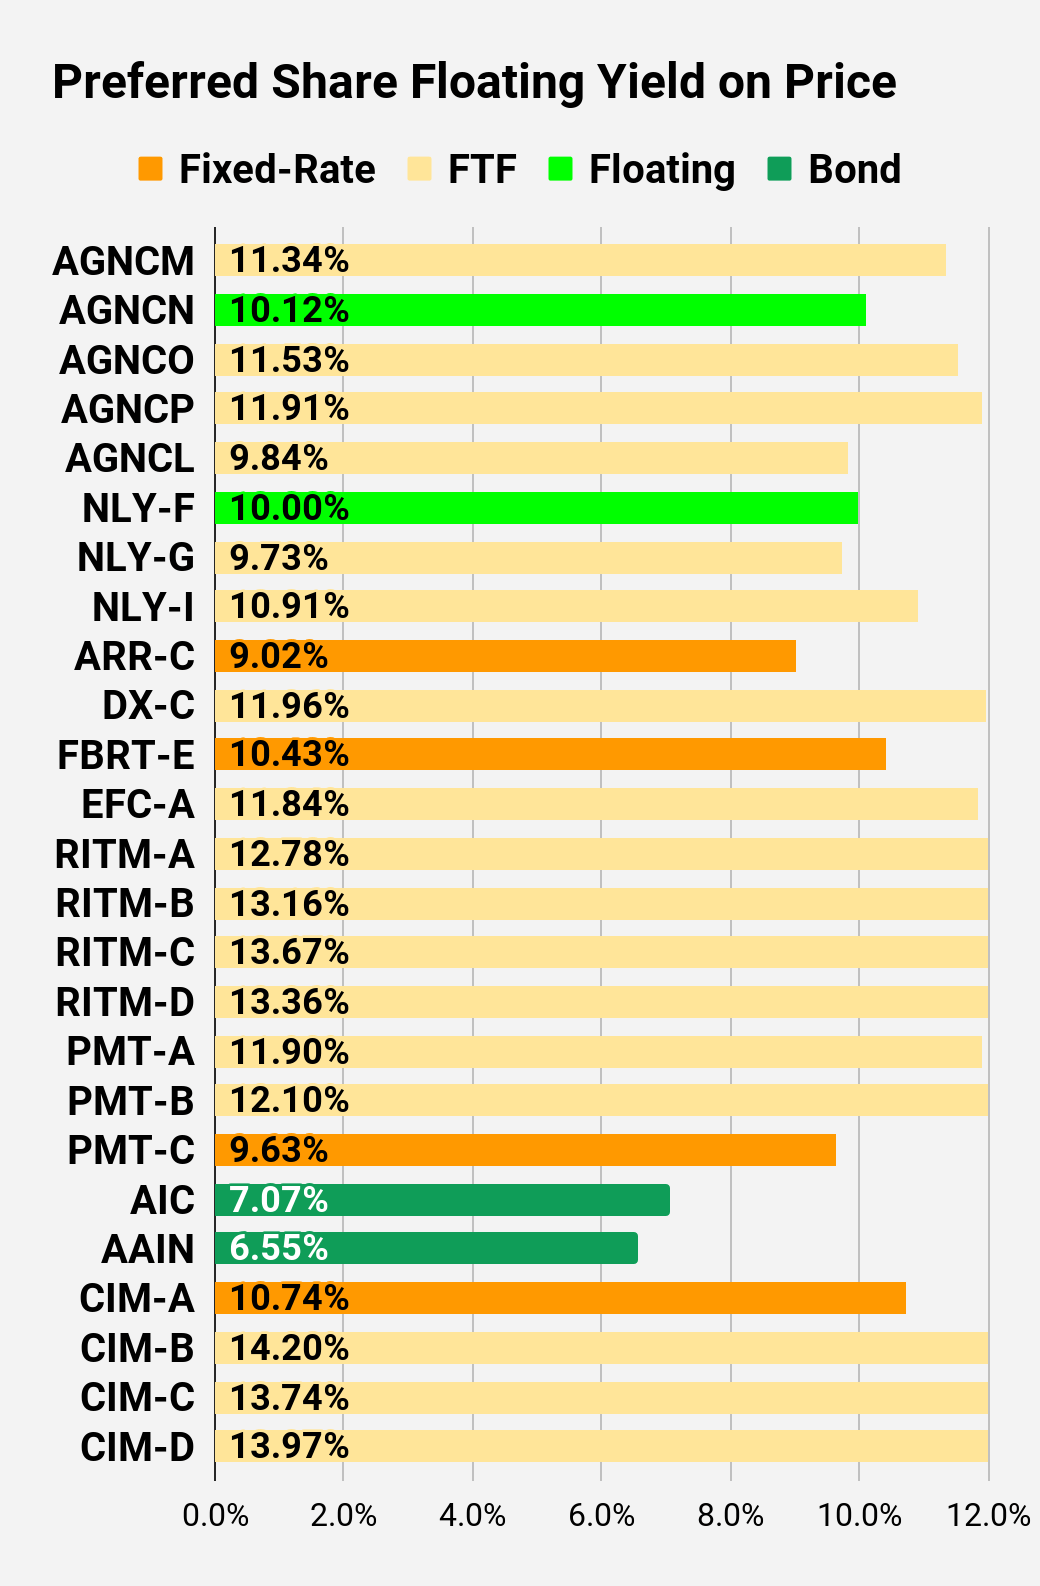
Each bar in the chart represents a month. It wasn’t until rates started increasing significantly that AGNCP went back under $24.00. So, arguments that AGNCP would be doomed if short-term rates fall just don’t hold much weight. Shares carry a 7.82% yield today. If short-term rates remain exactly where they are, then the yield (on today’s stripped share price) would increase from 7.82% to 11.91%.
What if you really expect those short-term rates to come down though? Then you should look at PMT-C (PMT.PC). Shares carry a 9.63% stripped yield and have a fixed-rate dividend. At $17.86, they also have massive upside if interest rates decline.
With most of the earnings reports released, I’ll be updating the tables for this article series soon to use the Q3 2022 book values. The tables below still use the Q2 2022 book value. We cannot mix Q2 2022 and Q3 2022 book values because it would make the values even more distorted. When I get the new tables set up to use the Q3 2022 book values (should be Friday), I’ll link them in a comment and pin it at the top of the comment section.
That’s an important update because many of the mortgage REITs saw dramatic decreases in book value during Q3 2022. If those spreads tighten (as they should eventually), it could drive book values higher. However, too much volatility in interest rates creates other headwinds for the mortgage REITs since plunging rates would cause prepayments on the newer (higher coupon) MBS.
Stock Table
We will close out the rest of the article with the tables and charts we provide for readers to help them track the sector for both common shares and preferred shares.
We’re including a quick table for the common shares that will be shown in our tables:
Let the images begin!
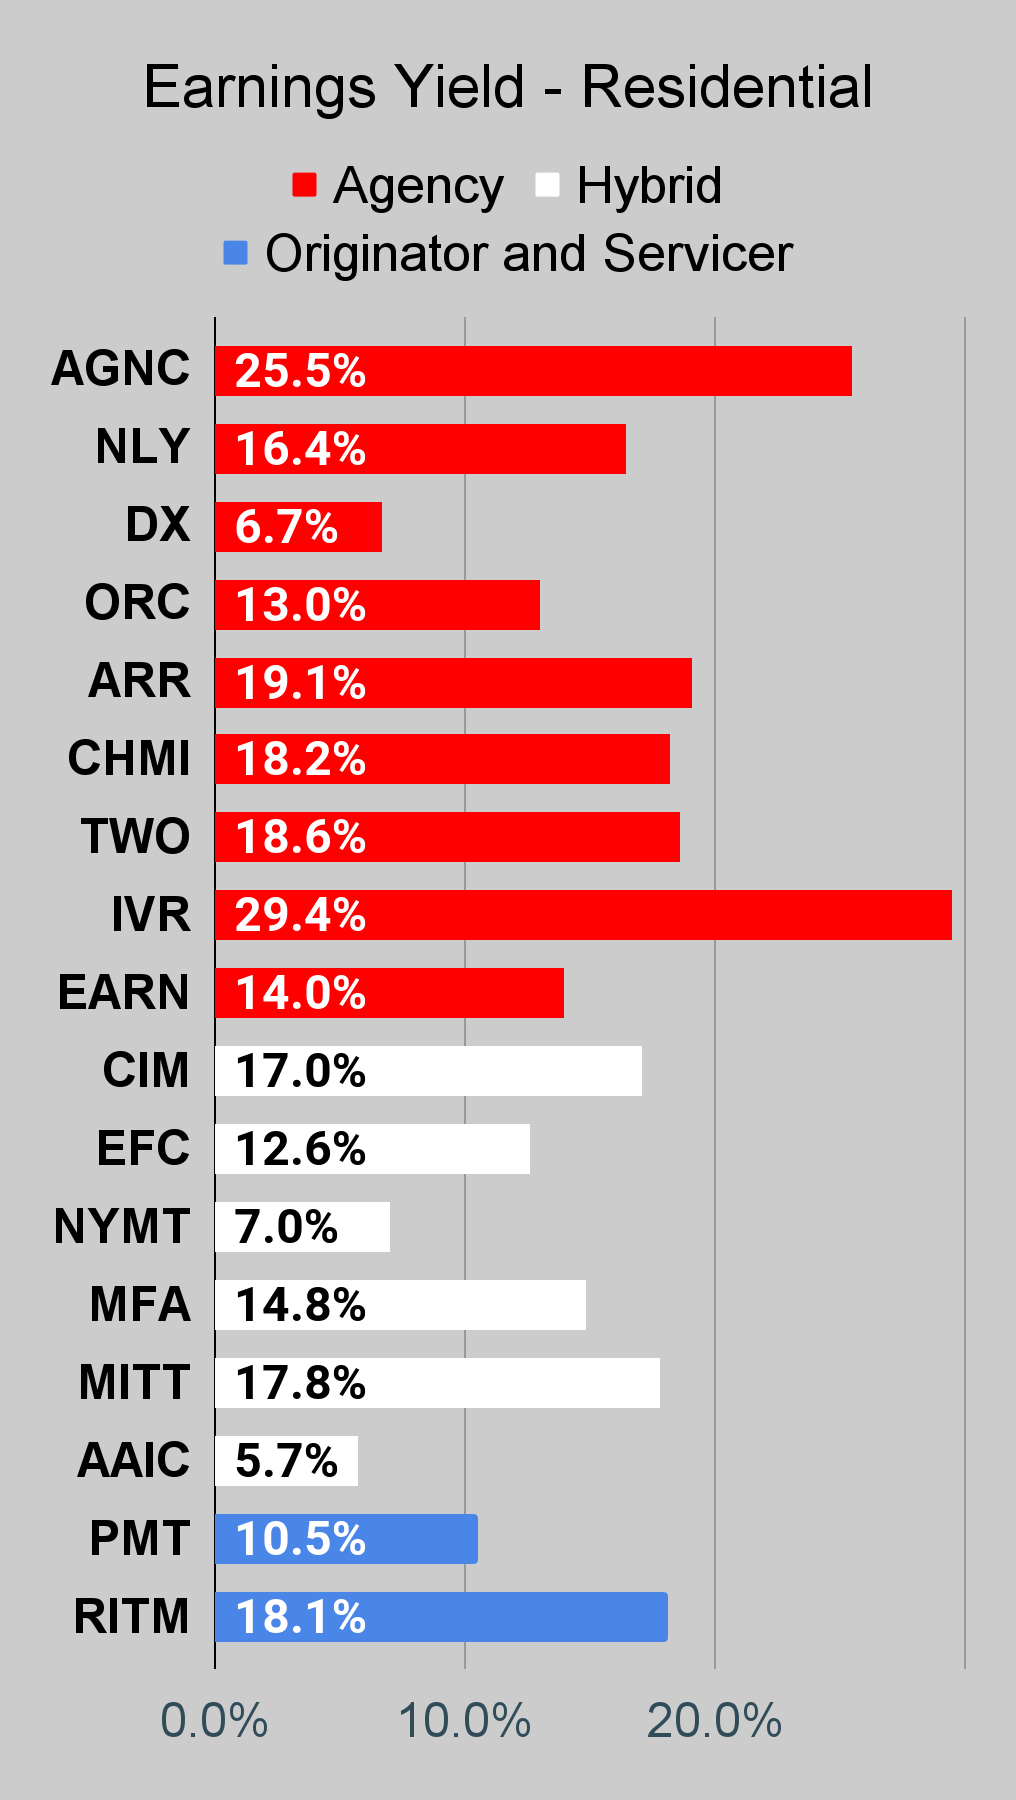
Residential Mortgage REIT Charts
Note: The chart for our public articles uses the book value per share from the latest earnings release. Current estimated book value per share is used in reaching our targets and trading decisions. It is available in our service, but those estimates are not included in the charts below. PMT and NYMT are not showing an earnings yield metric as neither REIT provides a quarterly “Core EPS” metric.
 The REIT Forum |
 The REIT Forum |
 The REIT Forum |
Commercial Mortgage REIT Charts
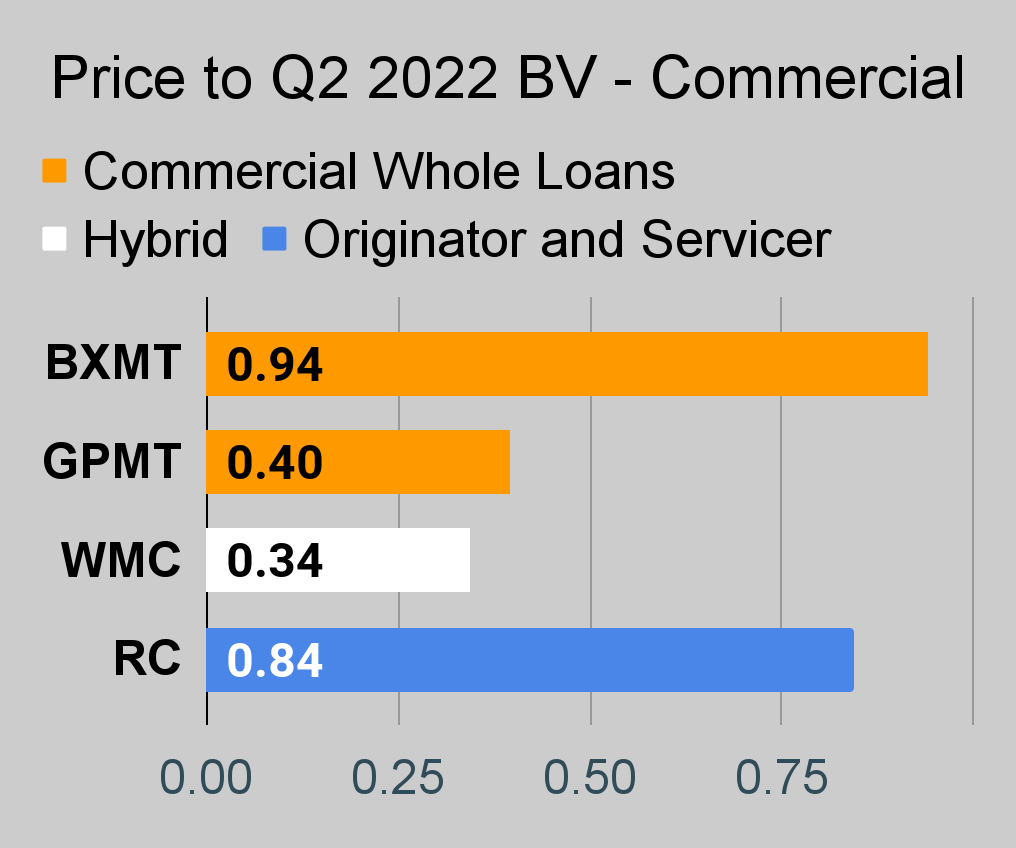 The REIT Forum |
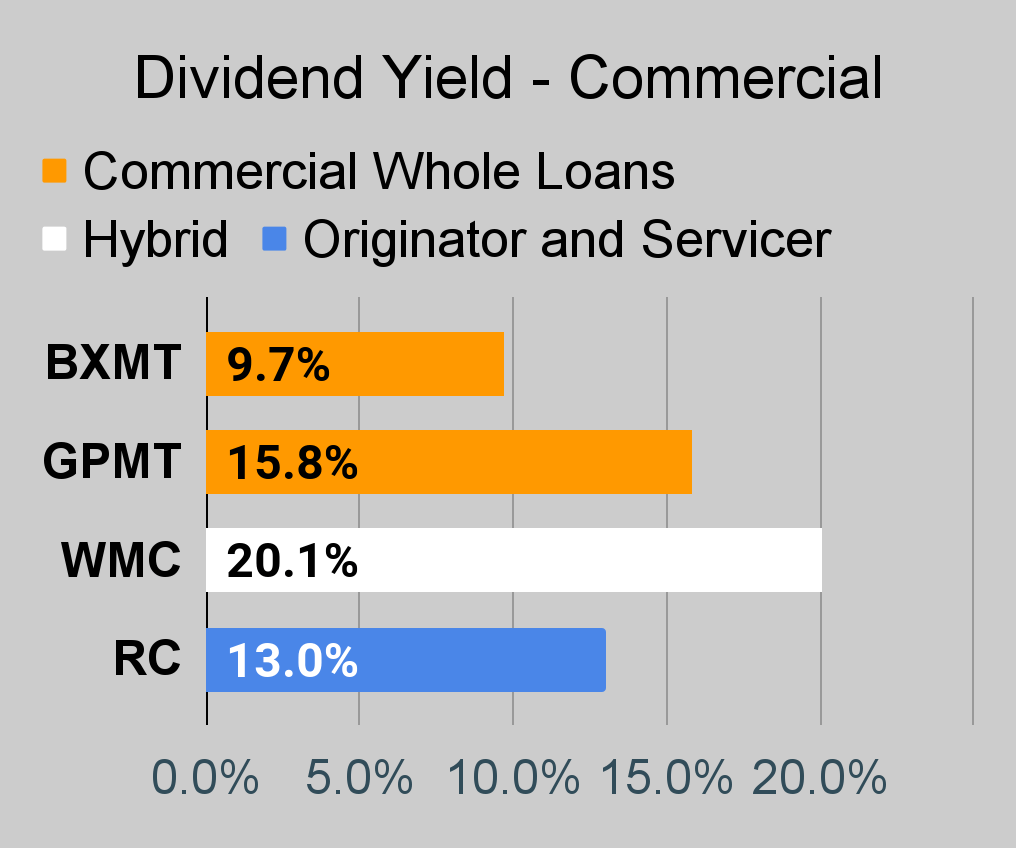 The REIT Forum |
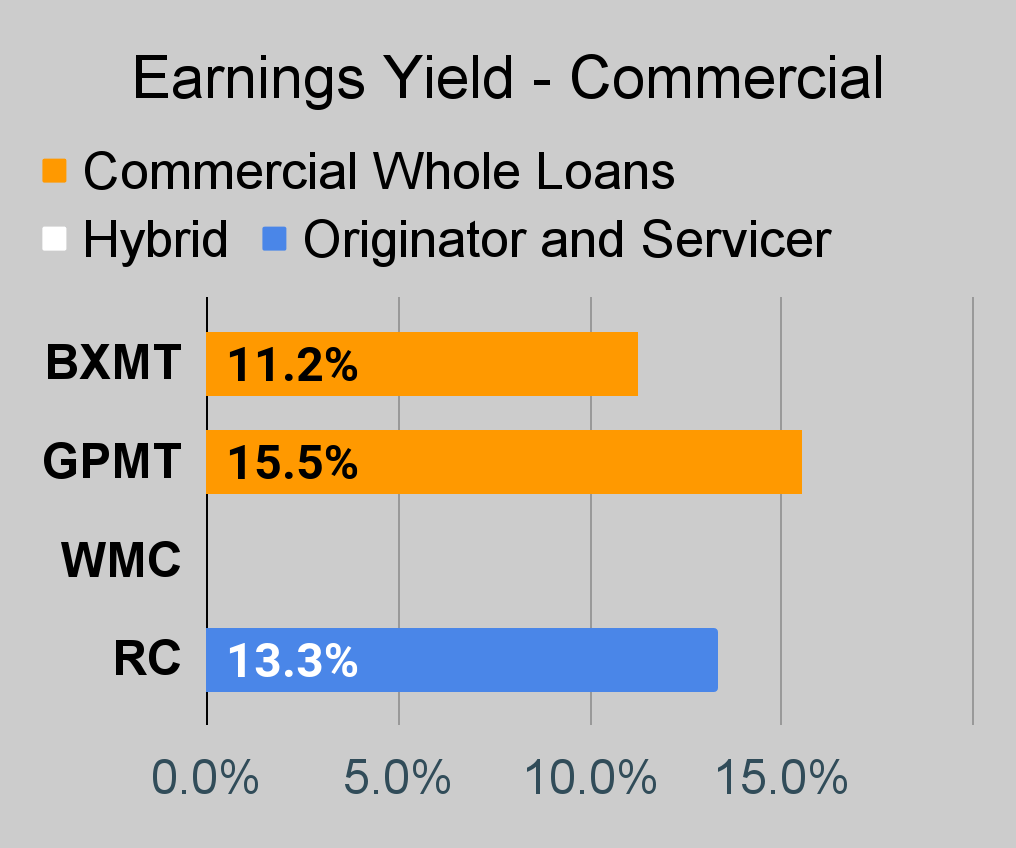 The REIT Forum |
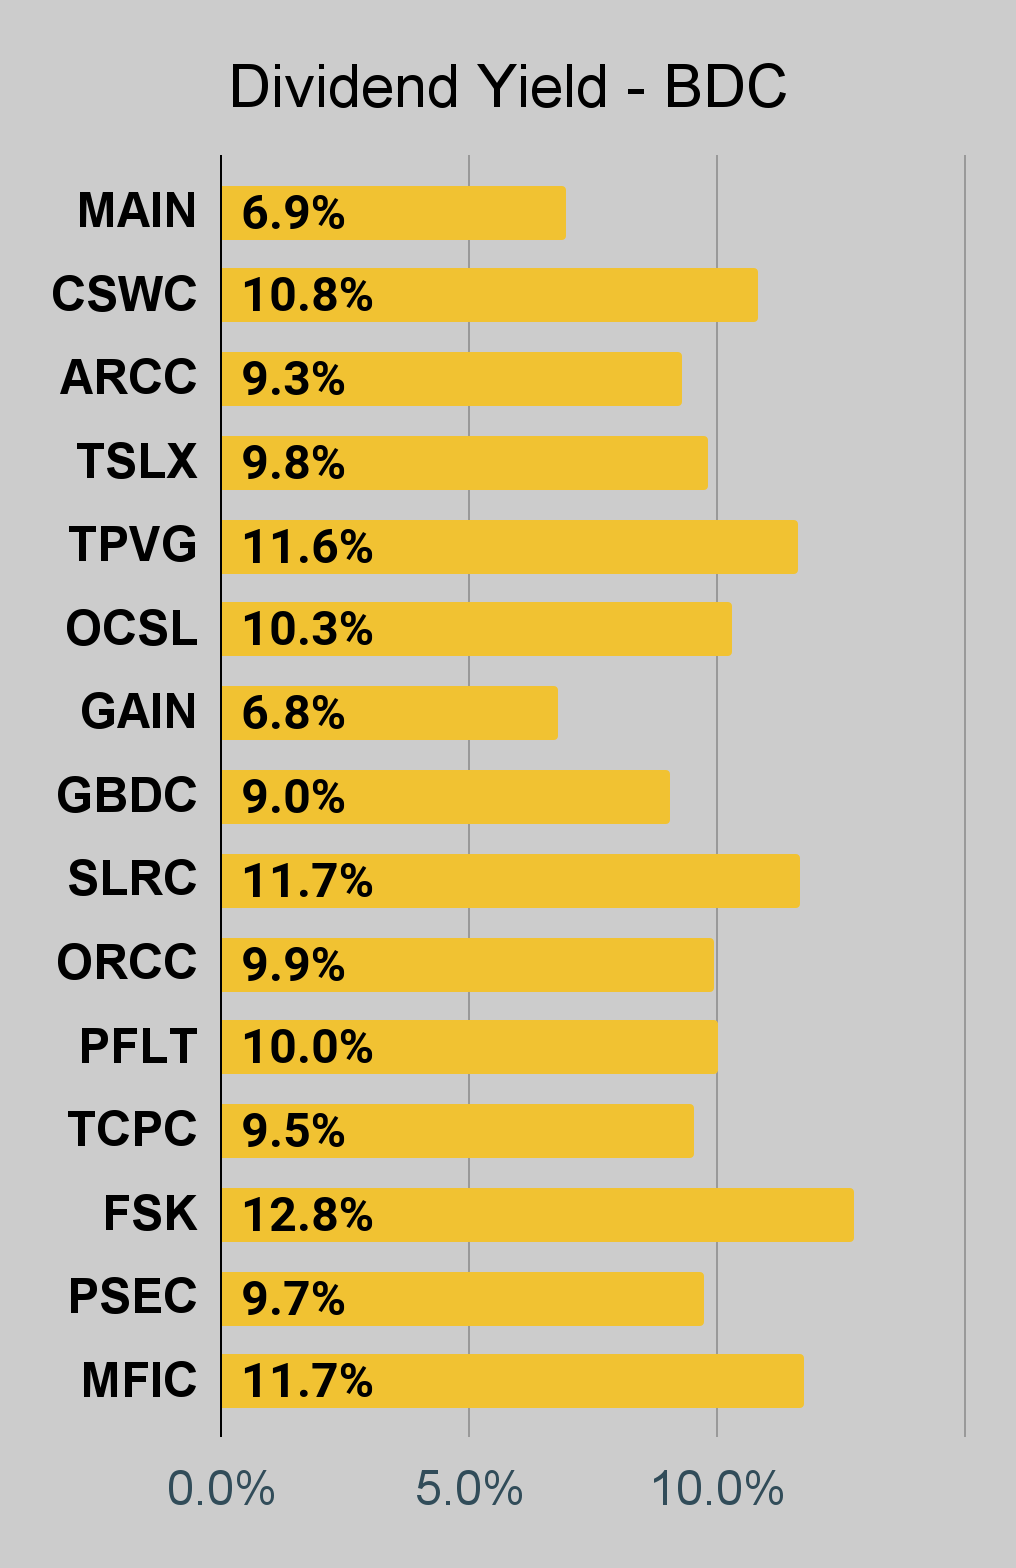
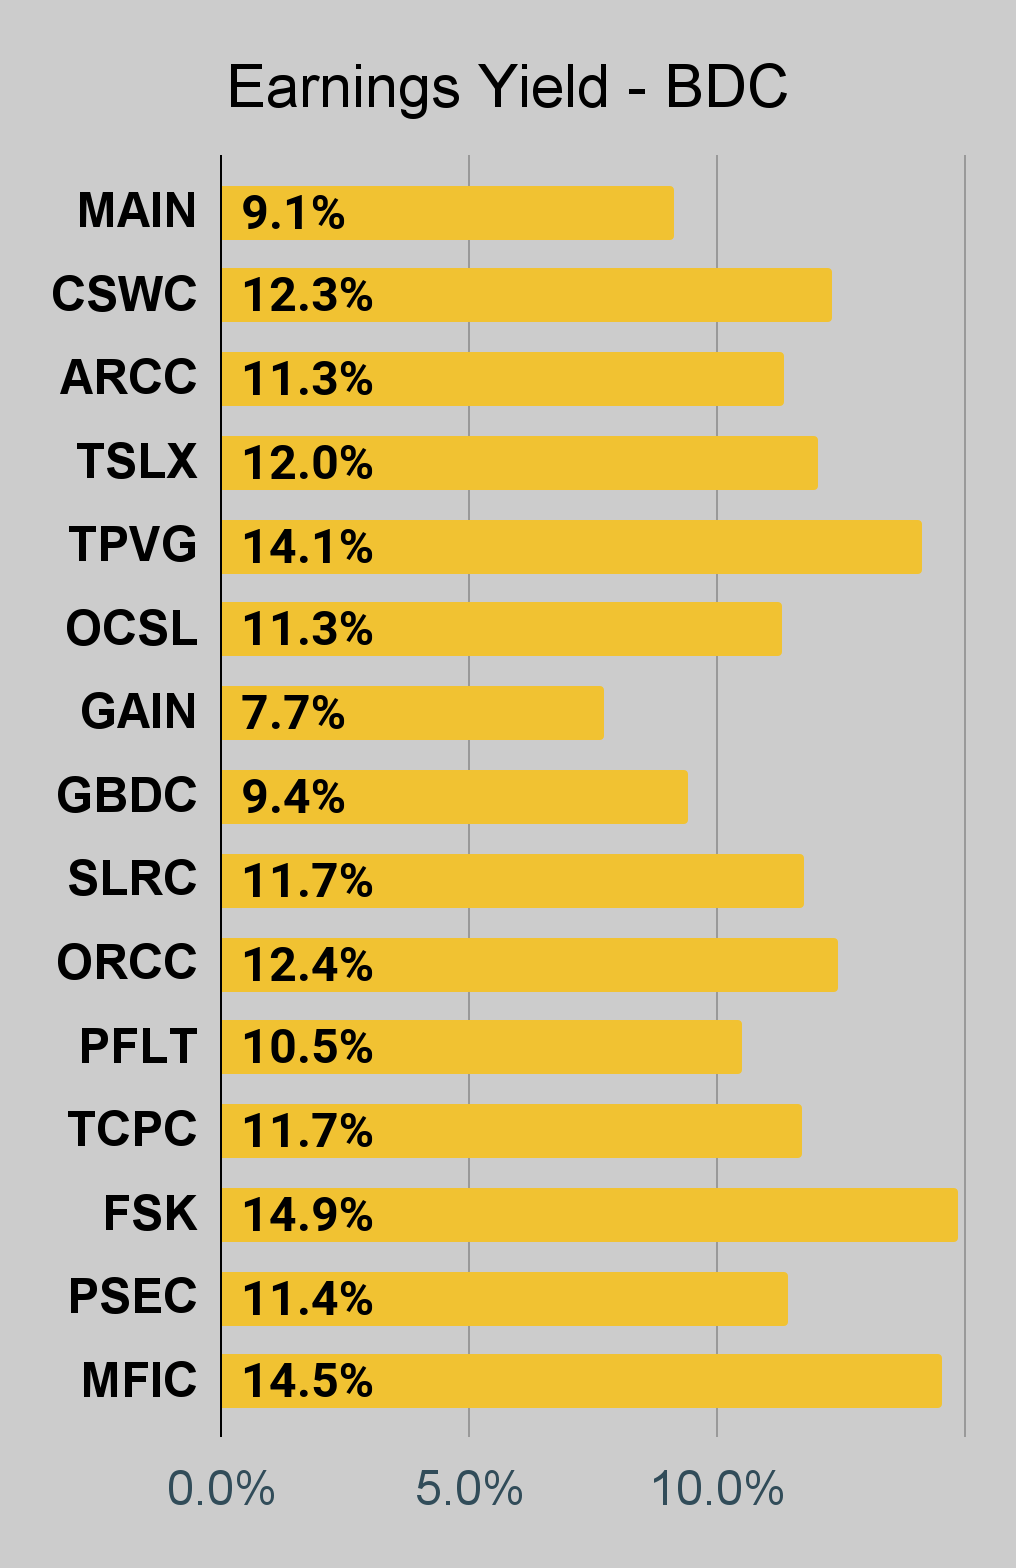
BDC Charts
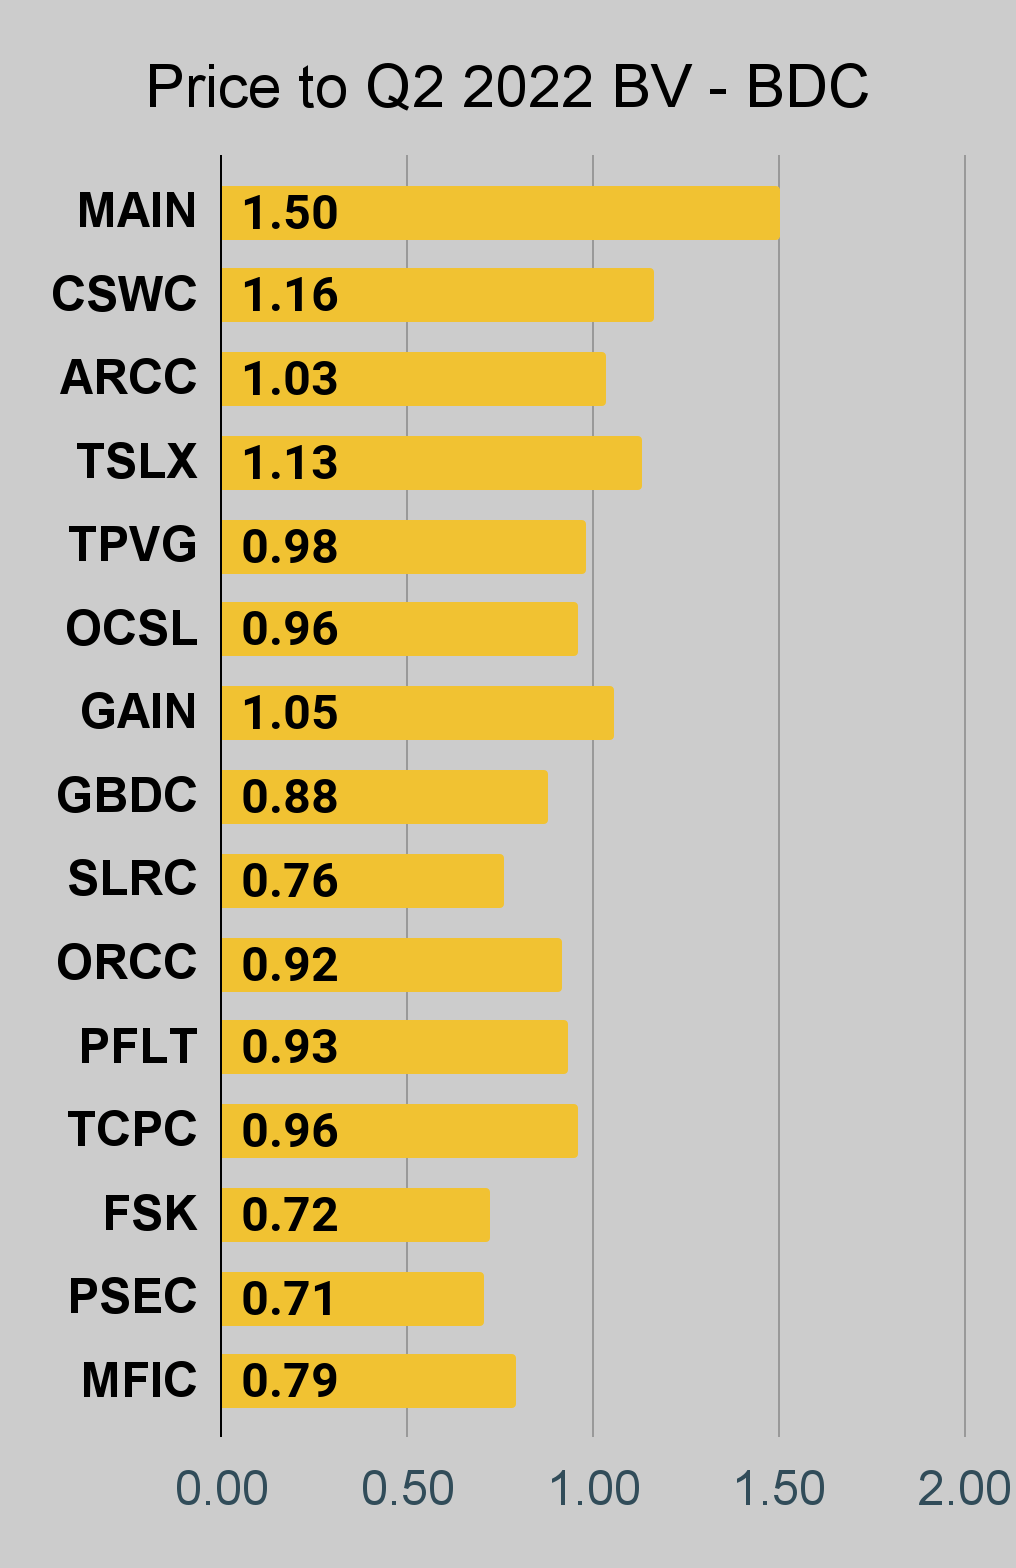 The REIT Forum |
 The REIT Forum |
 The REIT Forum |
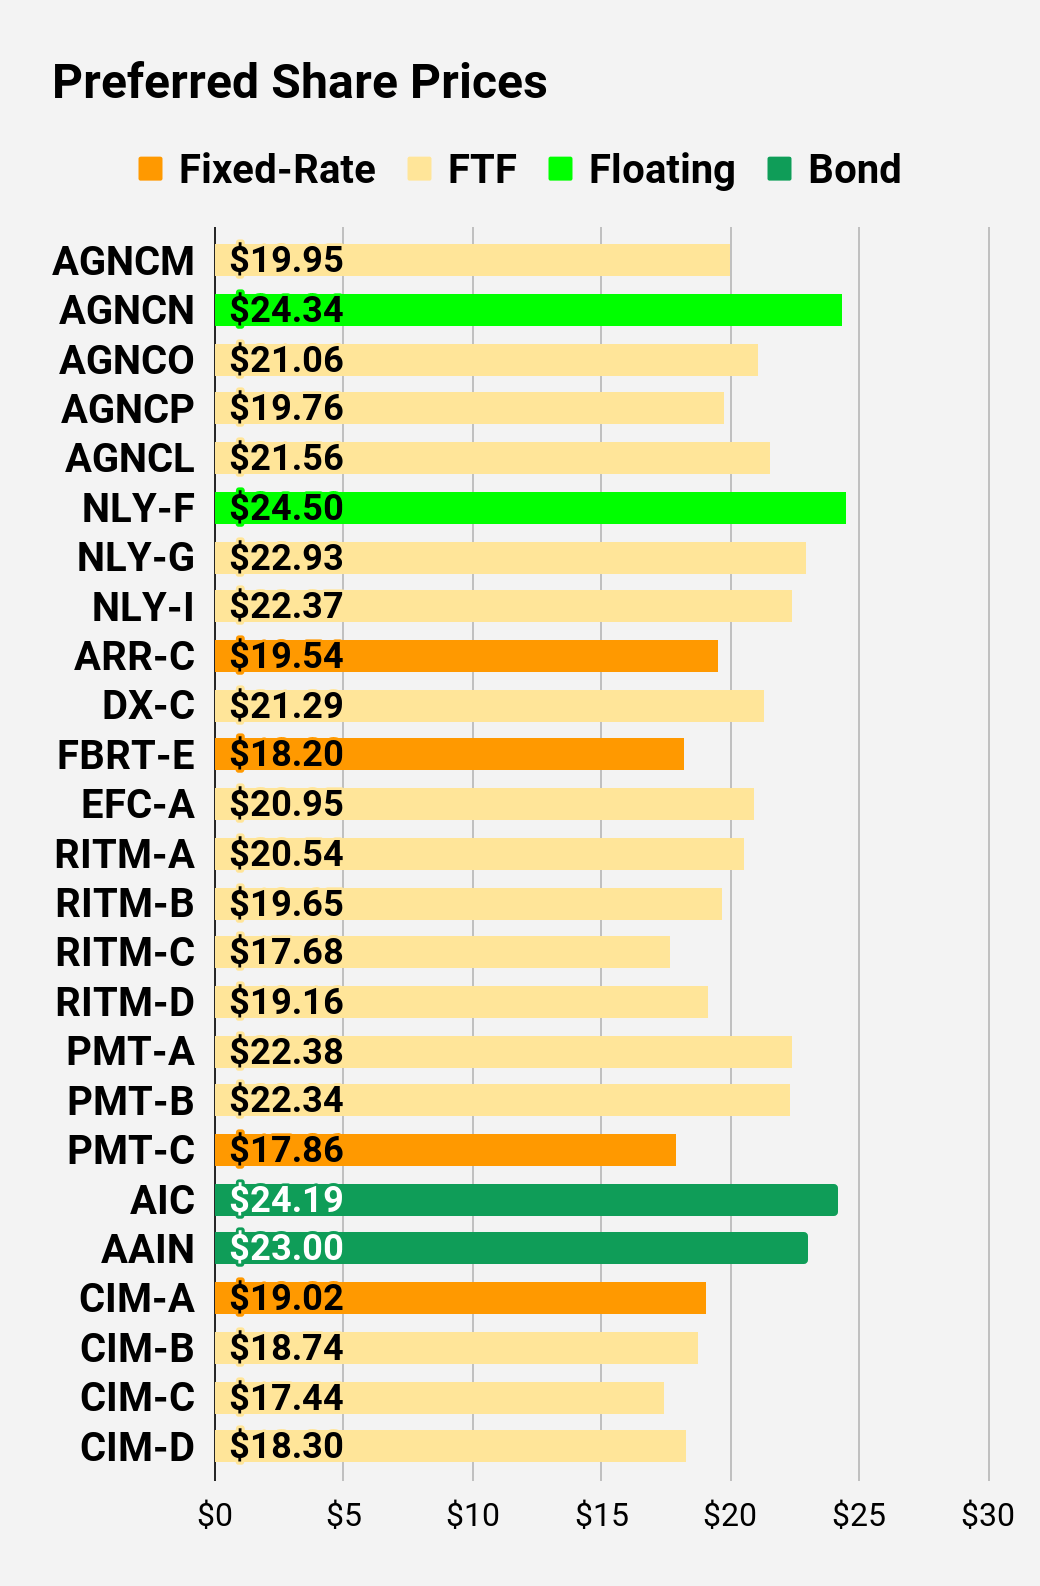
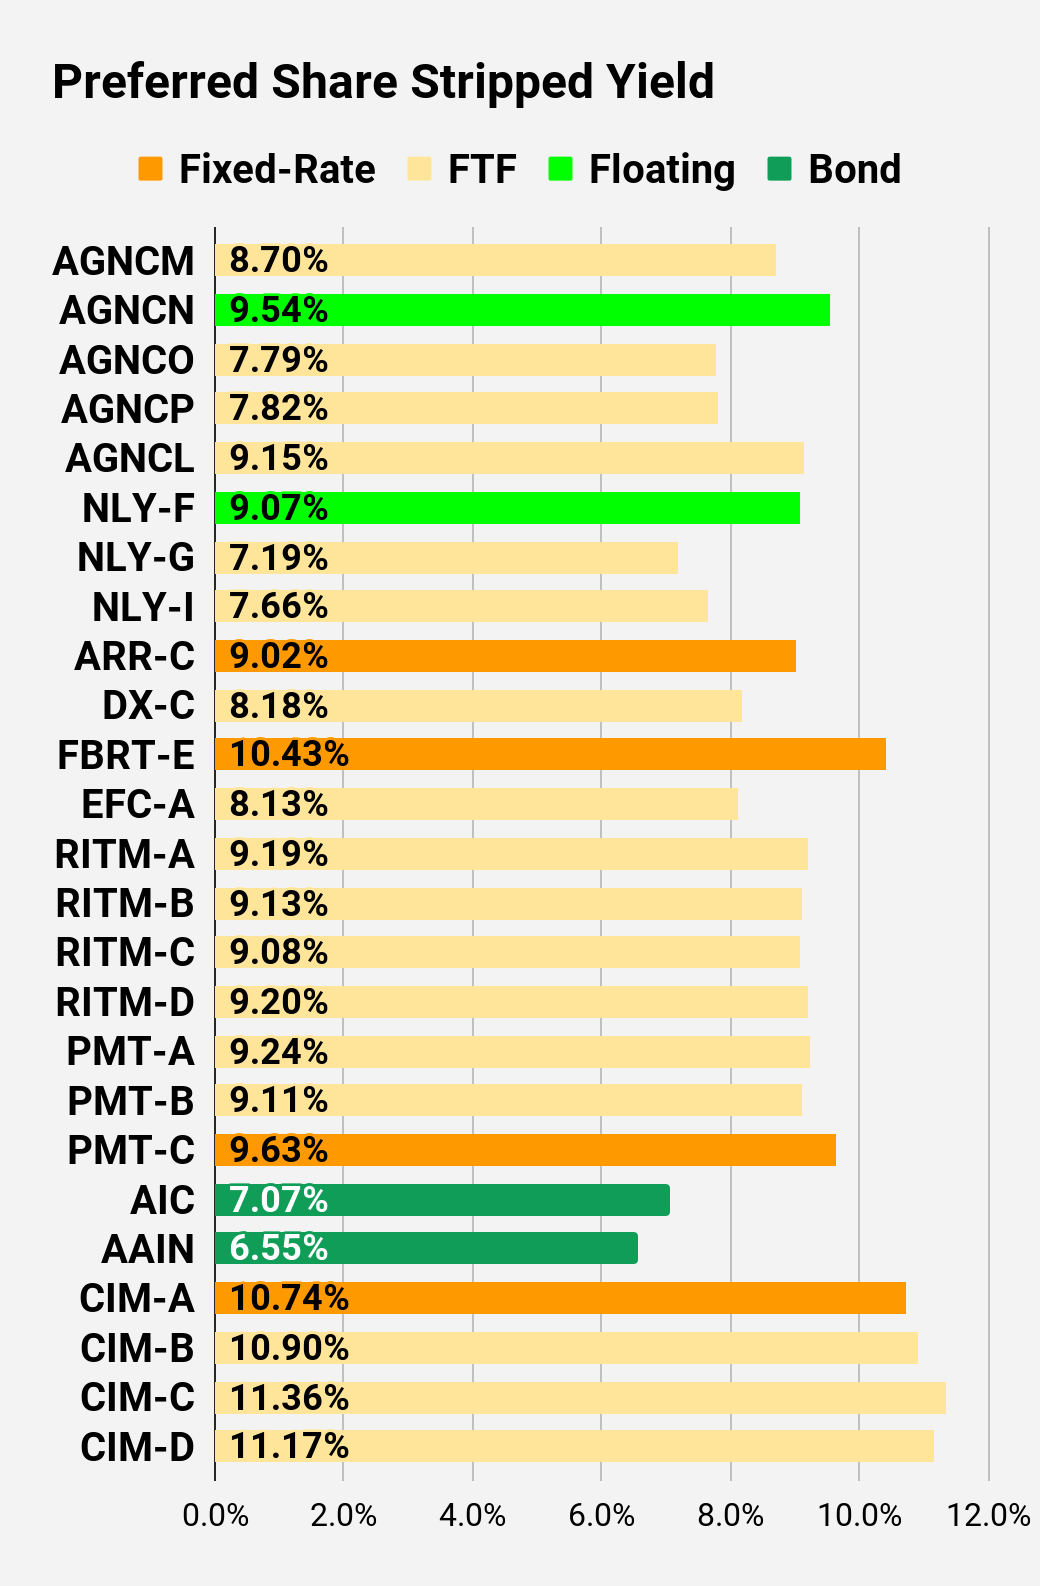
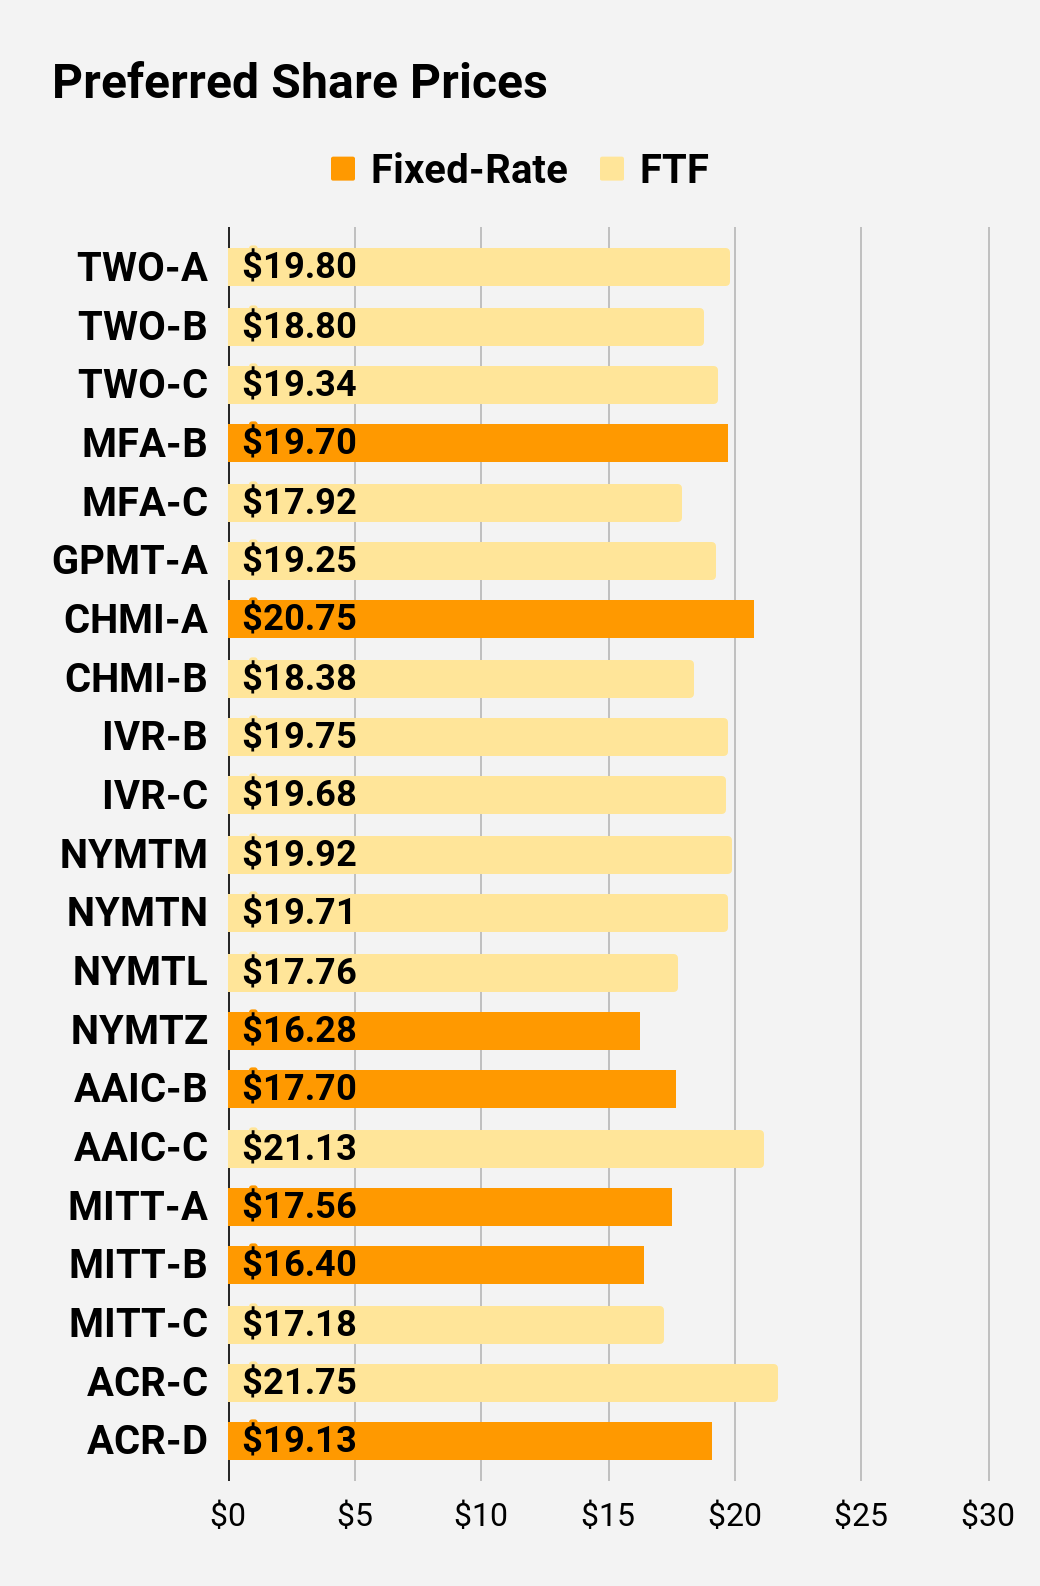
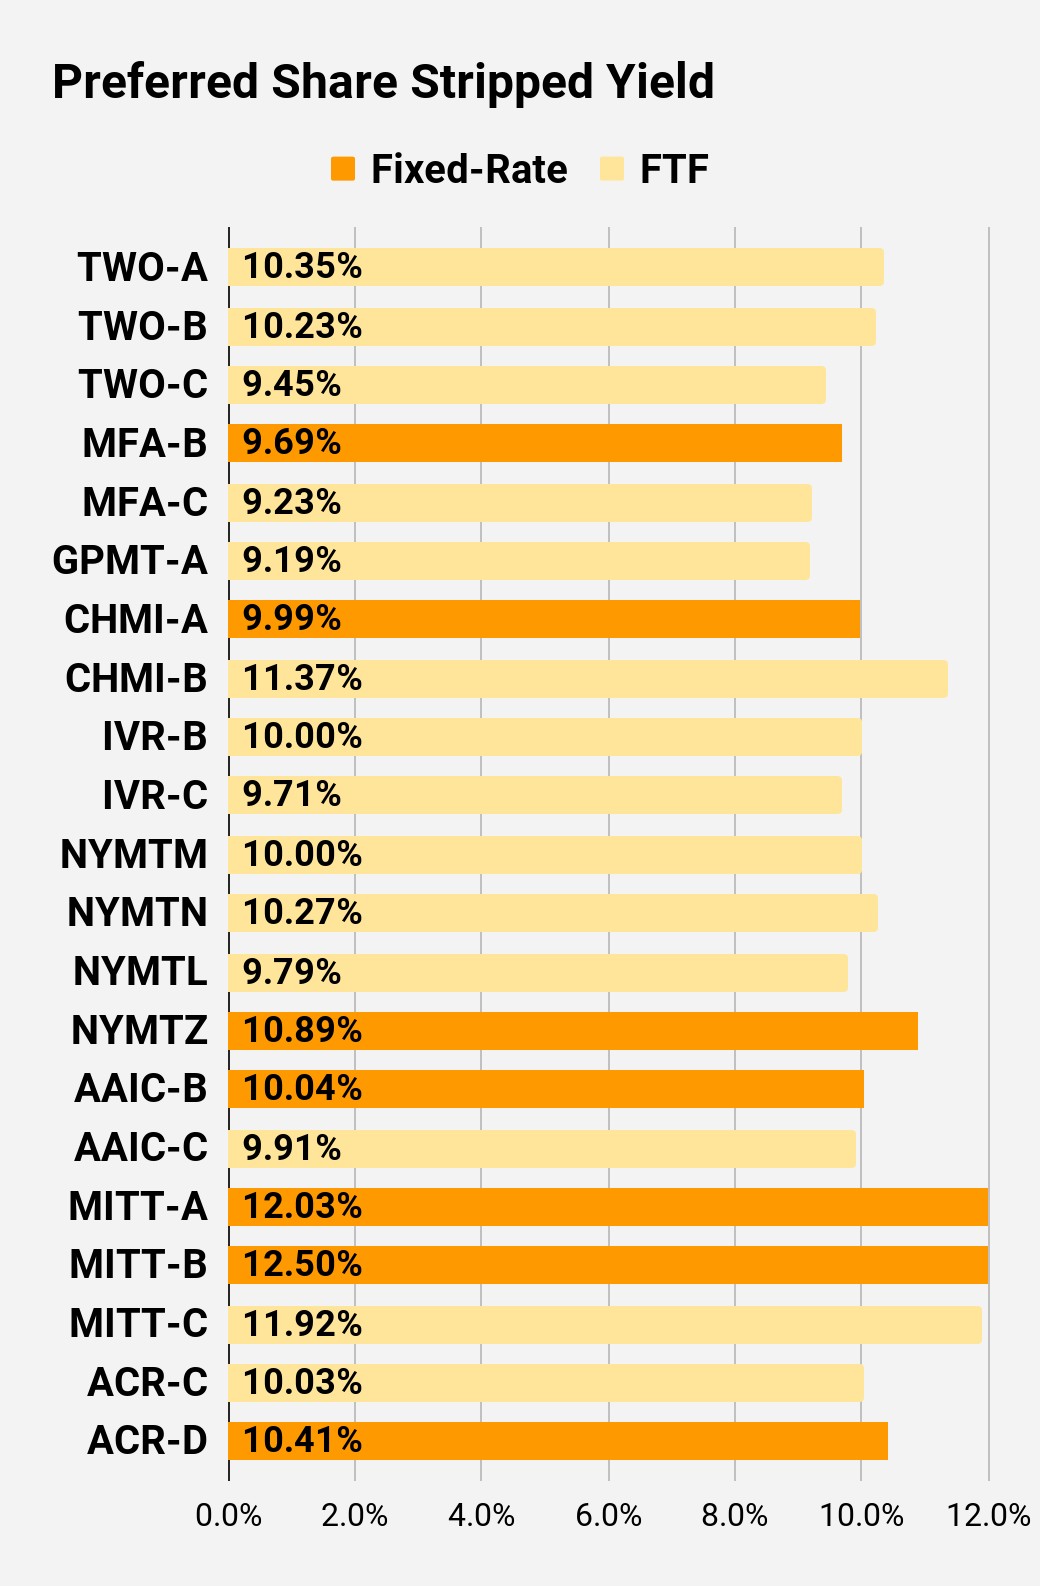
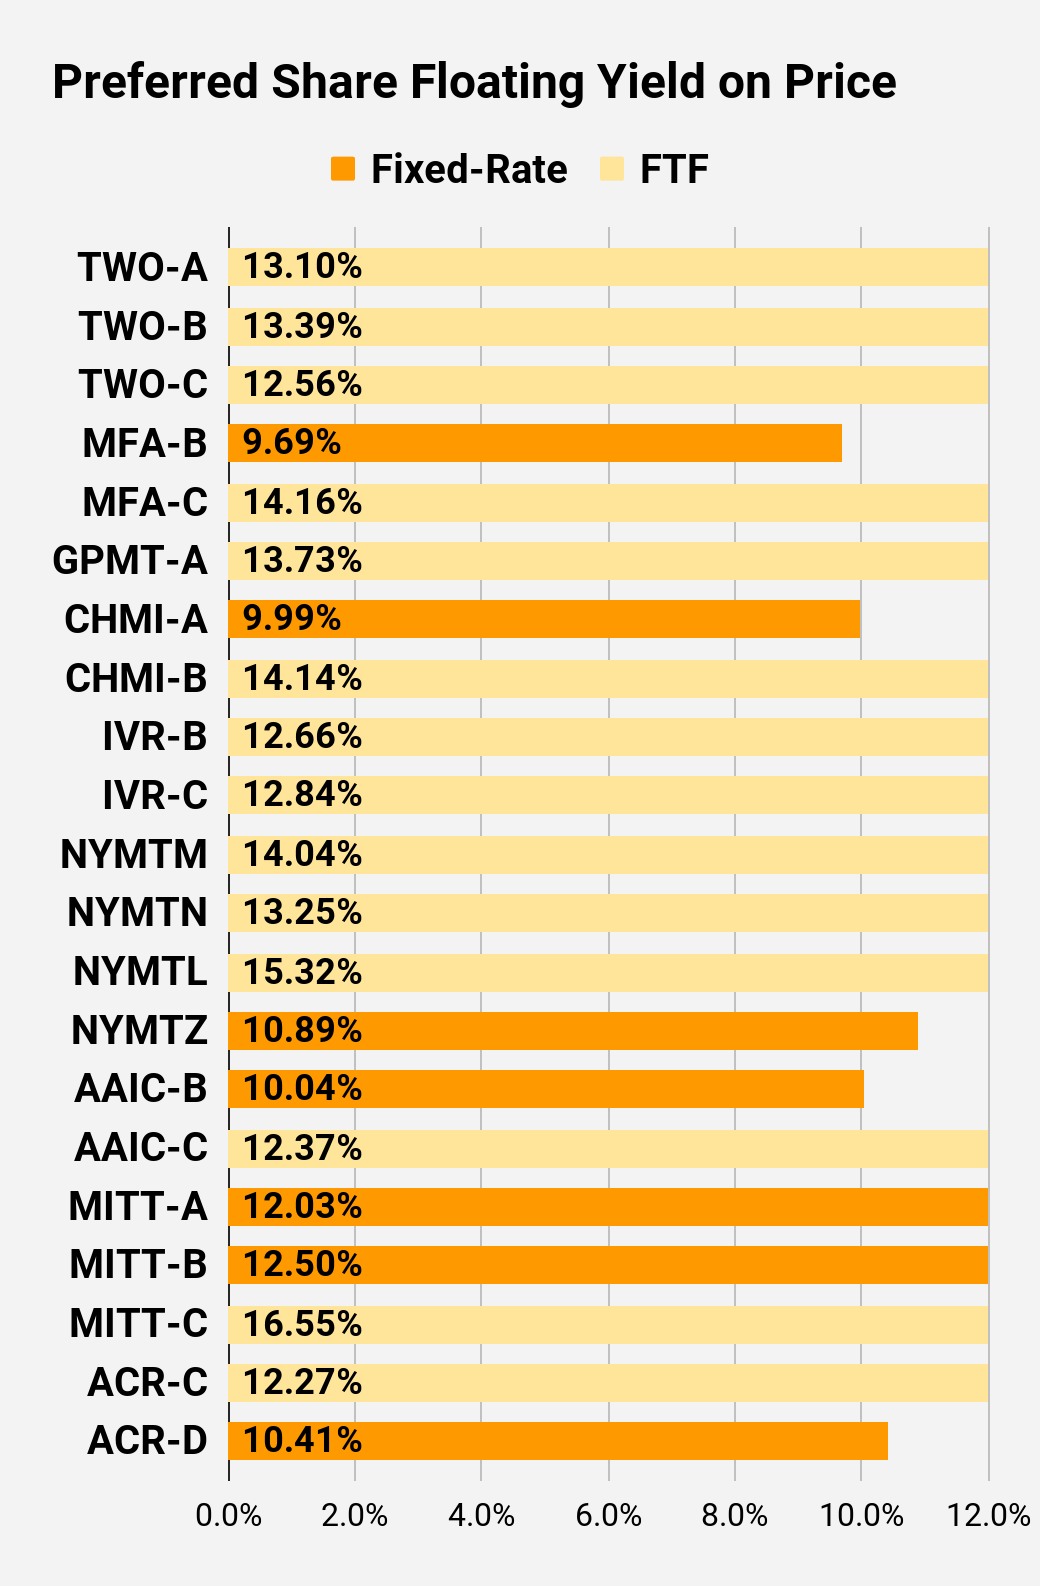
Preferred Share Charts
I changed the coloring a bit. We needed to adjust to include that the first fixed-to-floating shares have transitioned over to floating rates. When a share is already floating, the stripped yield may be different than the “Floating Yield on Price” due to changes in interest rates. For instance, NLY-F already has a floating rate. However, the rate is only reset once per 3 months. The stripped yield is calculated using the upcoming projected dividend payment and the “Floating Yield on Price” is based on where the dividend would be if the rate reset today. In my opinion, for these shares the “Floating Yield on Price” is clearly the more important metric.
 The REIT Forum |
 The REIT Forum |
 The REIT Forum |
 The REIT Forum |
 The REIT Forum |
 The REIT Forum |
Preferred Share Data
Beyond the charts, we’re also providing our readers with access to several other metrics for the preferred shares.
After testing out a series on preferred shares, we decided to try merging it into the series on common shares. After all, we are still talking about positions in mortgage REITs. We don’t have any desire to cover preferred shares without cumulative dividends, so any preferred shares you see in our column will have cumulative dividends. You can verify that by using Quantum Online. We’ve included the links in the table below.
To better organize the table, we needed to abbreviate column names as follows:
- Price = Recent Share Price – Shown in Charts
- BoF = Bond or FTF (Fixed-to-Floating)
- S-Yield = Stripped Yield – Shown in Charts
- Coupon = Initial Fixed-Rate Coupon
- FYoP = Floating Yield on Price – Shown in Charts
- NCD = Next Call Date (the soonest shares could be called)
- Note: For all FTF issues, the floating rate would start on NCD.
- WCC = Worst Cash to Call (lowest net cash return possible from a call)
- QO Link = Link to Quantum Online Page
Second Batch:
Strategy
Our goal is to maximize total returns. We achieve those most effectively by including “trading” strategies. We regularly trade positions in the mortgage REIT common shares and BDCs because:
- Prices are inefficient.
- Long-term, share prices generally revolve around book value.
- Short-term, price-to-book ratios can deviate materially.
- Book value isn’t the only step in analysis, but it is the cornerstone.
We also allocate to preferred shares and equity REITs. We encourage buy-and-hold investors to consider using more preferred shares and equity REITs.
Performance
We compare our performance against 4 ETFs that investors might use for exposure to our sectors:
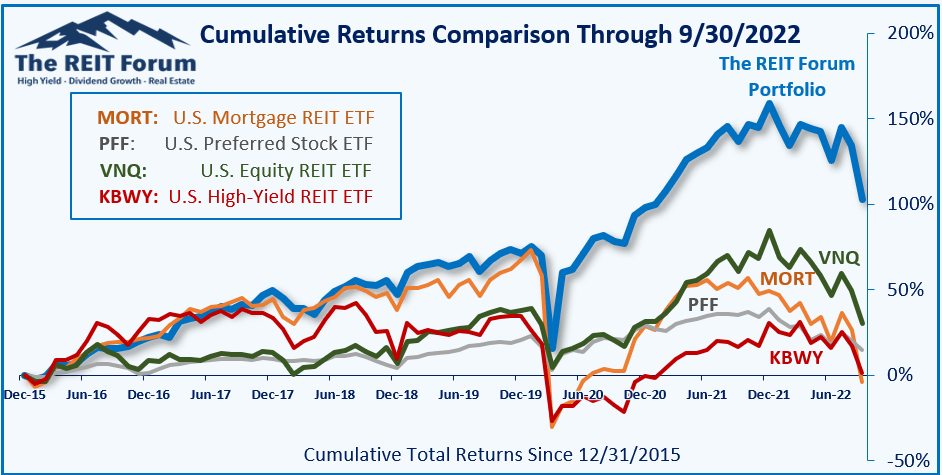
The REIT Forum
The 4 ETFs we use for comparison are:
|
Ticker |
Exposure |
|
One of the largest mortgage REIT ETFs |
|
|
One of the largest preferred share ETFs |
|
|
Largest equity REIT ETF |
|
|
The high-yield equity REIT ETF. Yes, it has been dreadful. |
When investors think it isn’t possible to earn solid returns in preferred shares or mortgage REITs, we politely disagree. The sector has plenty of opportunities, but investors still need to be wary of the risks. We can’t simply reach for yield and hope for the best. When it comes to common shares, we need to be even more vigilant to protect our principal by regularly watching prices and updating estimates for book value and price targets.
Ratings: Bearish on common shares ARR, TWO, and CHMI as price-to-book ratios are high enough they could encourage a secondary offering. There are much better choices available for investors.
Bullish on AGNCP and PMT-C. These shares offer investors a choice for fixed-to-floating and a choice for a fixed-rate share, so investors can pick the one that fits their outlook. I own both, though at the right price I’d be fine swapping out of them for other similar shares.
Be the first to comment