

Have you tried these fool’s tears? They are delicious!
guenterguni/E+ via Getty Images
Get ready for charts, images, and tables because they are better than words. The ratings and outlooks we highlight here come after Scott Kennedy’s weekly updates in the REIT Forum. Your continued feedback is greatly appreciated, so please leave a comment with suggestions.
Some of the mortgage REITs were wrecked over the last several months. Why? Let’s go.
Do you want the long answer or the short one?
Short version: BV got trucked.
Long version: Read the article.
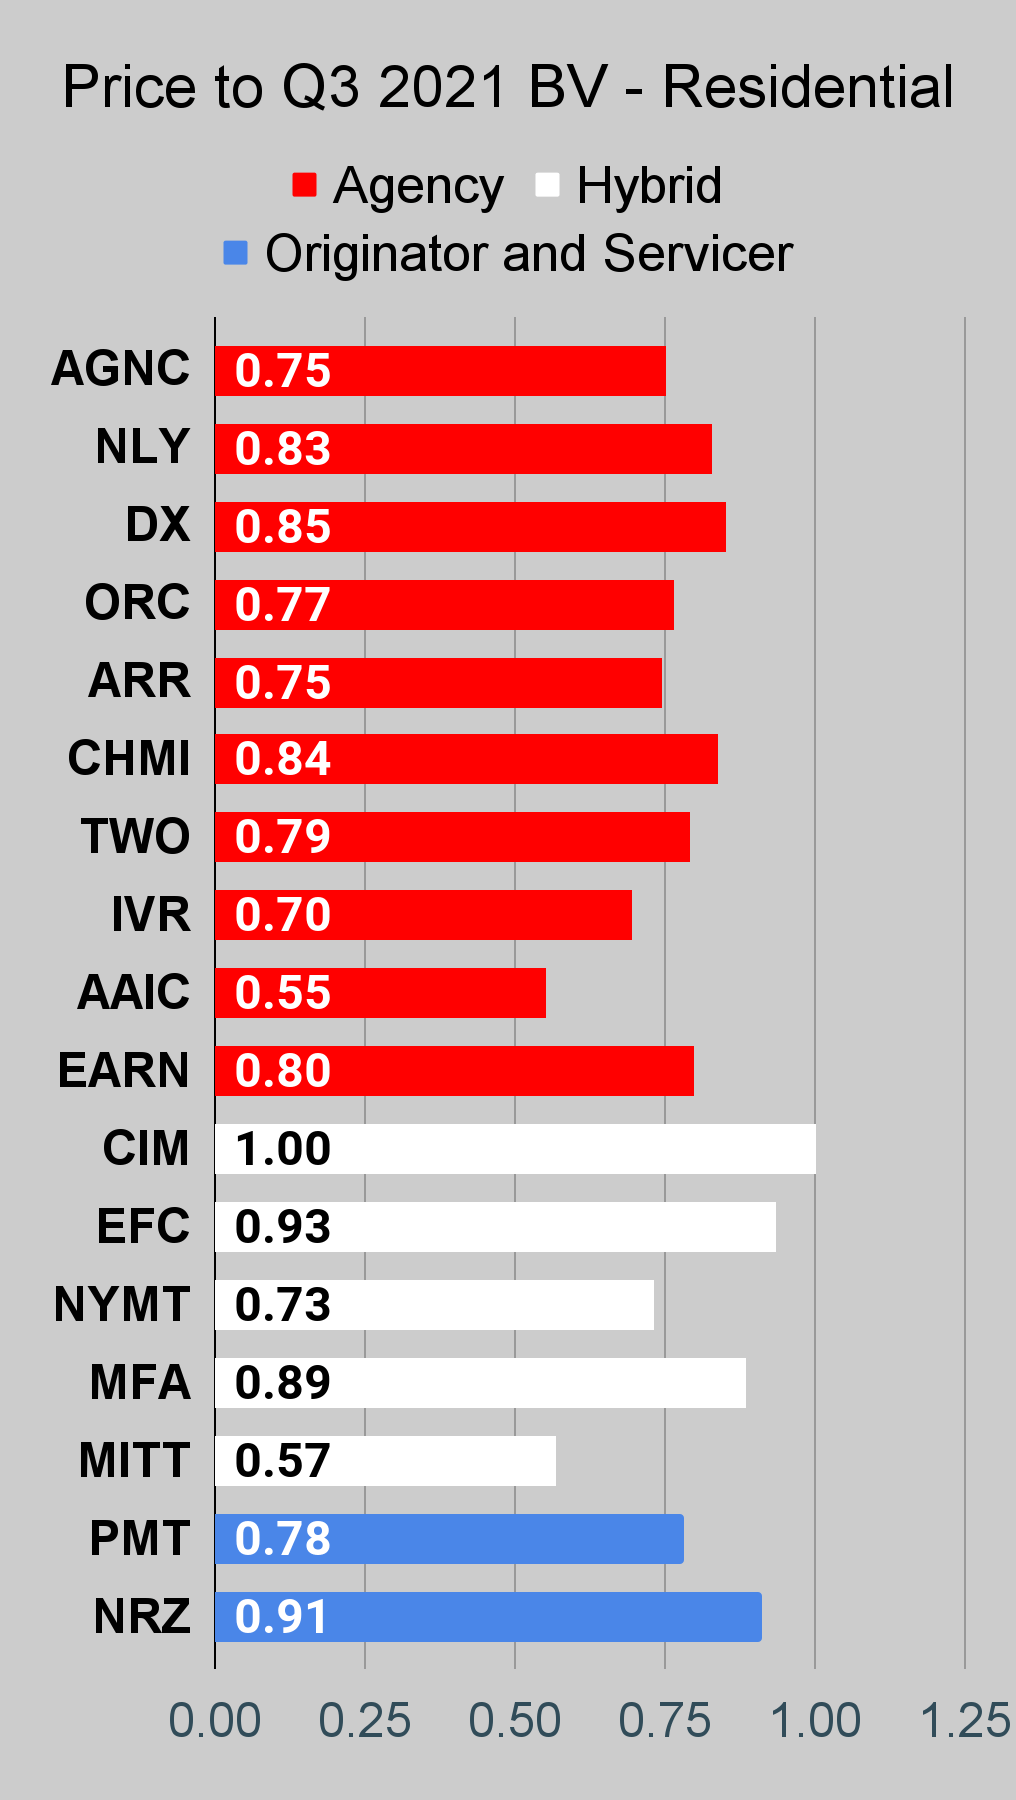
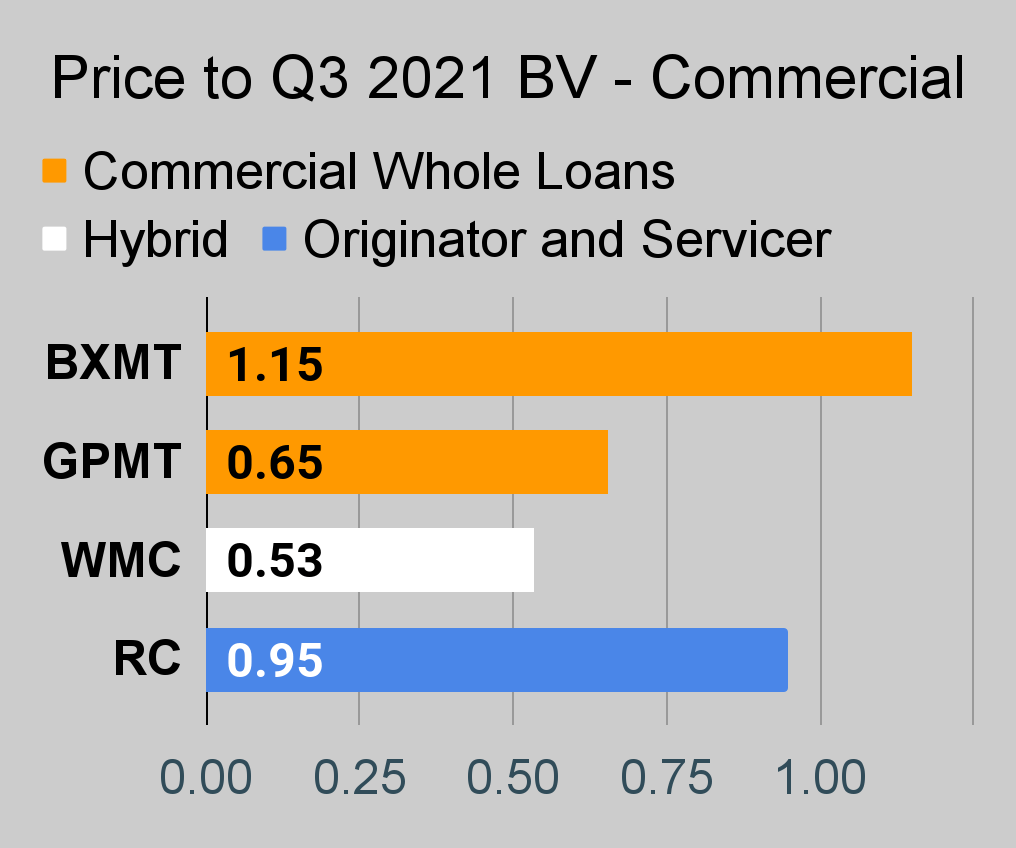
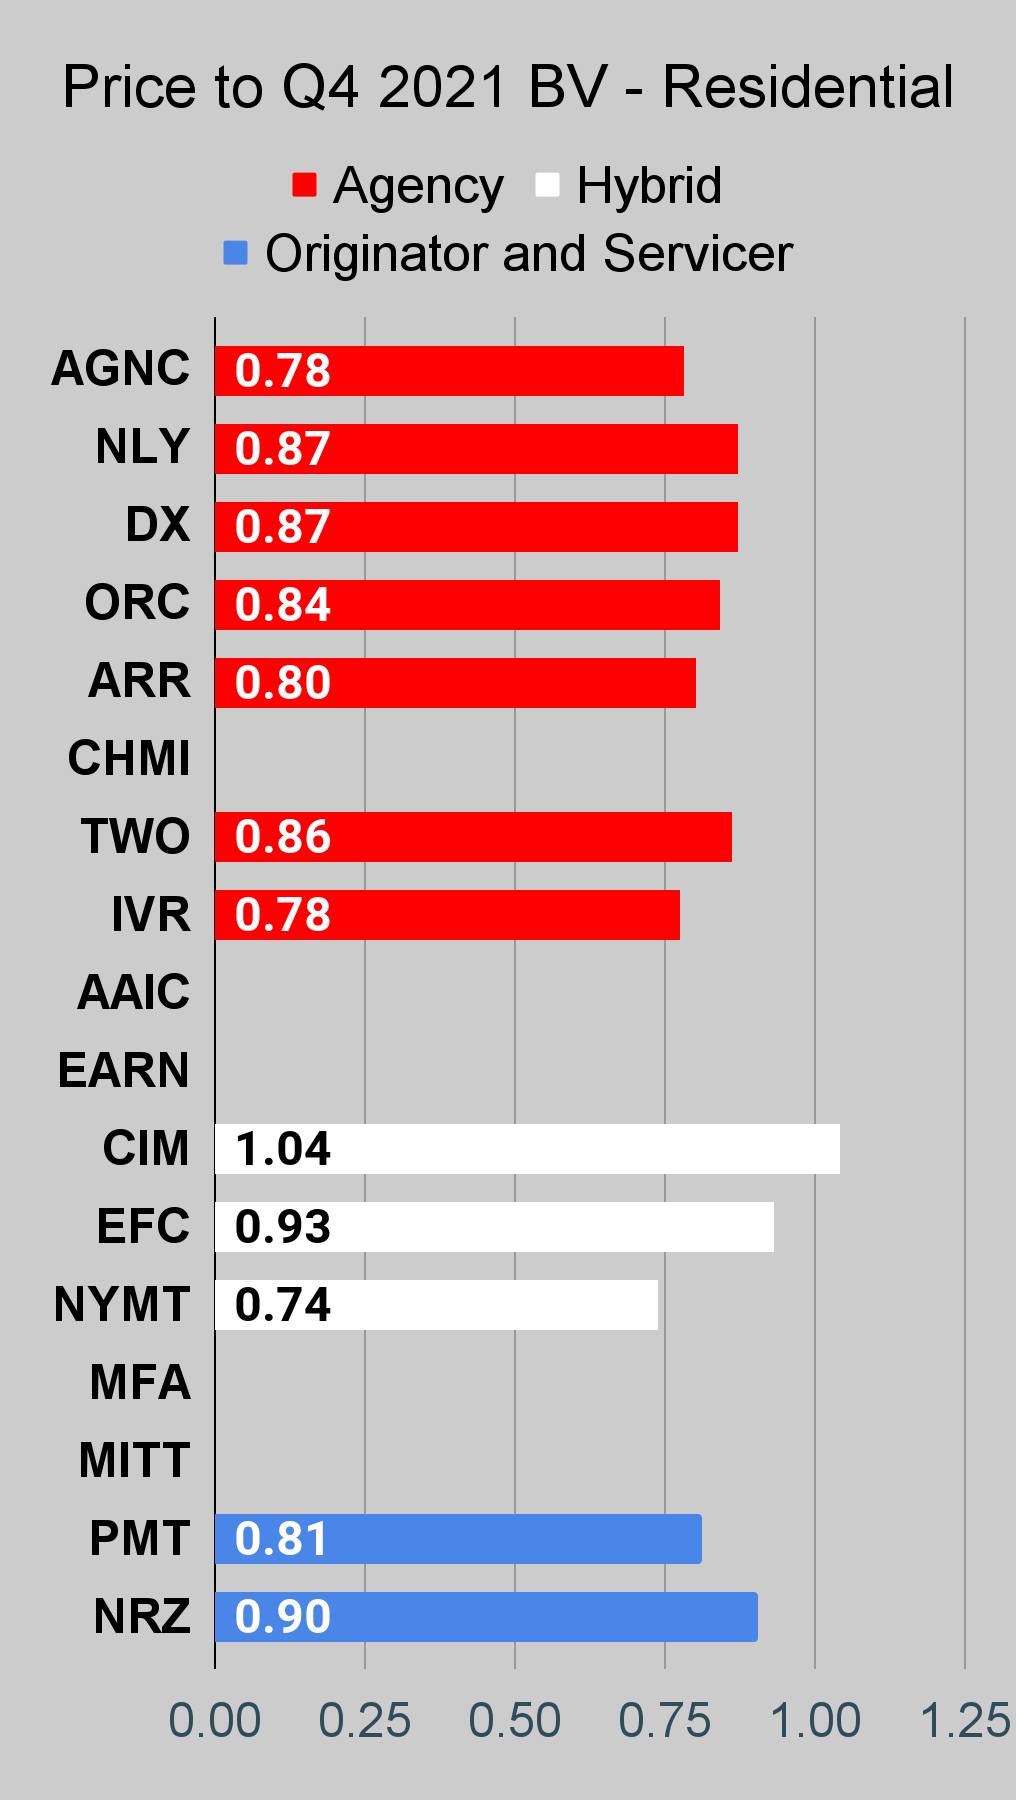
How is book value doing? Comparing values for Q4 2021 (that’s 12/31/2021) with values from Q1 2021 (that’s 3/31/2021), we see AGNC (NASDAQ:AGNC), Dynex (NYSE:DX), and Annaly (NYSE:NLY) are each down around 10% to 11%. That’s better than many of the other agency mortgage REITs. Armour (NYSE:ARR) was down over 16% and Orchid Island (NYSE:ORC) was down over 12%. IVR got hammered worse with a decline greater than 20%. Western Asset (NYSE:WMC) may beat that though. WMC managed to lose 19% of BV from Q1 2021 to Q3 2021. That’s all before Q4 2021 happened. Is there a trophy for losing money?
Is this a good time to point out that Q1 2022 has been a difficult time? By our estimates, many of the book values got pummeled again in Q1 2021. It was a good idea to be light on exposure. That’s an idea we emphasized a few quarters ago when price to book value ratios were soaring. When you combine a drop in book value with a drop in the price-to-book ratio, you get a collapsing share price.
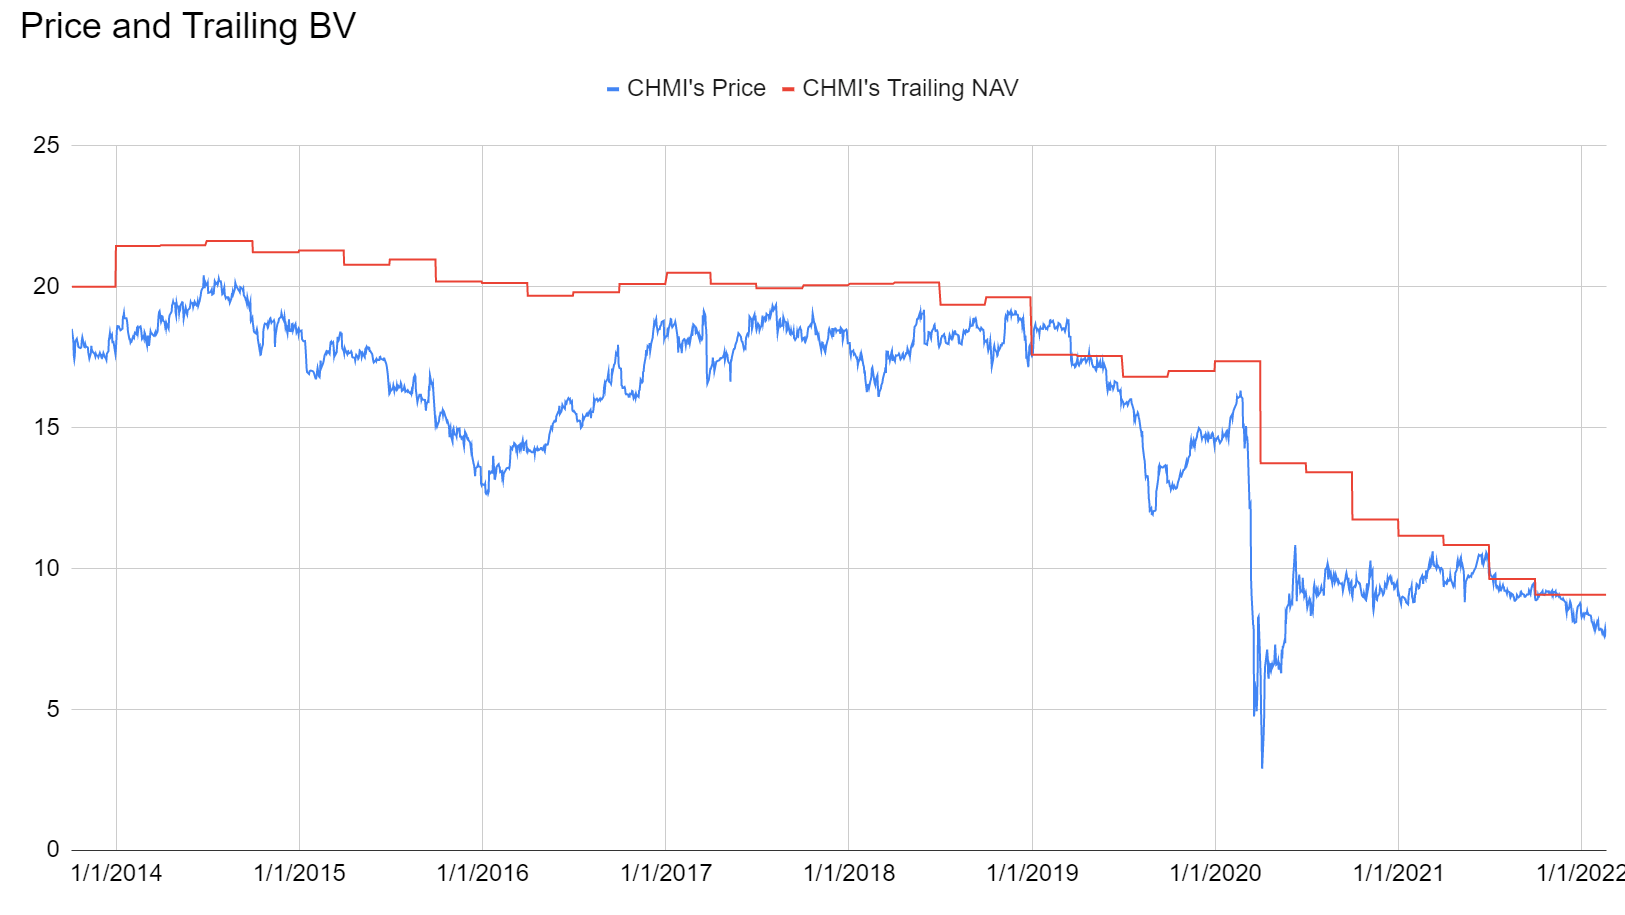
Let’s run some charts I built to demonstrate the connection. See if you can spot it for Cherry Hill (NYSE:CHMI):
The REIT Forum
It’s subtle, but the price and book value both declined on the right side of the chart. It’s okay if you missed it, that was just a warm up.
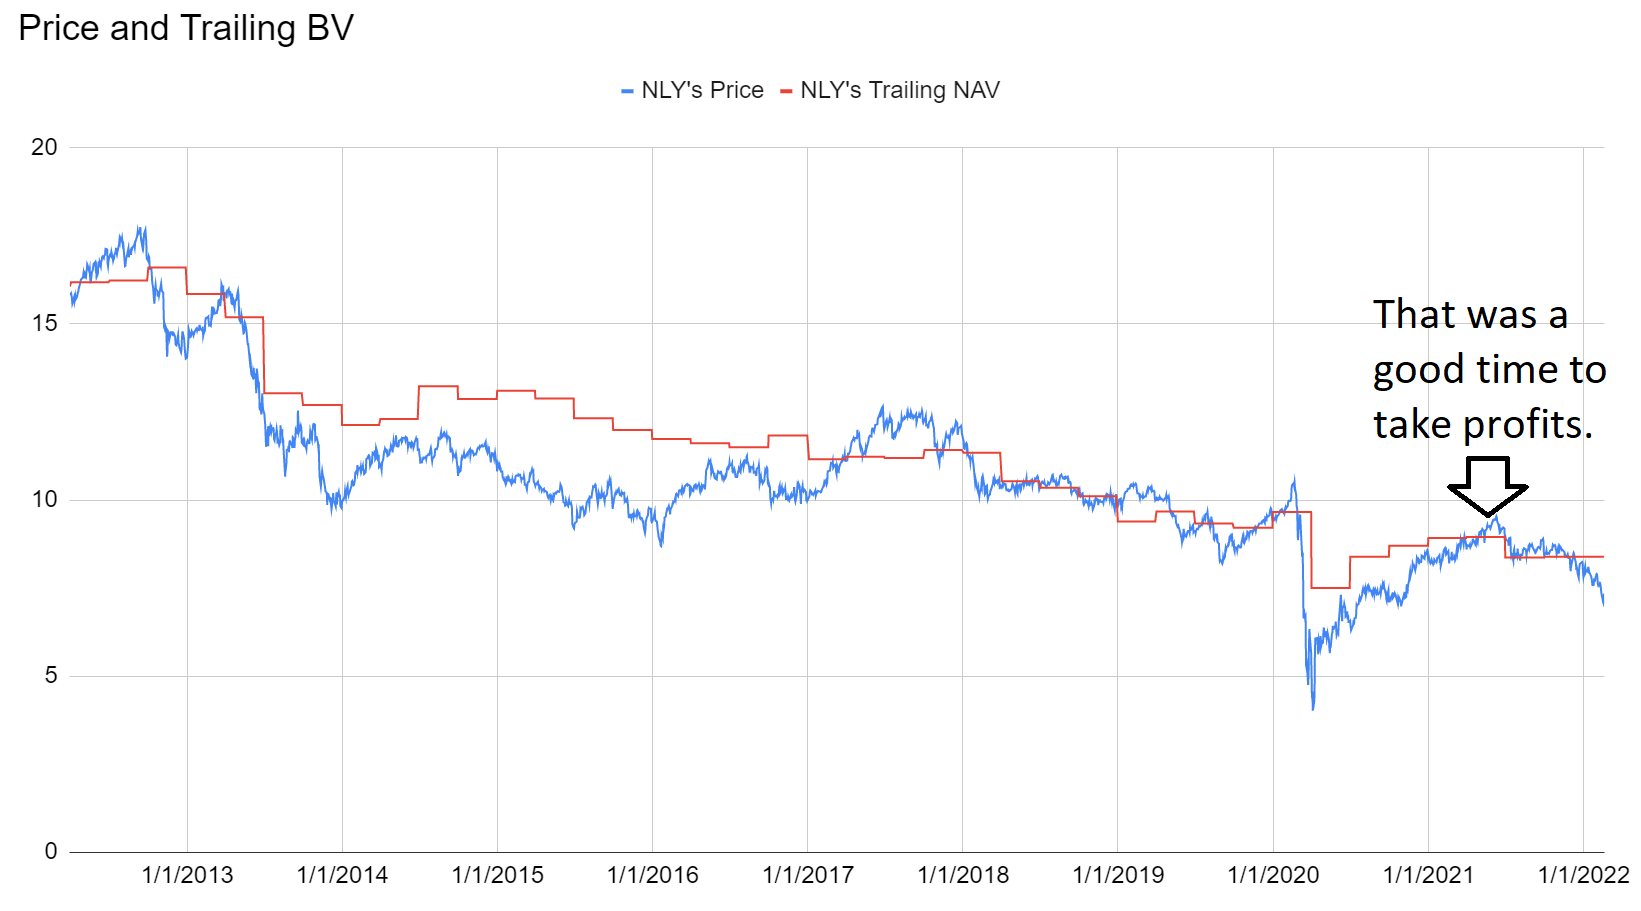
Here’s another one for Annaly Capital Management:
The REIT Forum
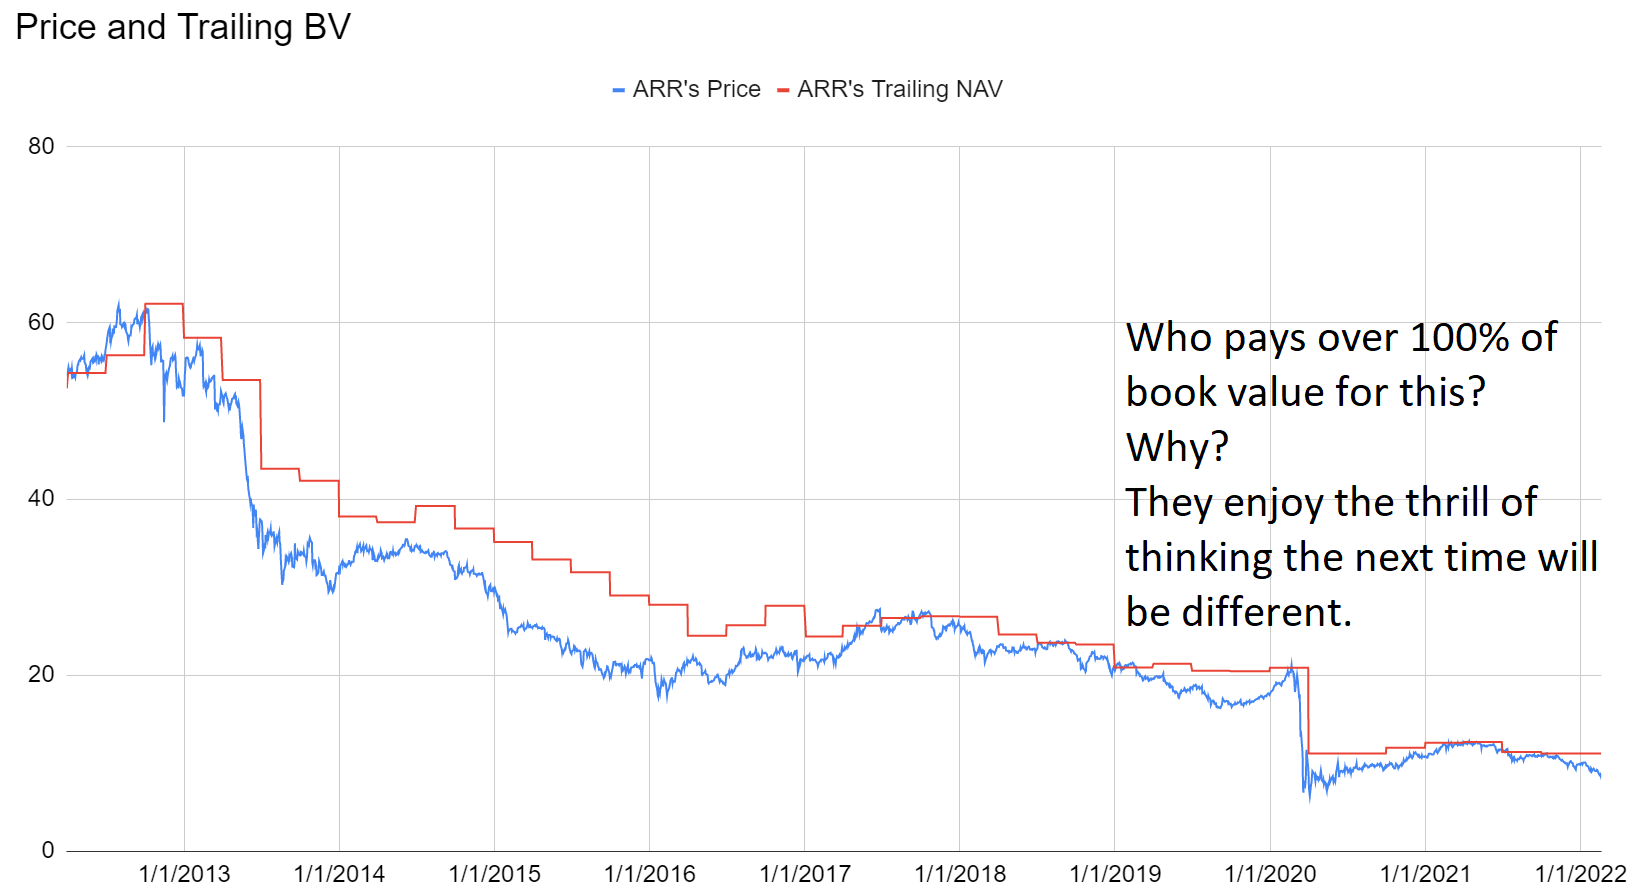
Alright, here comes one of my favorites. This time we have the chart for ARR.
The REIT Forum
That’s a great chart because by the end the price-to-book ratio is harder to recognize since the values are shoved into the bottom right corner.
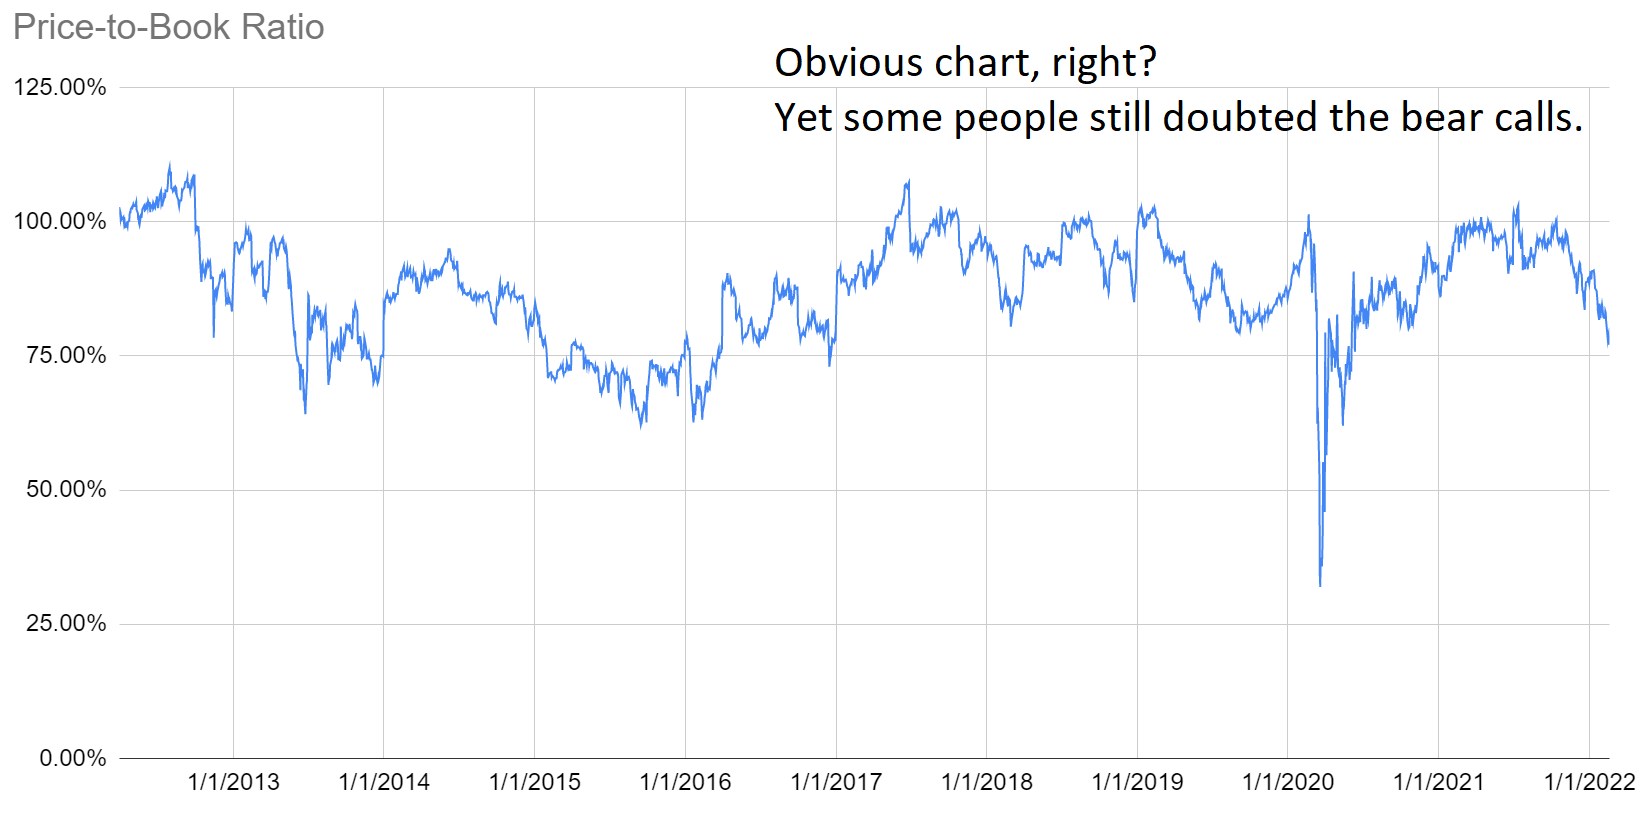
Here’s a price-to-trailing-book-ratio chart that helps with the concept:
The REIT Forum
You can see clearly that there’s probably a good trading opportunity if shares are around a 20% discount to book. But if shares prices are trading near book value (or above, obviously if prices are above book value) the risk to reward ratio is trash.
So what happened to mortgage REITs? The spreads between agency MBS and Treasuries was tight, but leverage remained high. As those spreads widened out and as rates began to climb, book value took a substantial hit. How can you handle that? I just trade in and out to take advantage of unusually large discounts to book value, but that’s just me. Feel free to find someone who can tell you to hold for the yield and ignore the price movements.
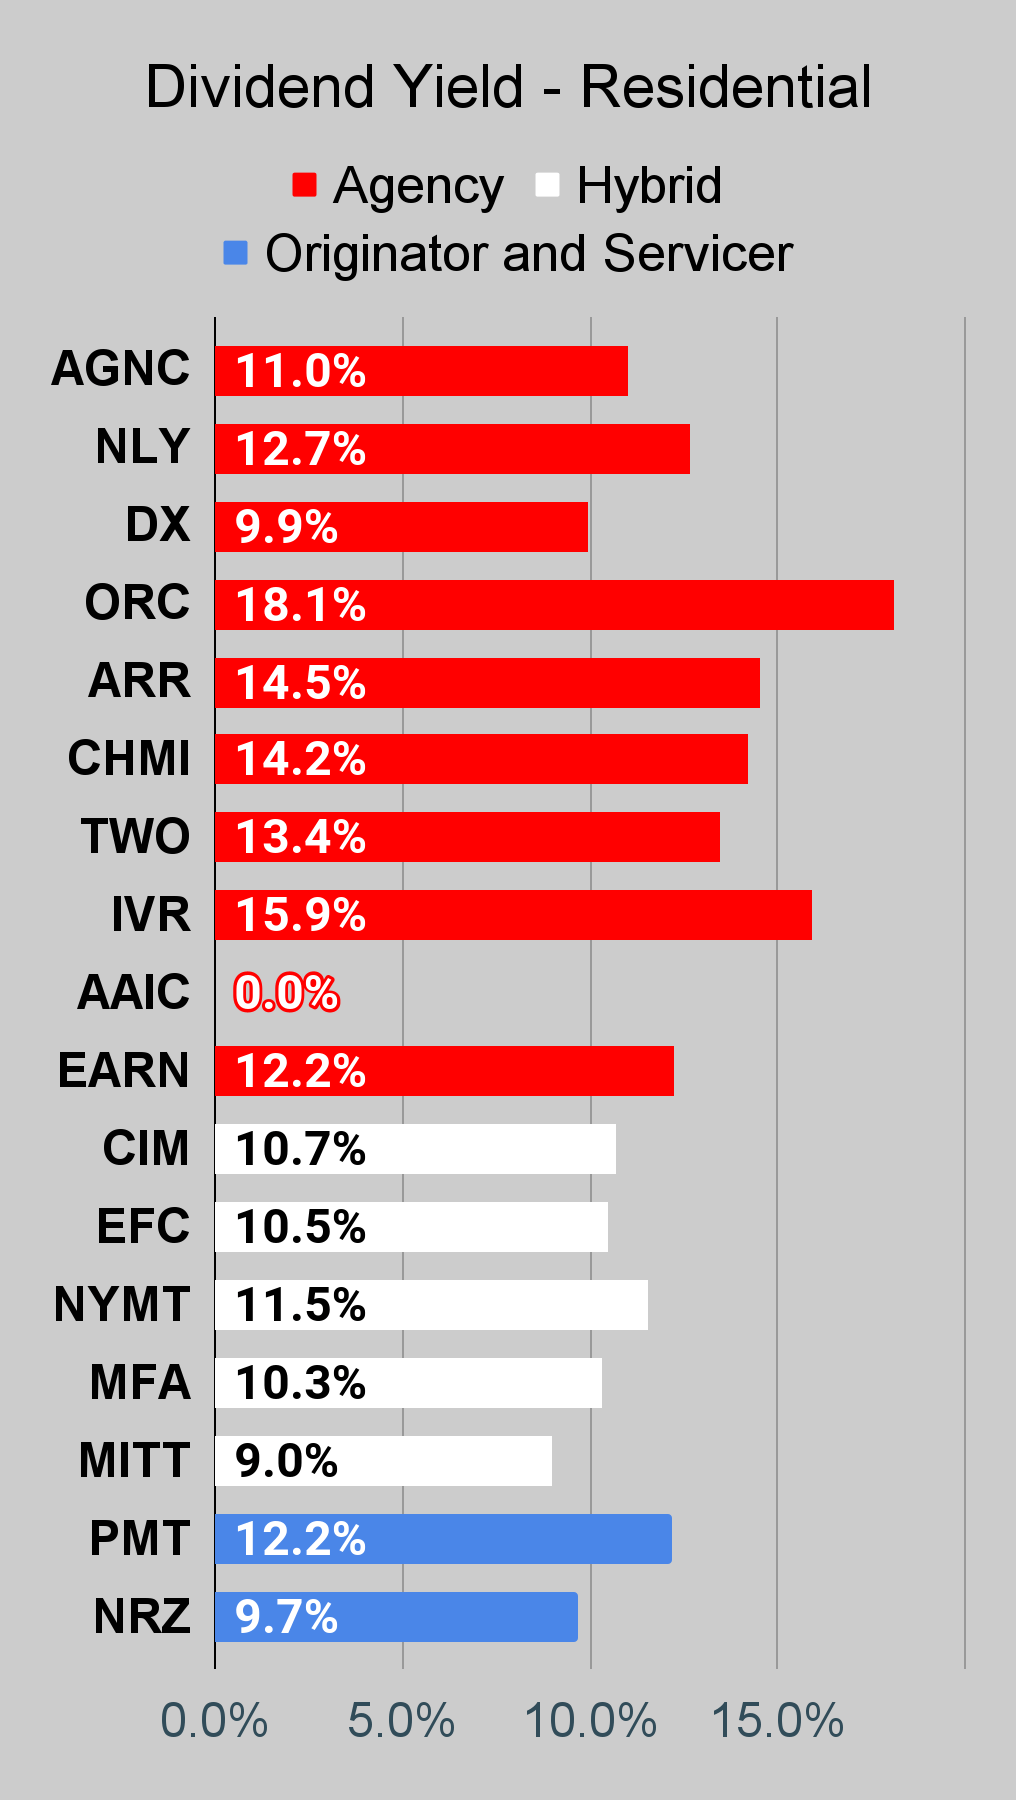
Do we own any mortgage REITs? Sure. Both common and preferred shares. Some of the mortgage REITs got beaten down much too hard and those shares are offering a compelling bargain today. However, the risk/reward ratio on the different mortgage REITs is still heavily tilted to favor some investments over others. Buying based on dividend yield leads many investors to buy fool’s yield. It’s like fool’s gold, but it comes with posting confidently incompetent statements.
How could you know about the changes in book value before getting wrecked? Well, we posted weekly articles, estimates, trade alerts, and so on. What did you want? Big graphics? We did that too.
Want a bullish rating? Alright, I’d include one. PMT got hammered too hard. Shares are trading at a 15% discount to our recent estimated book value. Not Q4 2021 book value, but estimated BV for 2/18/2022. How do we get those estimates? Work.
While you’re here, I should point out that there a TON of great bargains going on in the preferred shares also. We just opened a new position today.
The rest of the charts in this article may be self-explanatory to some investors. However, if you’d like to know more about them, you’re encouraged to see our notes for the series.
Stock Table
We will close out the rest of the article with the tables and charts we provide for readers to help them track the sector for both common shares and preferred shares.
We’re including a quick table for the common shares that will be shown in our tables:
Let the images begin!
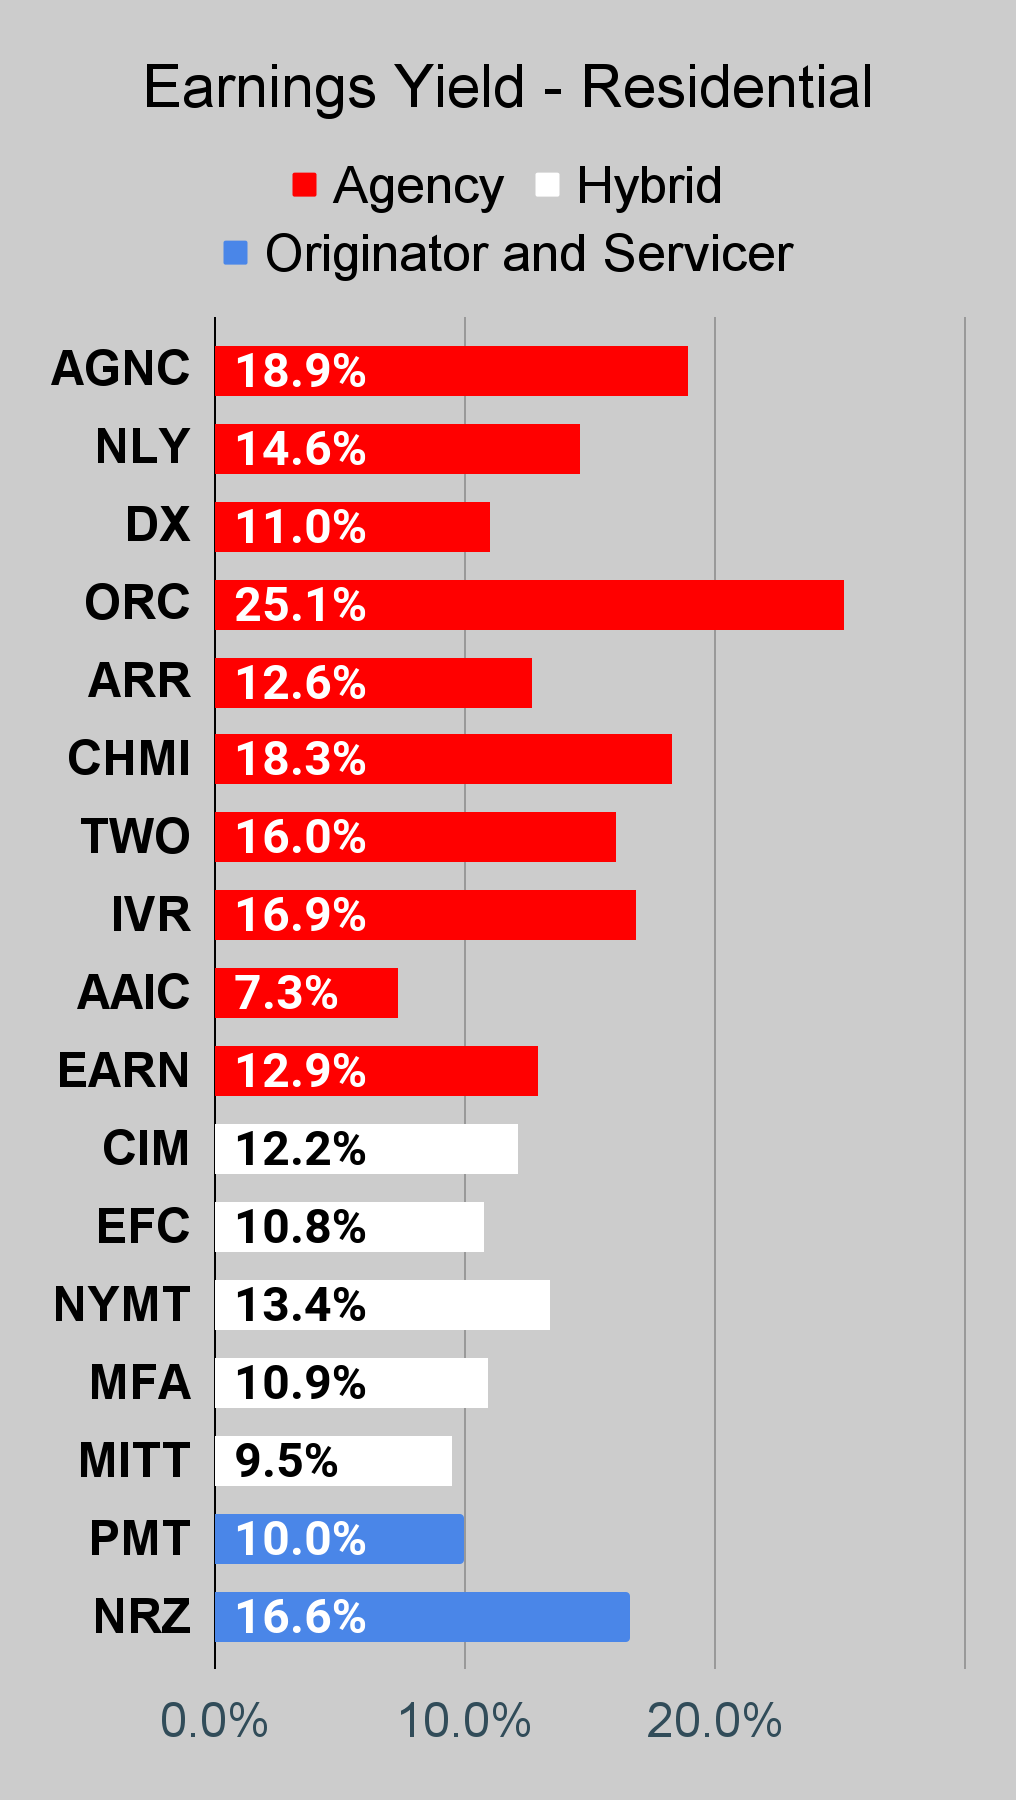
Residential Mortgage REIT Charts
 The REIT Forum |
 The REIT Forum |
 The REIT Forum |
Source: The REIT Forum
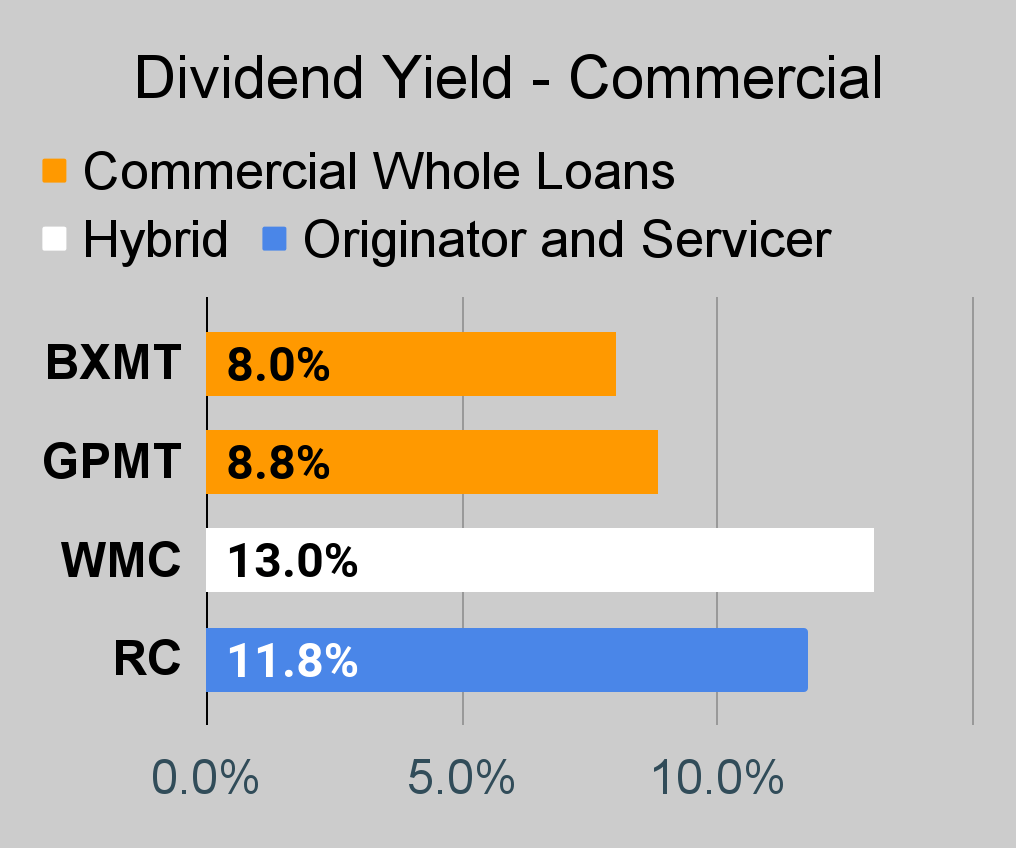
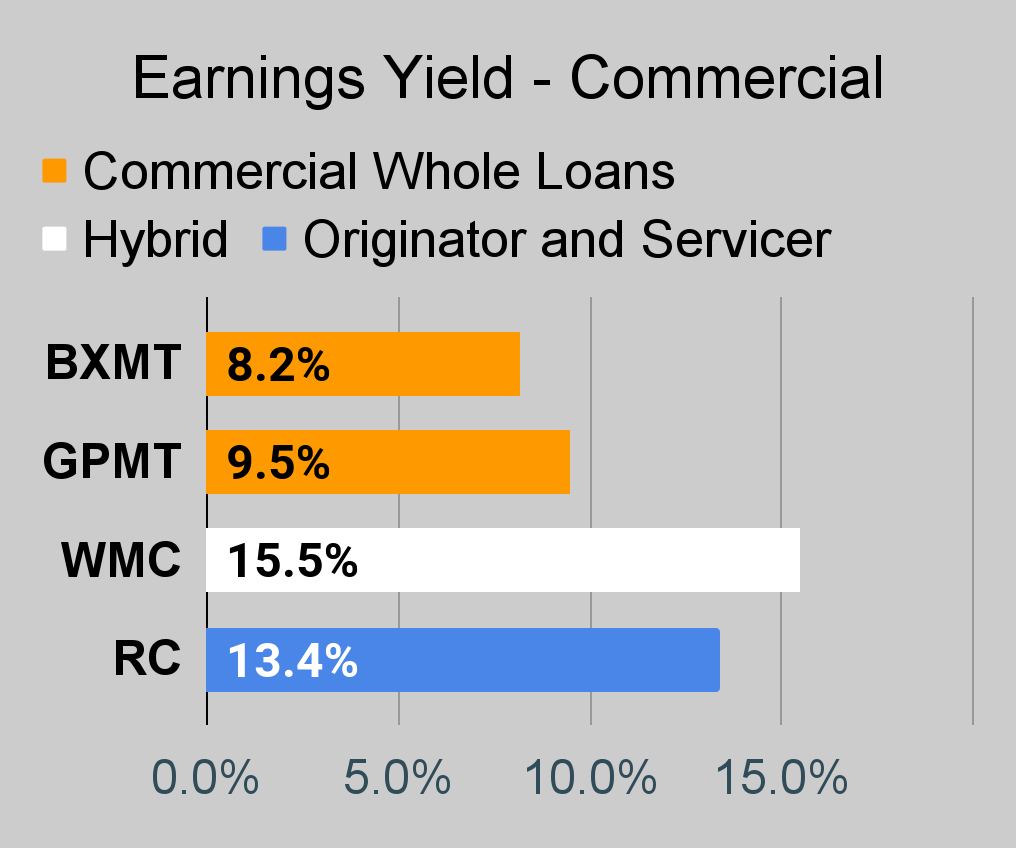
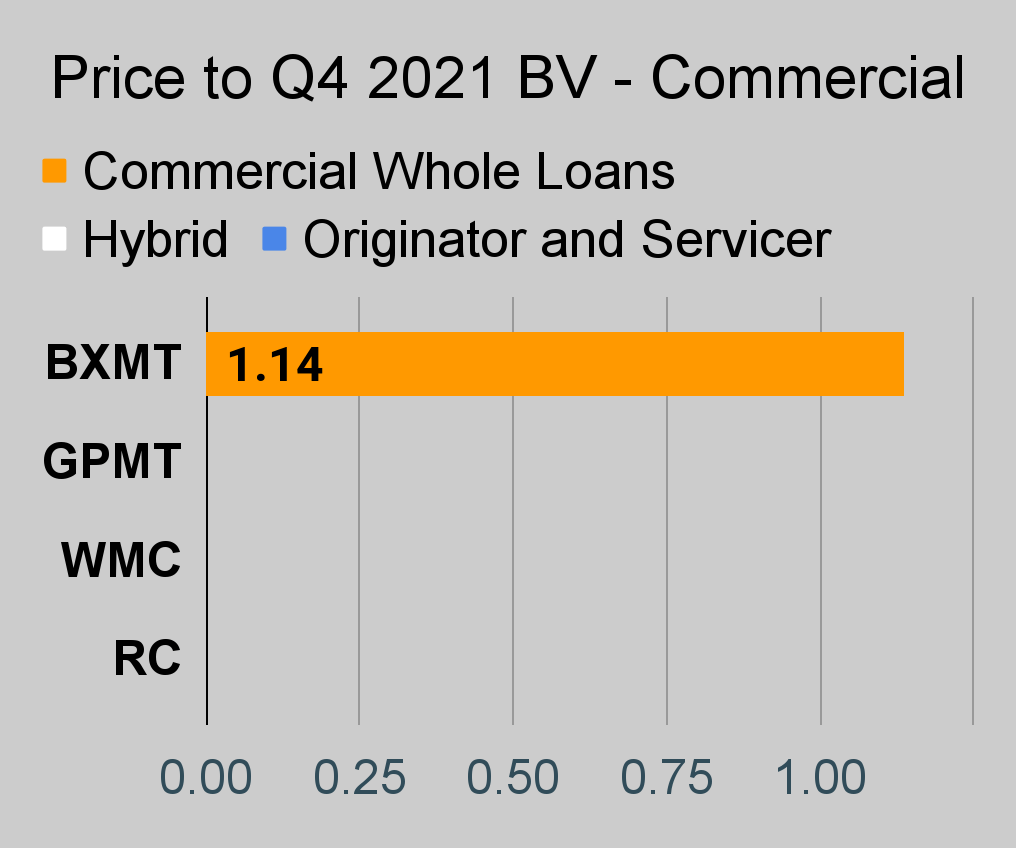
Commercial Mortgage REIT Charts
 The REIT Forum |
 The REIT Forum |
 The REIT Forum |
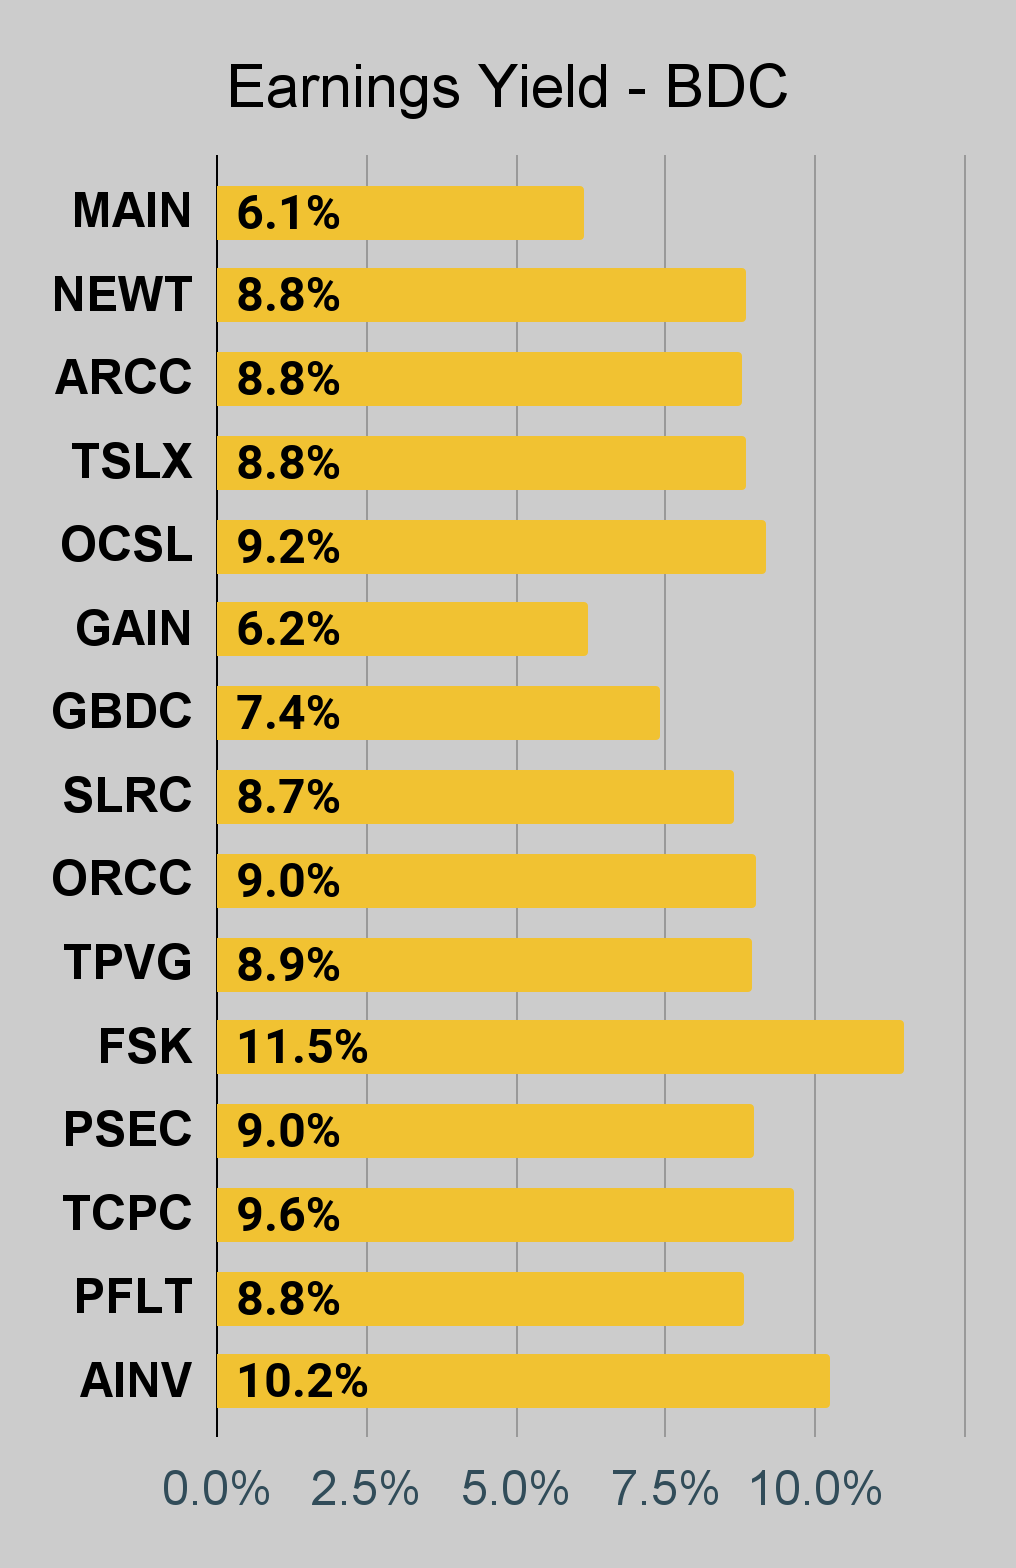
BDC Charts
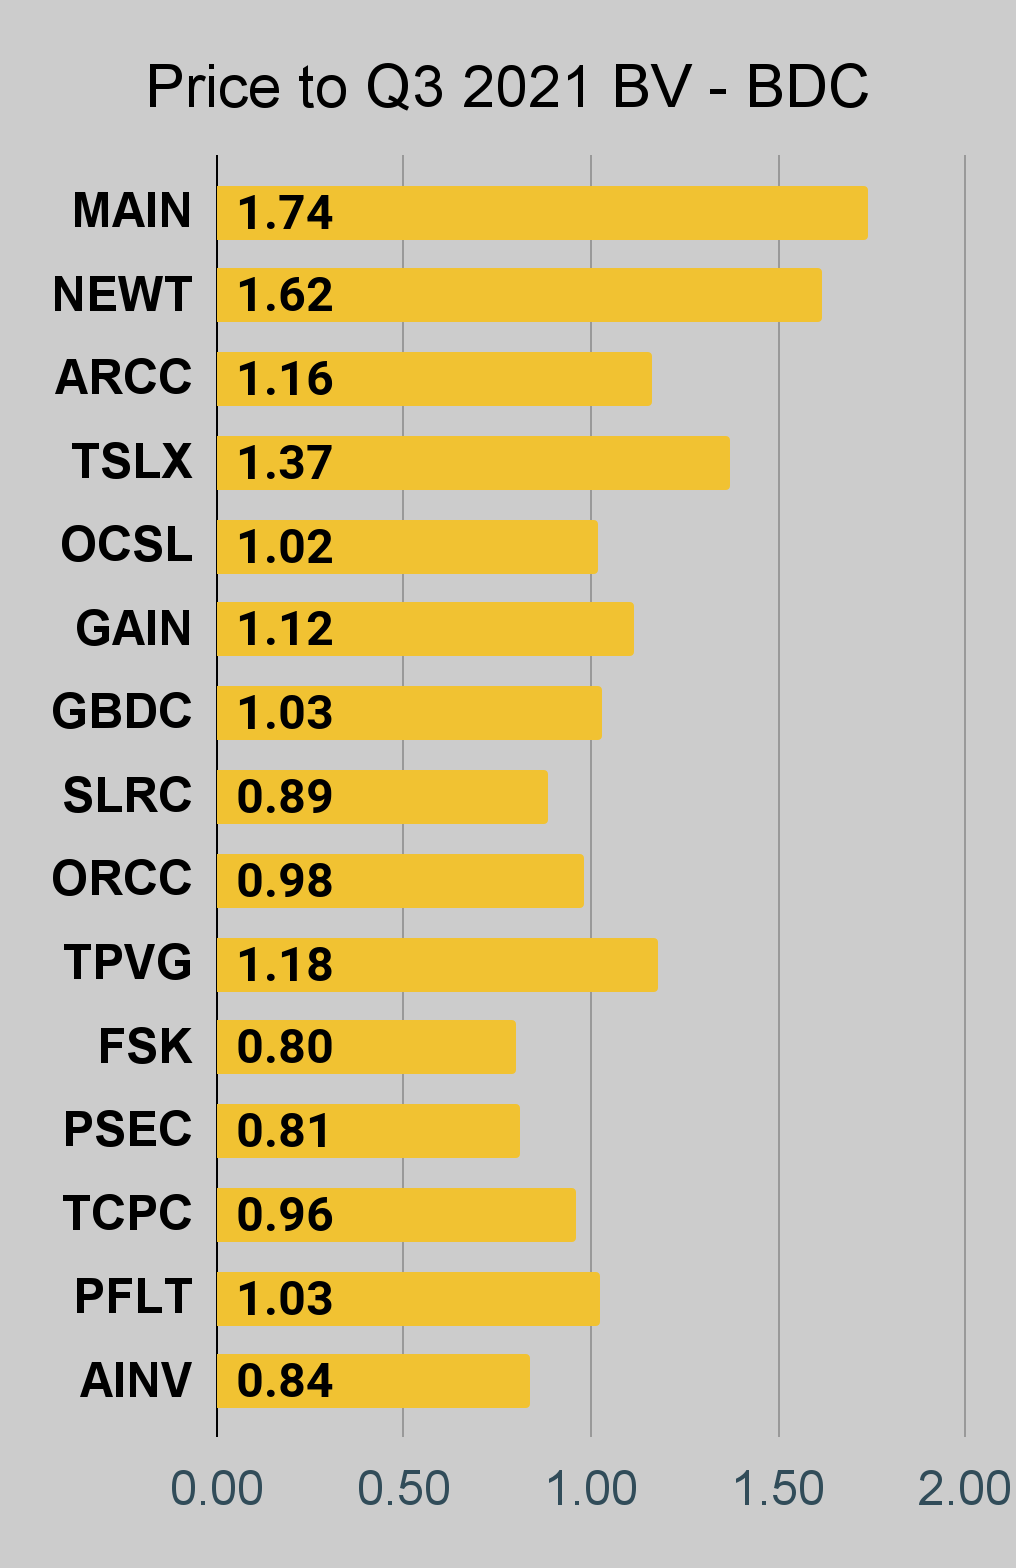 The REIT Forum |
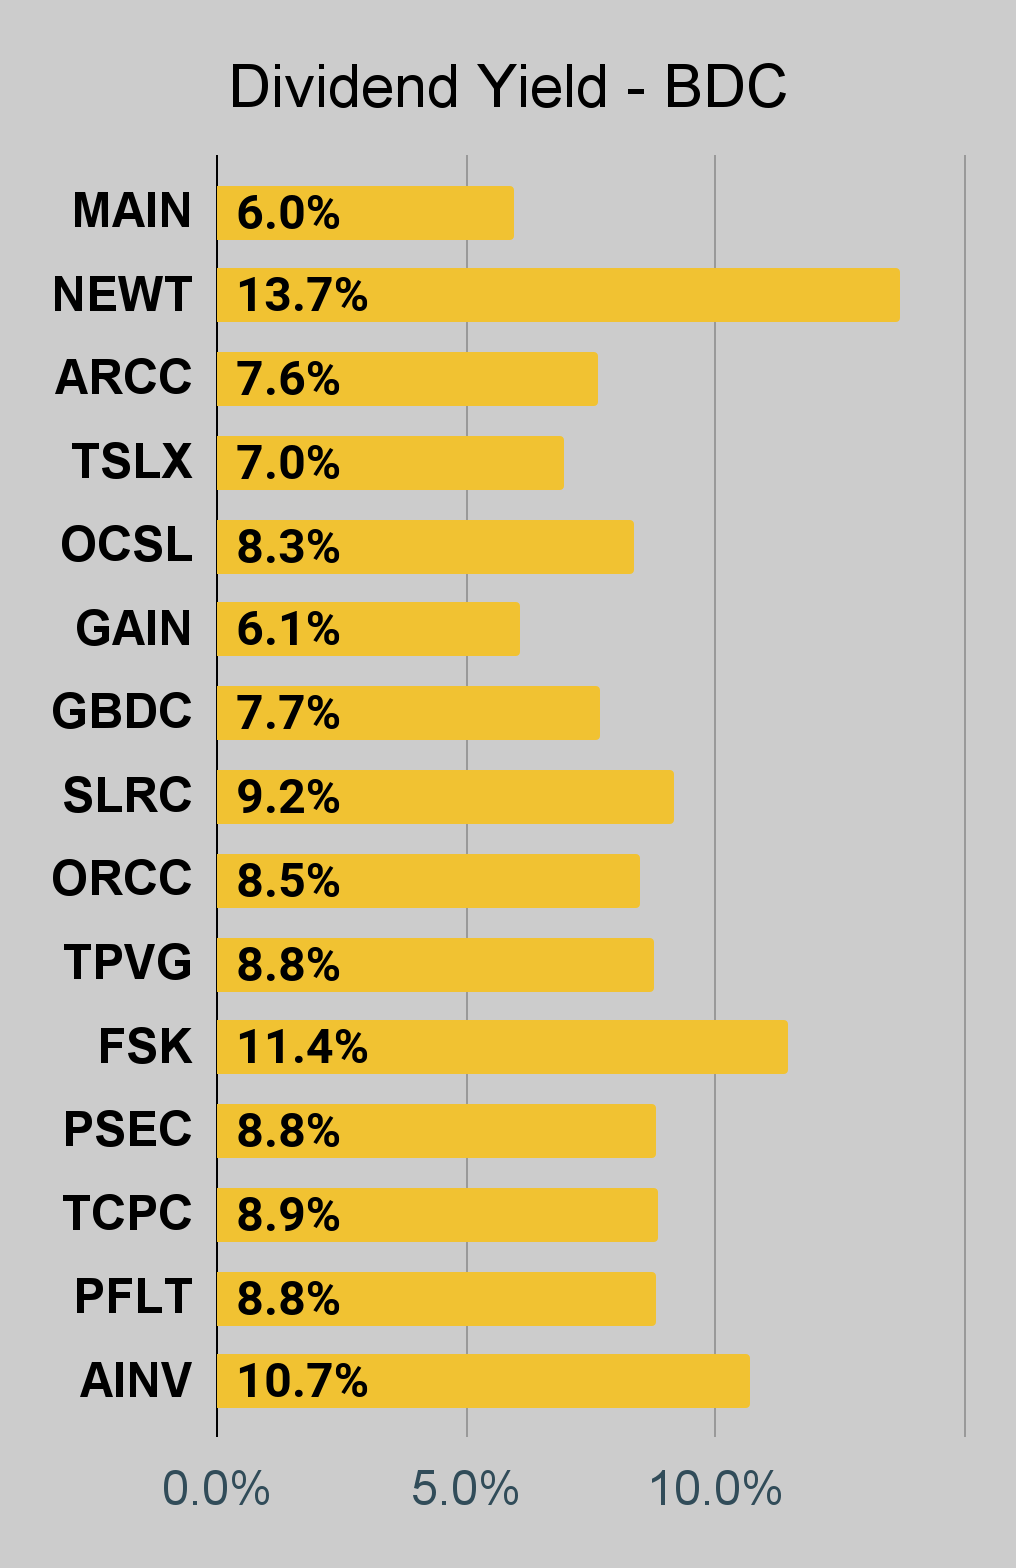 The REIT Forum |
 The REIT Forum |
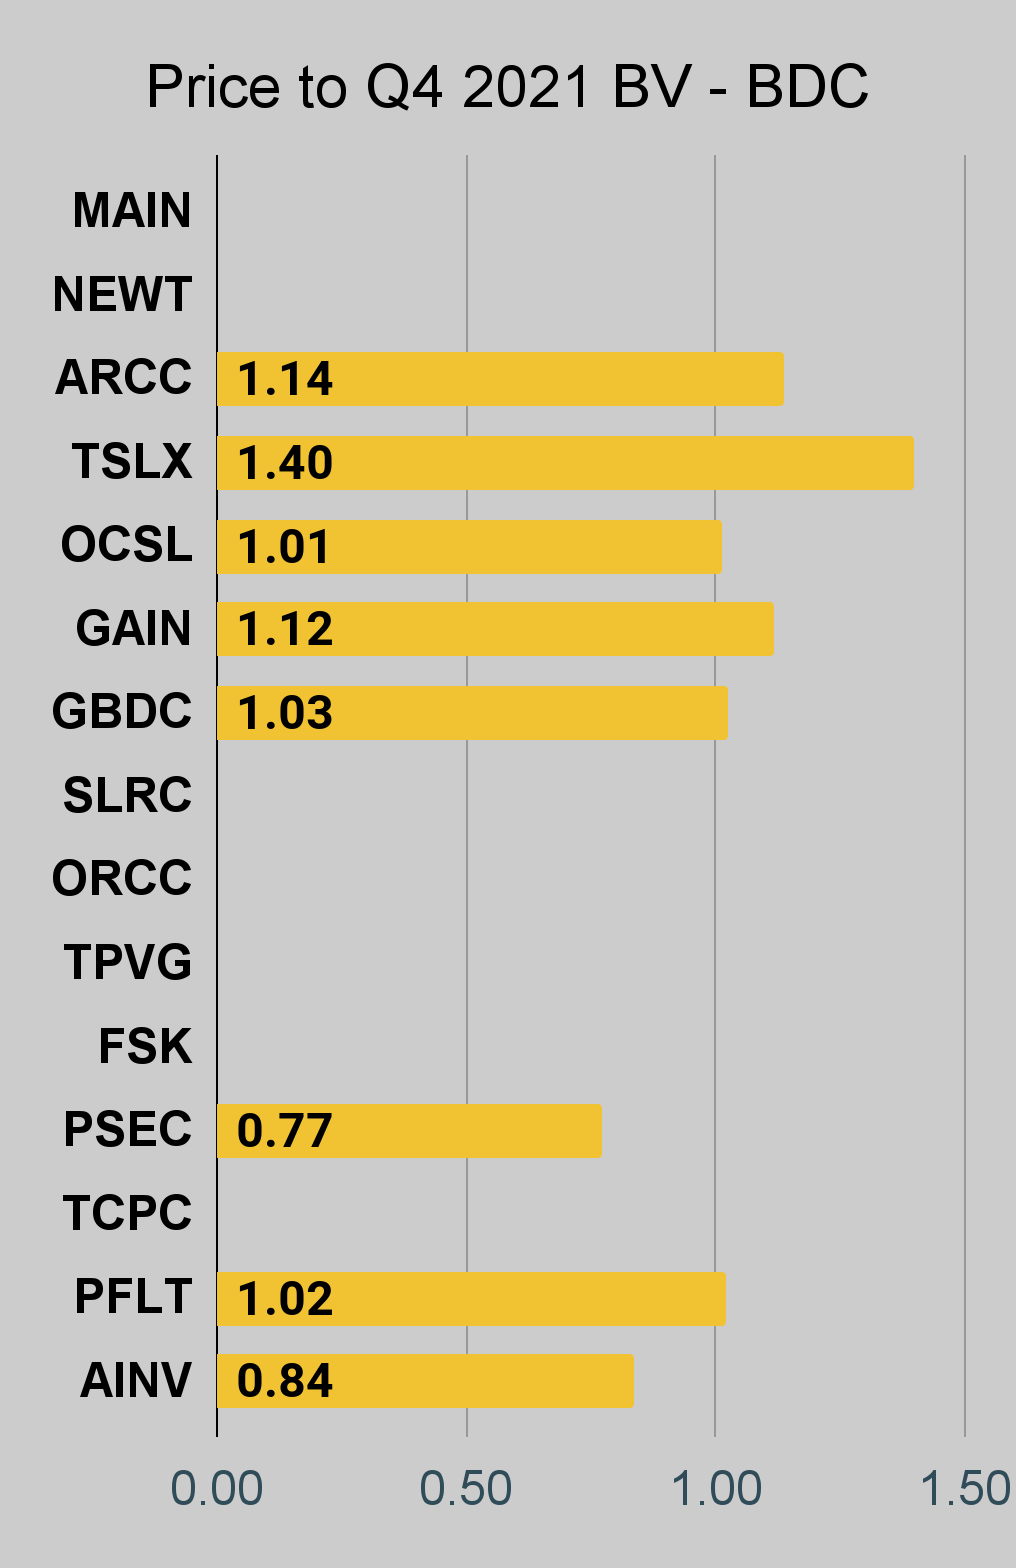
Q4 2021 Charts
Several of these companies have not reported Q4 2021 values yet. If they have not reported, or reported very recently, they will not have a bar in the following charts:
 The REIT Forum |
 The REIT Forum |
 The REIT Forum |
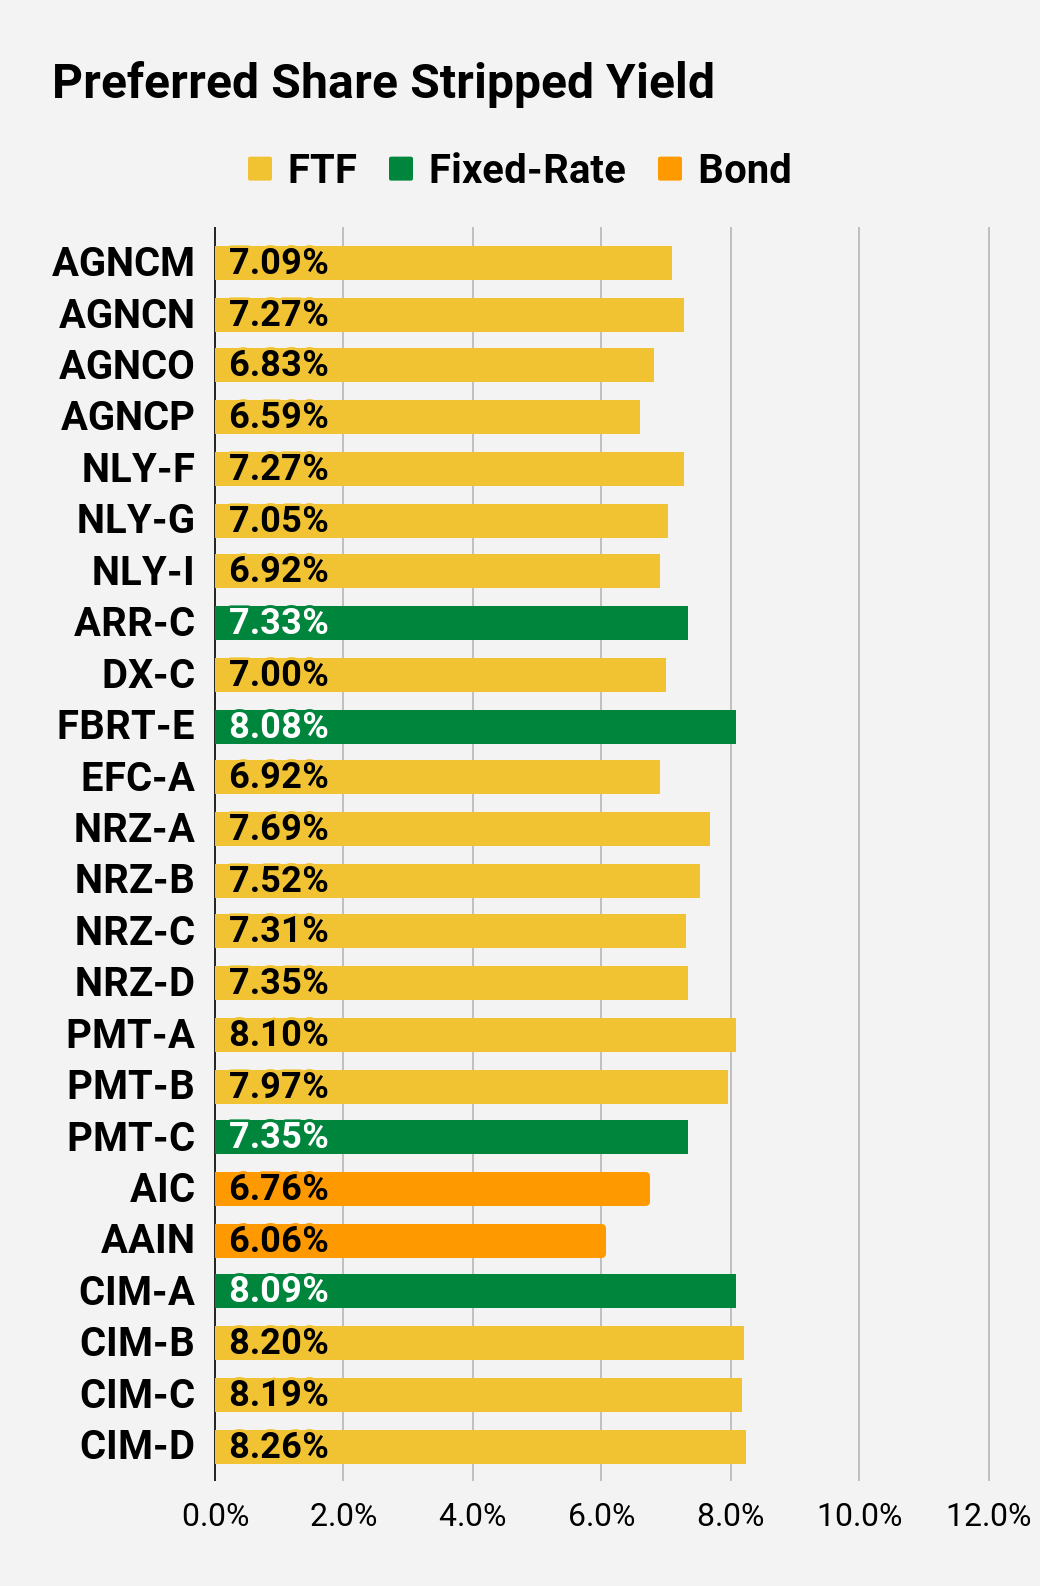
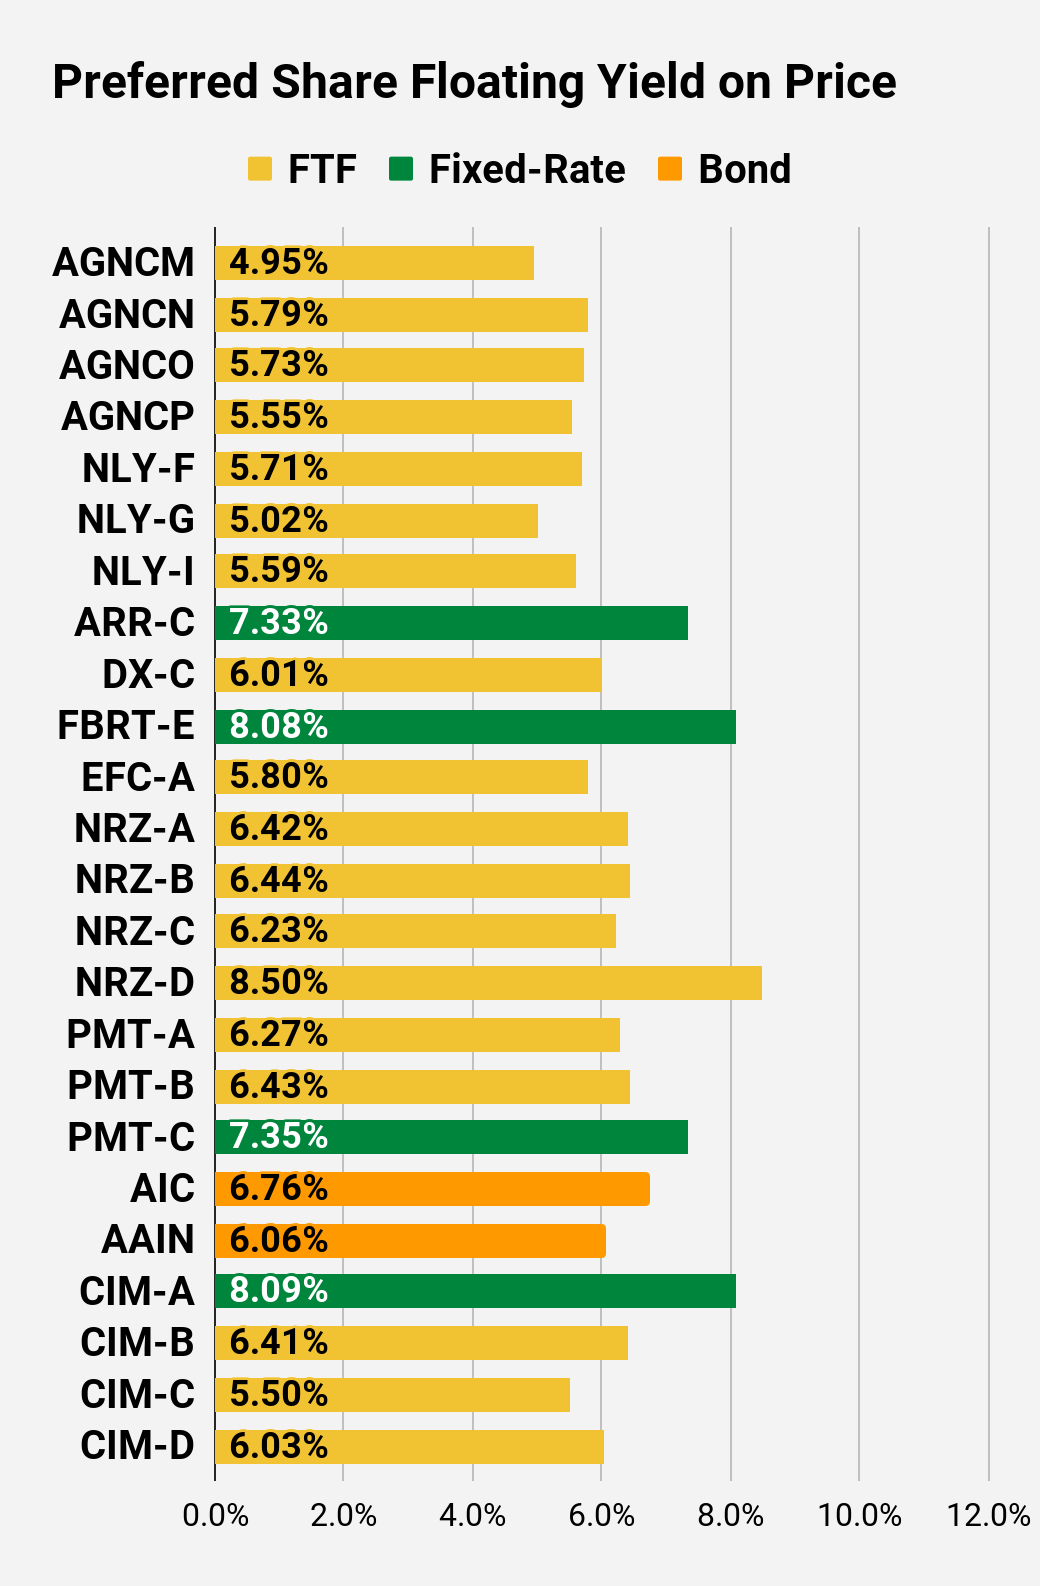
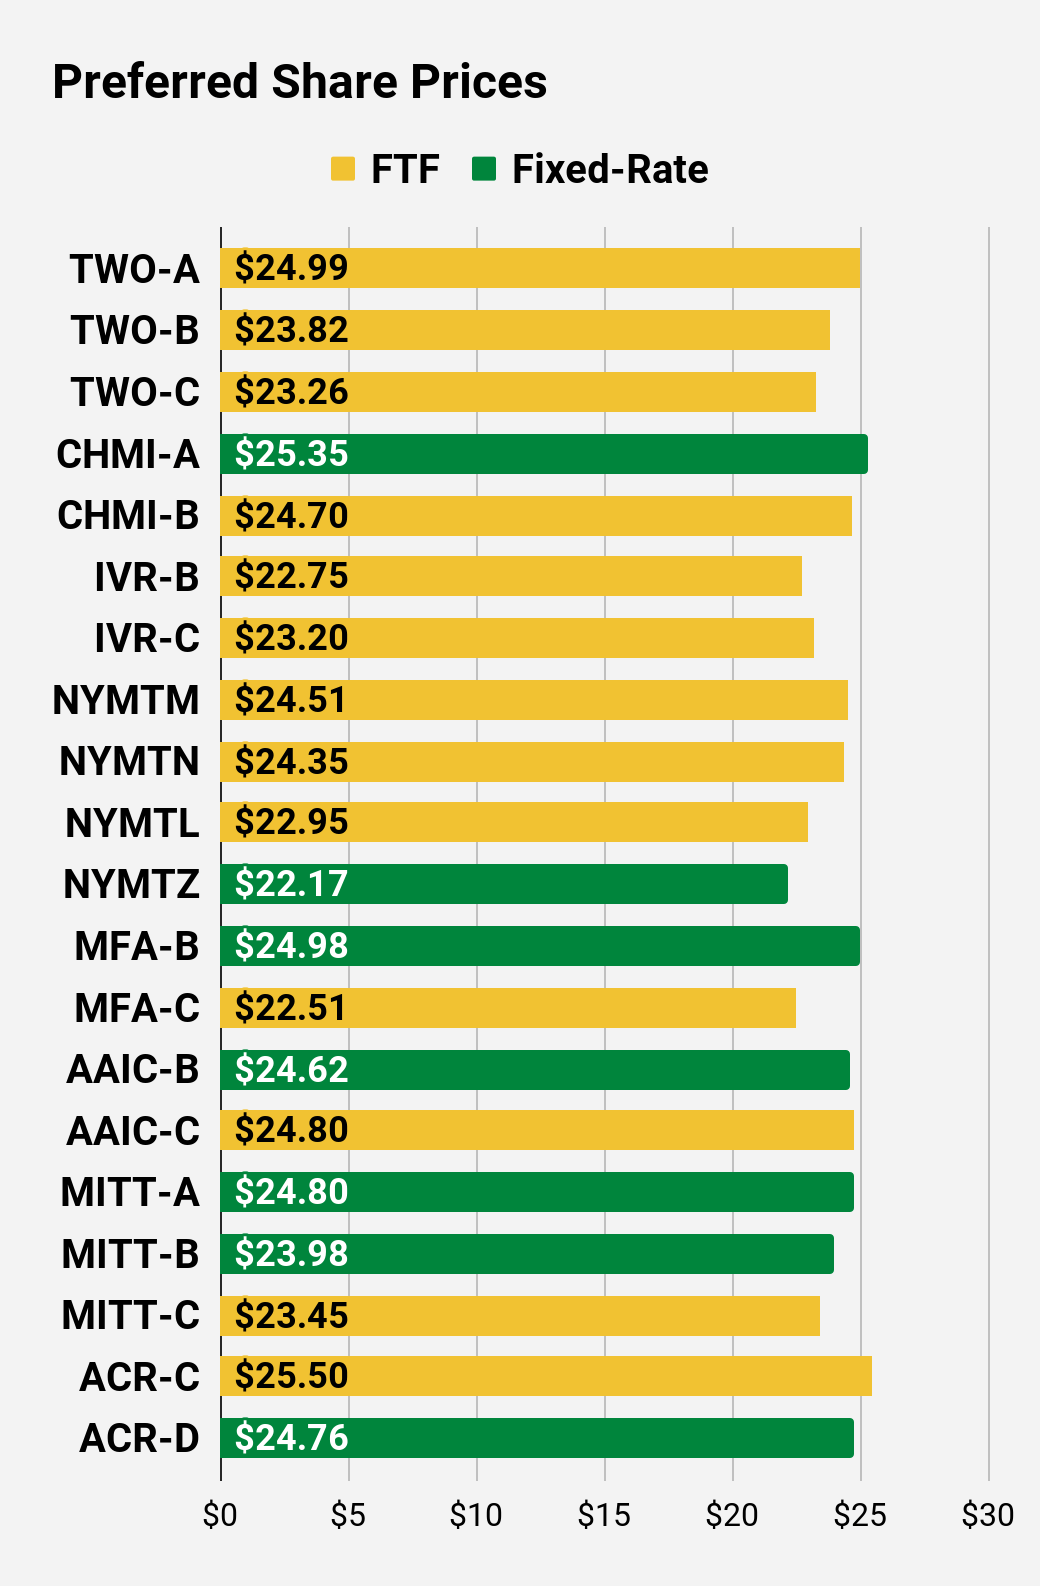
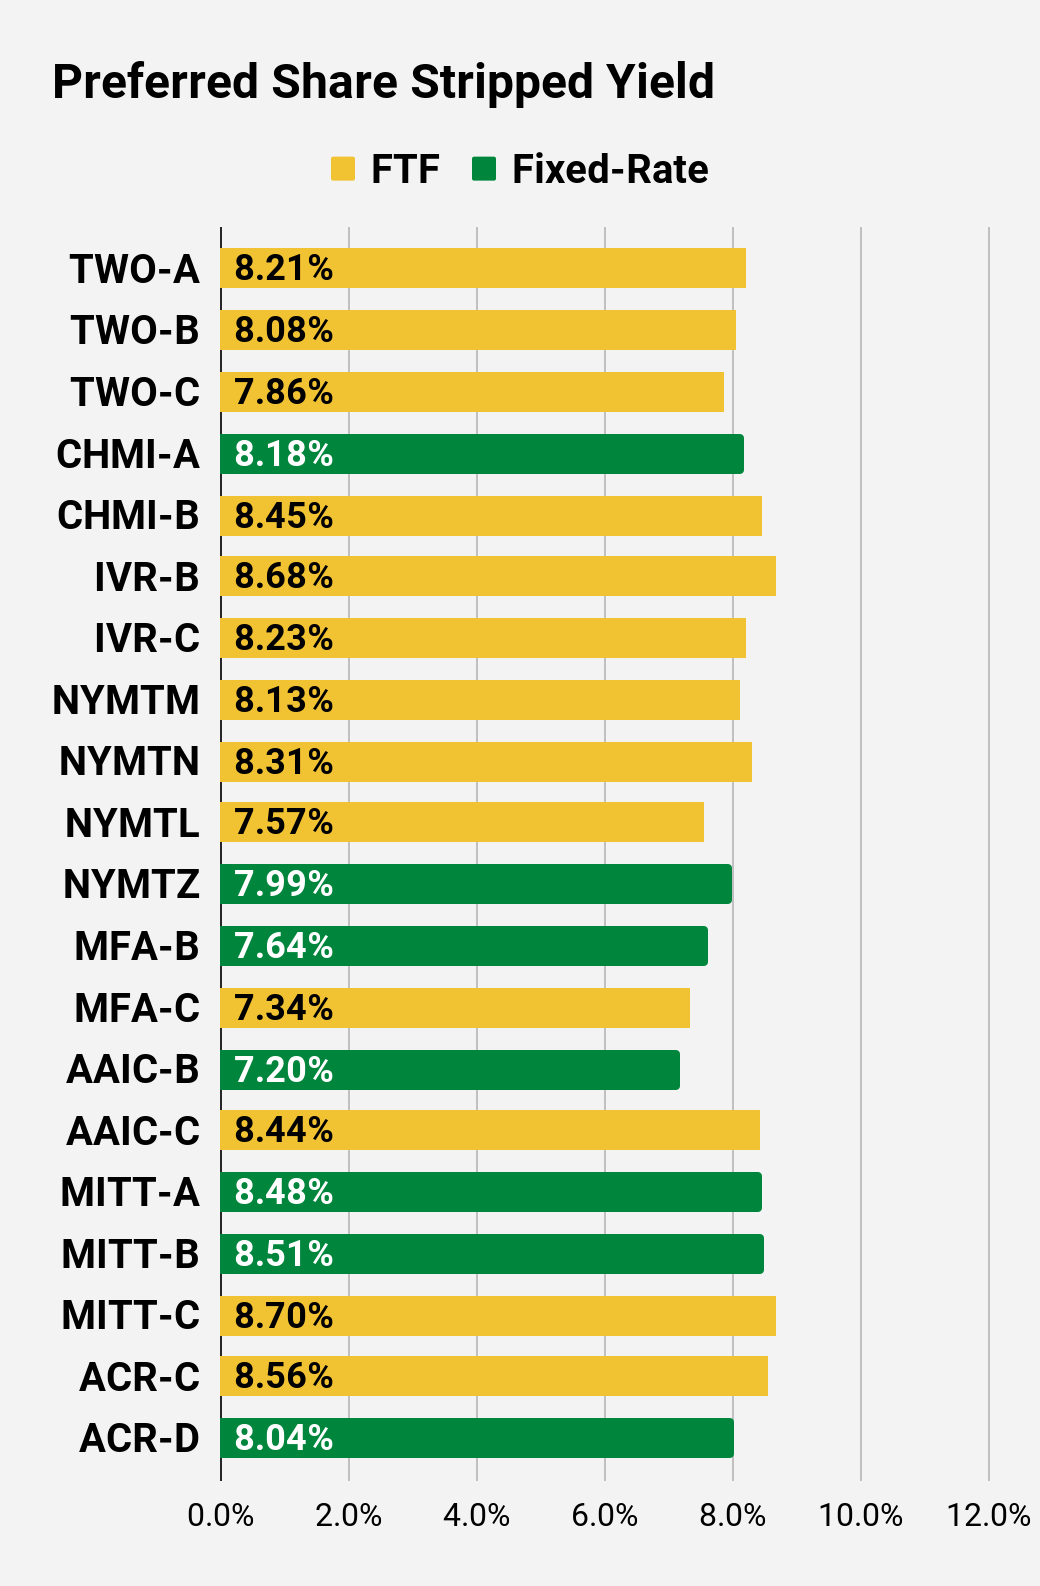
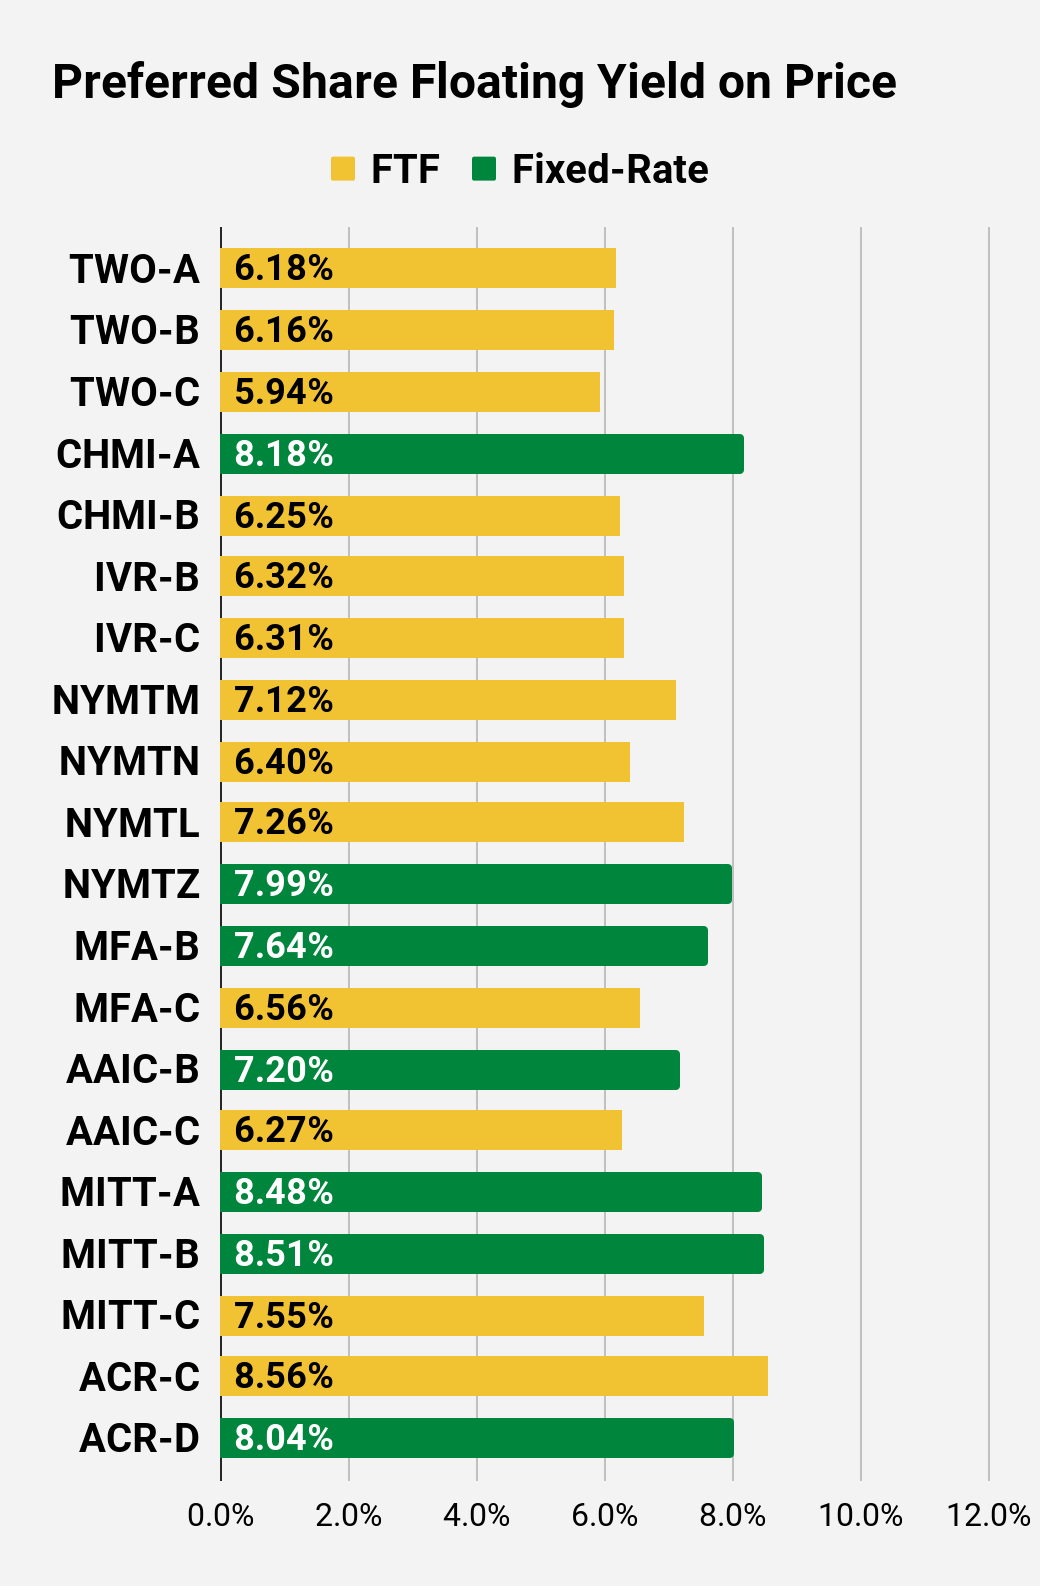
Preferred Share Charts
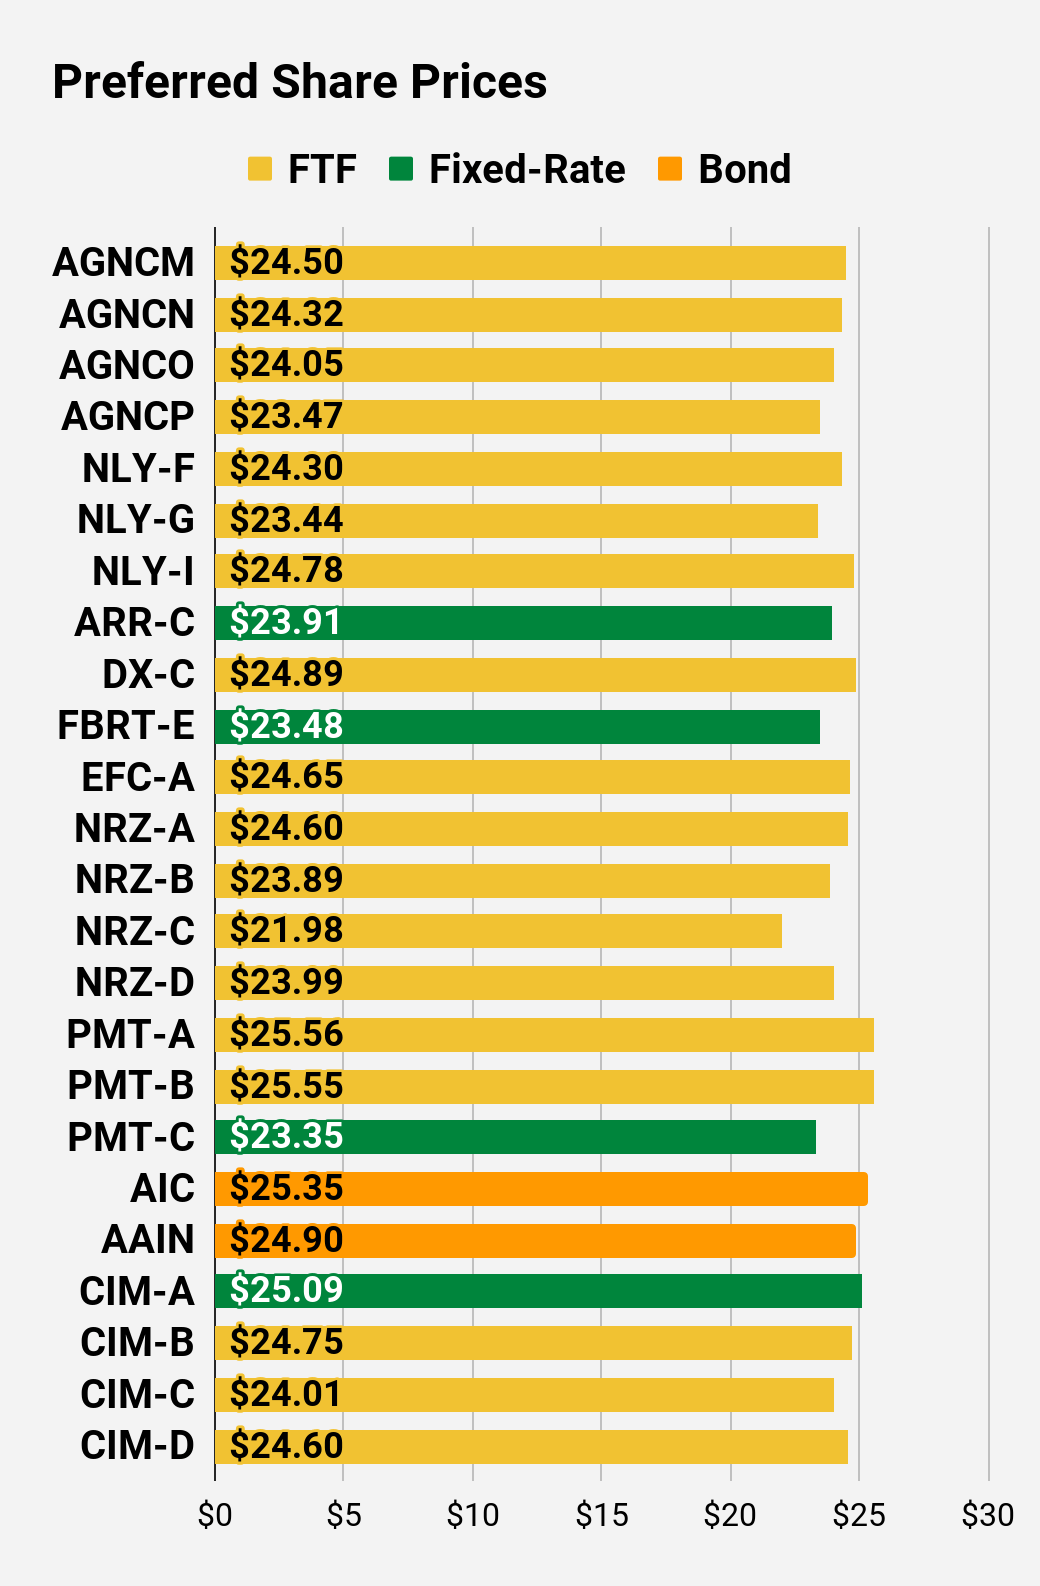 The REIT Forum |
 The REIT Forum |
 The REIT Forum |
 The REIT Forum |
 The REIT Forum |
 The REIT Forum |
Preferred Share Data
Beyond the charts, we’re also providing our readers with access to several other metrics for the preferred shares.
After testing out a series on preferred shares, we decided to try merging it into the series on common shares. After all, we are still talking about positions in mortgage REITs. We don’t have any desire to cover preferred shares without cumulative dividends, so any preferred shares you see in our column will have cumulative dividends. You can verify that by using Quantum Online. We’ve included the links in the table below.
To better organize the table, we needed to abbreviate column names as follows:
- Price = Recent Share Price – Shown in Charts
- BoF = Bond or FTF (Fixed-to-Floating)
- S-Yield = Stripped Yield – Shown in Charts
- Coupon = Initial Fixed-Rate Coupon
- FYoP = Floating Yield on Price – Shown in Charts
- NCD = Next Call Date (the soonest shares could be called)
- Note: For all FTF issues, the floating rate would start on NCD.
- WCC = Worst Cash to Call (lowest net cash return possible from a call)
- QO Link = Link to Quantum Online Page
Second Batch:
Strategy
Our goal is to maximize total returns. We achieve those most effectively by including “trading” strategies. We regularly trade positions in the mortgage REIT common shares and BDCs because:
- Prices are inefficient.
- Long-term, share prices generally revolve around book value.
- Short-term, price-to-book ratios can deviate materially.
- Book value isn’t the only step in analysis, but it is the cornerstone.
We also allocate to preferred shares and equity REITs. We encourage buy-and-hold investors to consider using more preferred shares and equity REITs.
Performance
We compare our performance against four ETFs that investors might use for exposure to our sectors:
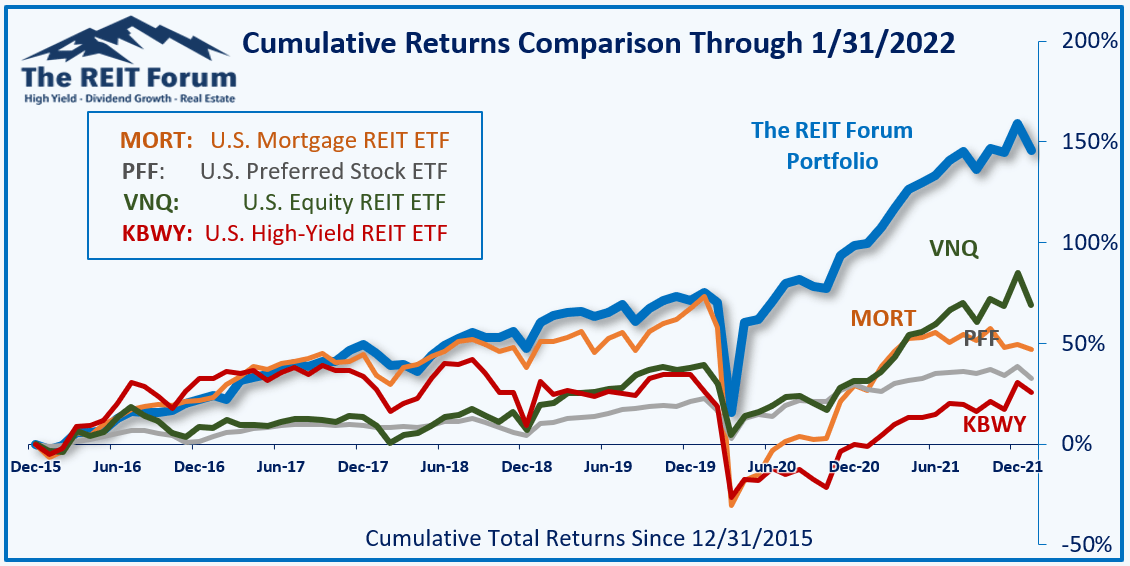
The REIT Forum
Source: The REIT Forum
The four ETFs we use for comparison are:
|
Ticker |
Exposure |
|
One of the largest mortgage REIT ETFs |
|
|
One of the largest preferred share ETFs |
|
|
Largest equity REIT ETF |
|
|
The high-yield equity REIT ETF. Yes, it has been dreadful. |
When investors think it isn’t possible to earn solid returns in preferred shares or mortgage REITs, we politely disagree. The sector has plenty of opportunities, but investors still need to be wary of the risks. We can’t simply reach for yield and hope for the best. When it comes to common shares, we need to be even more vigilant to protect our principal by regularly watching prices and updating estimates for book value and price targets.
Ratings:
Editor’s Note: This article discusses one or more securities that do not trade on a major U.S. exchange. Please be aware of the risks associated with these stocks.
Be the first to comment