

Toss more fuel onto the fire because book value is going up in flames. Neil Jacobs/Getty Images News
Get ready for charts, images, and tables because they are better than words. The ratings and outlooks we highlight here come after Scott Kennedy’s weekly updates in the REIT Forum. Your continued feedback is greatly appreciated, so please leave a comment with suggestions.
Today we’re going to talk about the common shares. It’s been a rough week for mortgage REITs with some notable dips. In March 2022, we saw mortgage REIT prices perform quite well despite a huge increase in interest rates which is contributing to a sharp reduction in book values across the sector.
Despite the significant drops in share prices, there are some mortgage REITs where we believe book value has been falling even faster than share prices. For instance, we still see Cherry Hill Mortgage (CHMI) trading at a high price-to-book ratio. A ratio that is greater than 1.00. Now, if you look at the chart for price-to-trailing-book-value, you may think CHMI is only trading at 86% of trailing book value. So, when I tell you we think it is still trading at a premium to current book value, you can figure out that we must be projecting a decline in book value greater than 14%.
There’s a free rating for the article; we’re bearish on CHMI at $7.40. The after-hours market has it at $7.54, which would be an even better price for dumping shares.
Why are book values down across the sector? MBS (Mortgage-backed securities) prices are down. The losses should outweigh gains from LIBOR swaps, shorting Treasury futures contracts, and positions in MSRs (mortgage-servicing rights).
There was also that issue with the yield curve:
Federal Reserve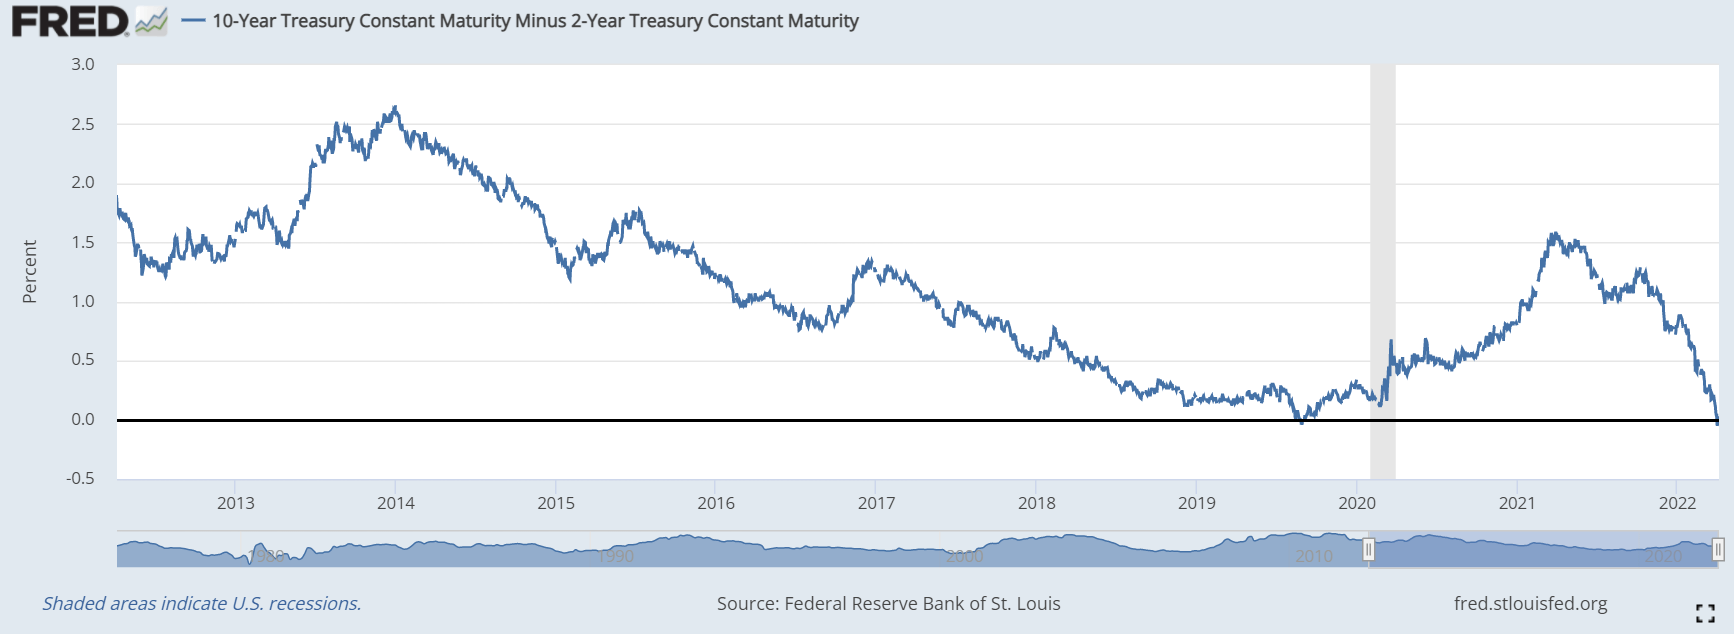
This is one of the simplest measures for the shape of the yield curve. The Federal Reserve has a greater impact on short-term rates than it does on long-term rates. While the Federal Reserve has succeeded in pushing the entire curve higher, it moved short-term rates significantly more than short-term rates.
This isn’t great for mortgage REITs, but it is far from a death sentence. Investors who focus on the yield curve often dramatically overestimate its importance. As we demonstrated in Annaly Capital Management and The Yield Curve (subscriber link), even if you knew the shape of the yield curve in advance, it wouldn’t have helped you pick when to buy or sell mortgage REITs. It simply doesn’t have much predictive power when used in isolation. Further, this flattening of the curve has far less impact on book value than the general increase in interest rates and the spreads between fixed-rate agency MBS and Treasury rates.
Want to see what happened to book value?
This is the valuation on a generic pool of 30-year fixed-rate MBS with a 3.0 coupon rate:
MBS Live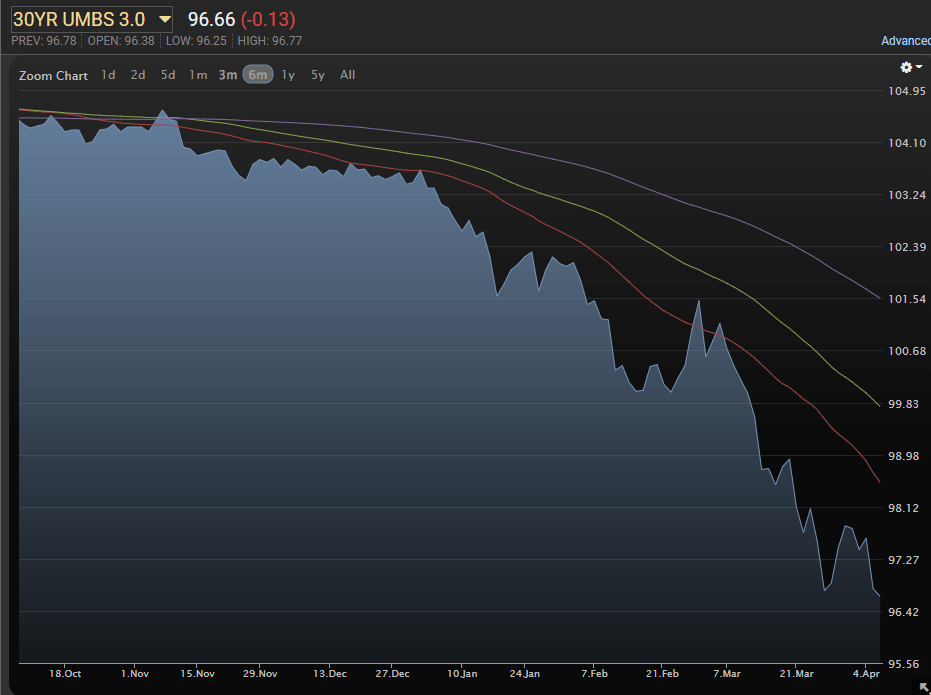
The chart is set to show the last 6 months. See how it was trending slightly lower heading into January? It got wrecked over the subsequent months.
There you go. That is your book value loss. That’s how it happened. A leveraged position in fixed-rate MBS combined with a big increase in interest rates.
The mortgage REITs hedge against rising rates, but they can only hedge so hard. Excessive hedging devours the potential to earn money for shareholders, so management has to be careful about how much to hedge and when.
When a mortgage REIT owns an asset that falls in value from $103.64 to $96.66 in a little over 3 months, that’s not awesome. Toss on some leverage and the REIT really needed to have a great position for their hedges or a different type of assets. Did every MBS fall by that exact amount? No. They own pools with different coupon rates. Are some of the other fixed-rate pools up? No. Don’t be silly. No. Some took bigger or smaller losses, but they didn’t increase in value.
Is there any way to make money in mortgage REITs? Sure. We’ve been very successful by running frequent updates on the estimated book value of the mortgage REITs and then trading shares based on target price-to-book ratios. Using current book value estimates (proprietary to The REIT Forum), let us spot when the risk/reward profile is more or less favorable. That doesn’t mean we succeed on every trade. We aren’t guaranteed to win. The deck isn’t fixed, but it may be stacked. We only want to risk our capital if the deck is stacked in our favor. Most investors are happy to completely ignore the changes and then blame it on “luck”. Funny how that works.
Dividends? A big loss in book value isn’t great for dividends. It isn’t all doom and gloom, as MBS to Treasury spreads have some positive signs, but it’s not a great time for blindly chasing yield. There aren’t many good times for that, but I sure wouldn’t want to be stuck reading some outdated statistics and buying on hope.
Are there any stocks you can own in this sector today? Yeah, there are a few that still look undervalued. There are some mortgage REITs that are positioned to withstand this pressure much better than others. I’ll bring up at least one or two in one of our next few articles. There are also some great choices available in the preferred shares. The market hasn’t been efficient in deciding how hard to sell off each stock. It’s got the right general direction (down), but that’s still far from figuring out the correct adjustments for each.
Scott Kennedy (another author for The REIT Forum) recently provided some commentary about how the losses on MBS can’t be fully offset with hedges:
The issue with Q1 2022 was spread/basis risk (notably widening spreads). Even agency mREITs with a 100% hedging coverage ratio got “whacked” on their BV during Q1 2022. You’ll see this when the mREITs begin reporting Q1 2022 in late April.
To be fair, there really wasn’t too much managers with this particular business model could do to “stem the tide” of notable quarterly BV losses. Even if they increased hedging to say a ratio of 150% during the quarter, MBS spreads widened so much there still would have been a pretty large BV decrease. Again, this trend/event is factored into my/our estimates and recommendation ranges.
Hope that helps.
Scott
The rest of the charts in this article may be self-explanatory to some investors. However, if you’d like to know more about them, you’re encouraged to see our notes for the series.
Stock Table
We will close out the rest of the article with the tables and charts we provide for readers to help them track the sector for both common shares and preferred shares.
We’re including a quick table for the common shares that will be shown in our tables:
Let the images begin!
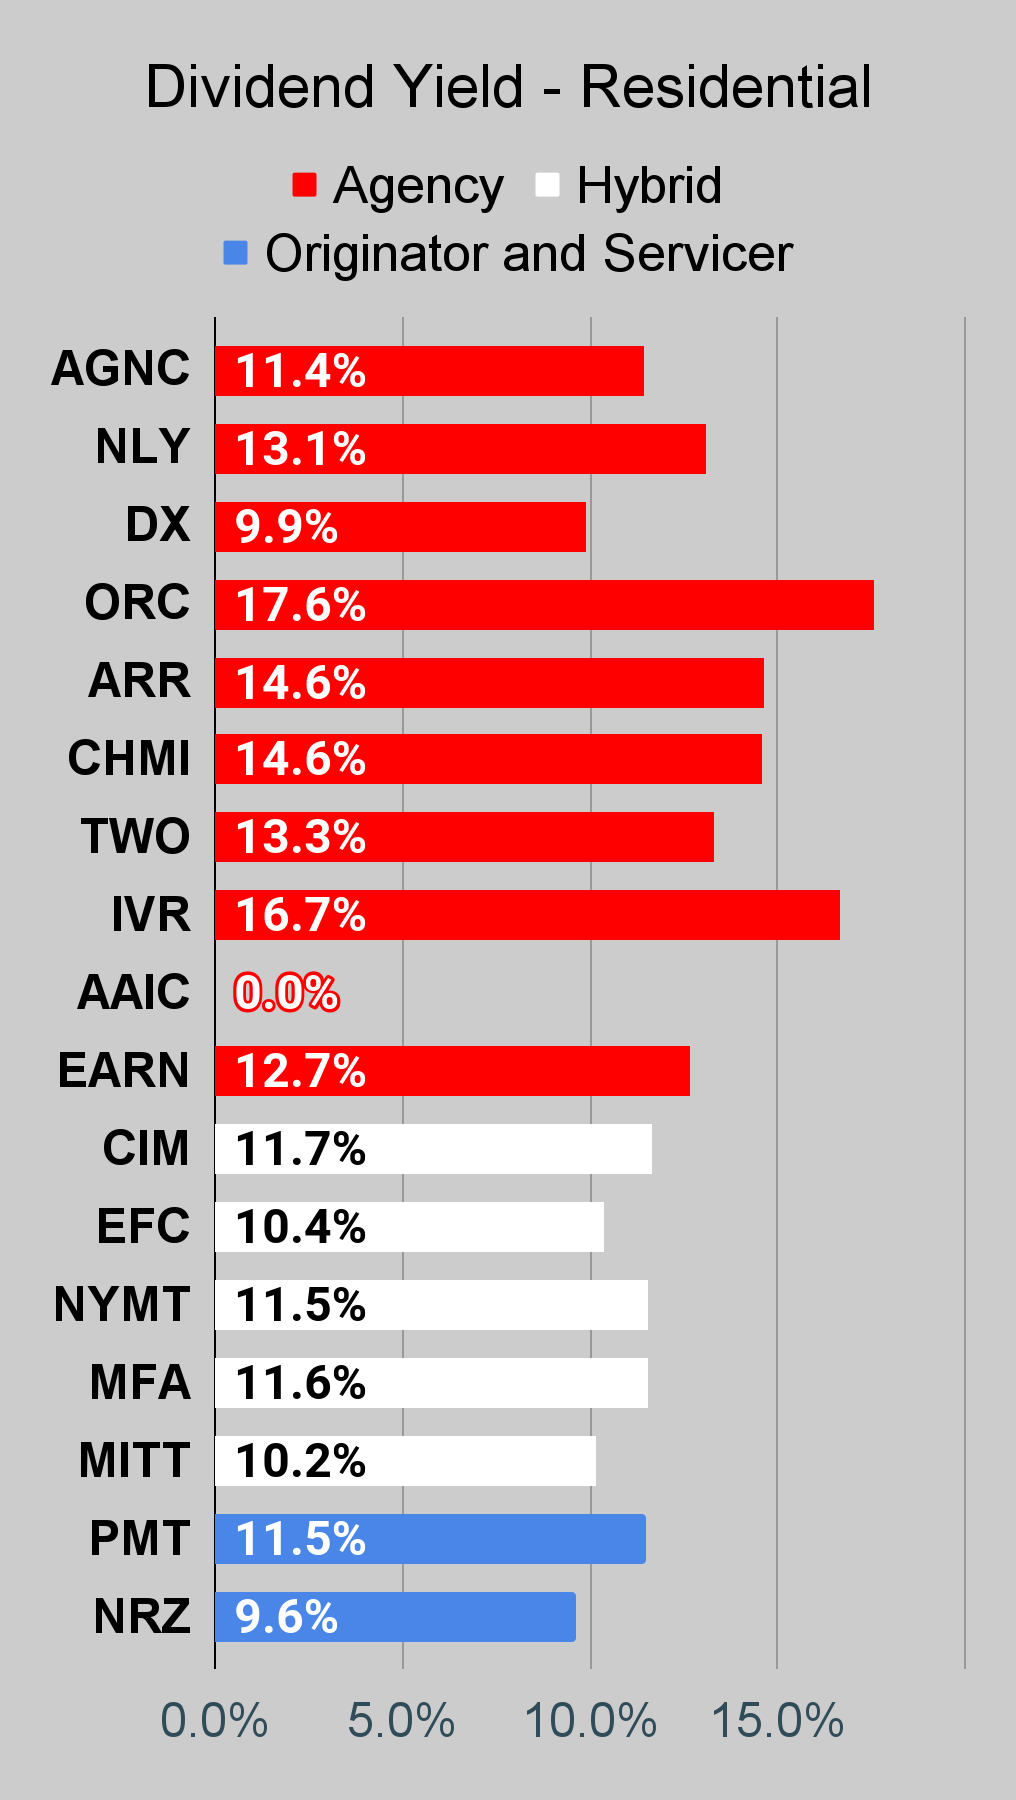
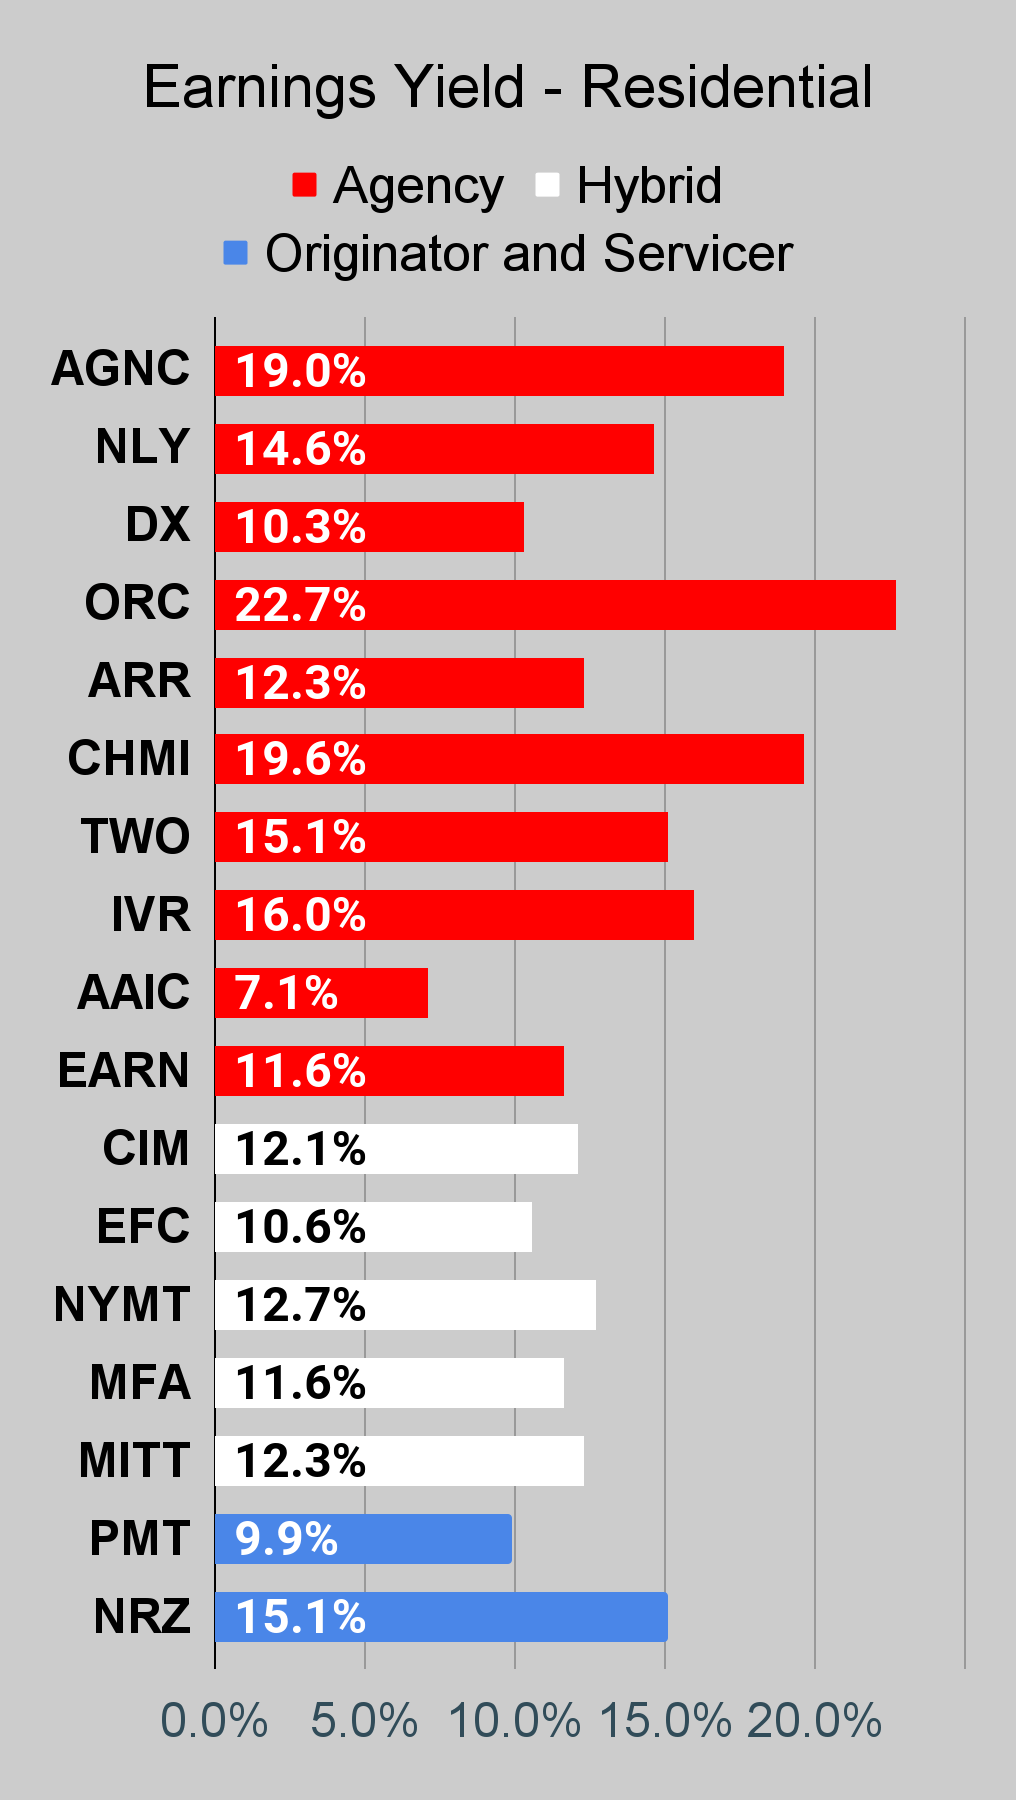
Residential Mortgage REIT Charts
Note: We are modeling some significant changes to BV since 12/31/2021 and some management teams have already publicly indicated a material change in BV per share. The chart for our public articles uses the book value per share from the latest earnings release. Current estimated book value per share is used in reaching our targets and trading decisions. It is available in our service, but those estimates are not included in the charts below.
 The REIT Forum |
 The REIT Forum |
 The REIT Forum |
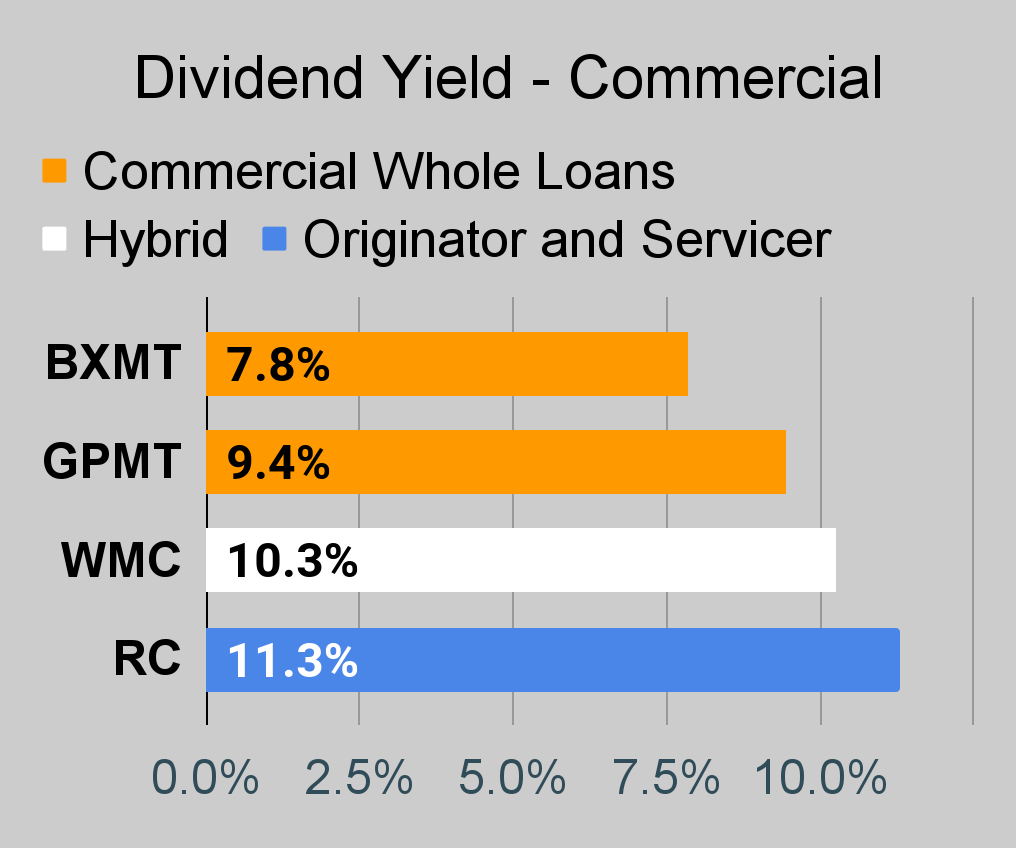
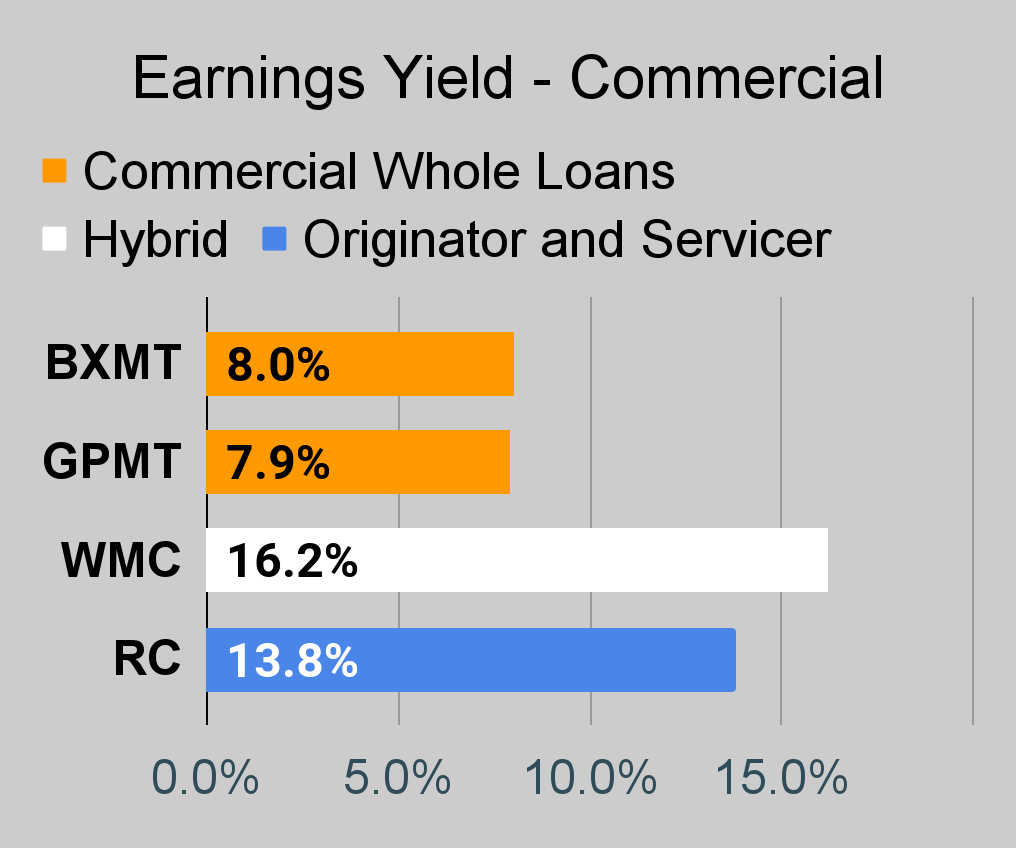
Commercial Mortgage REIT Charts
 The REIT Forum |
 The REIT Forum |
 The REIT Forum |
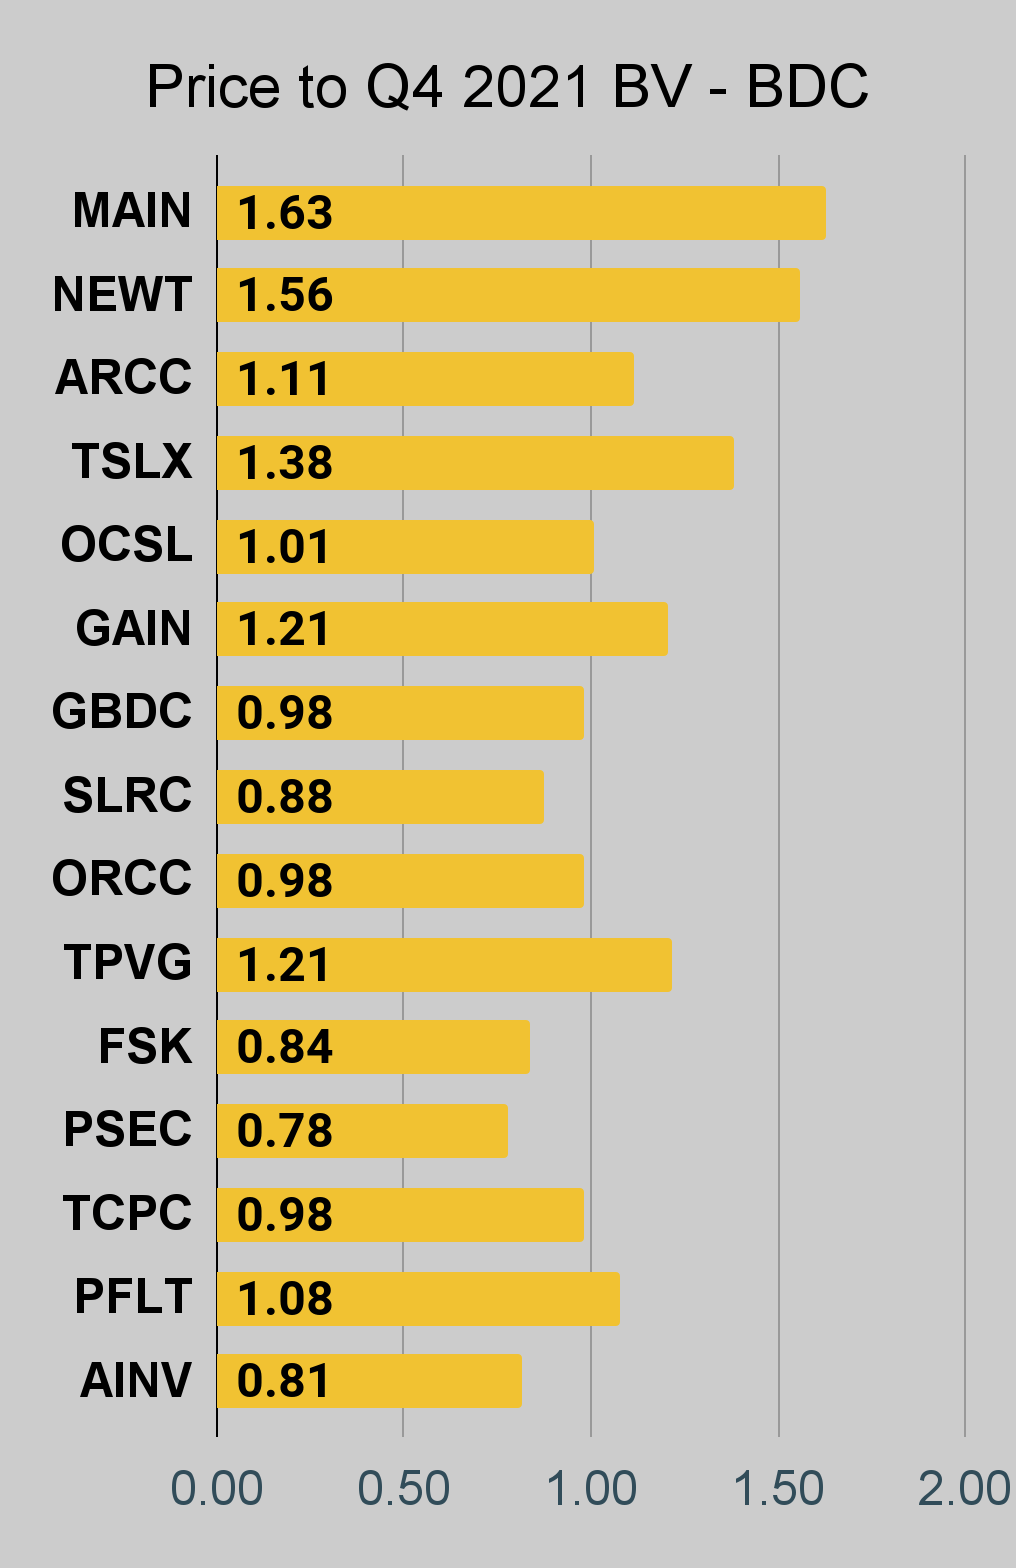
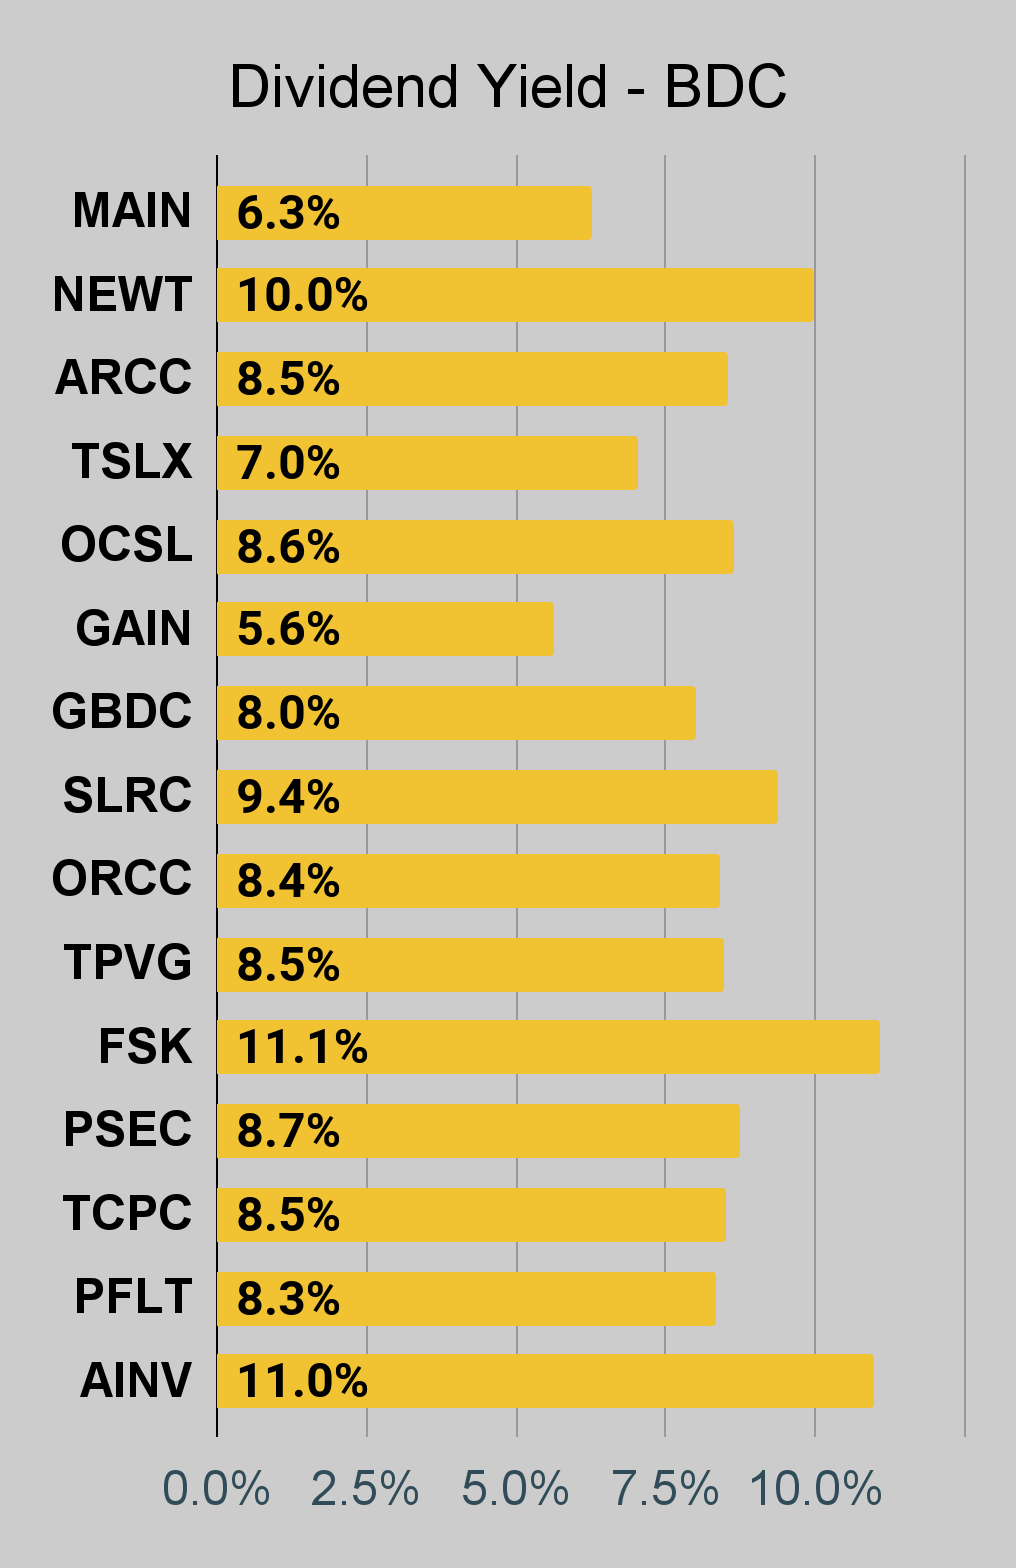
BDC Charts
 The REIT Forum |
 The REIT Forum |
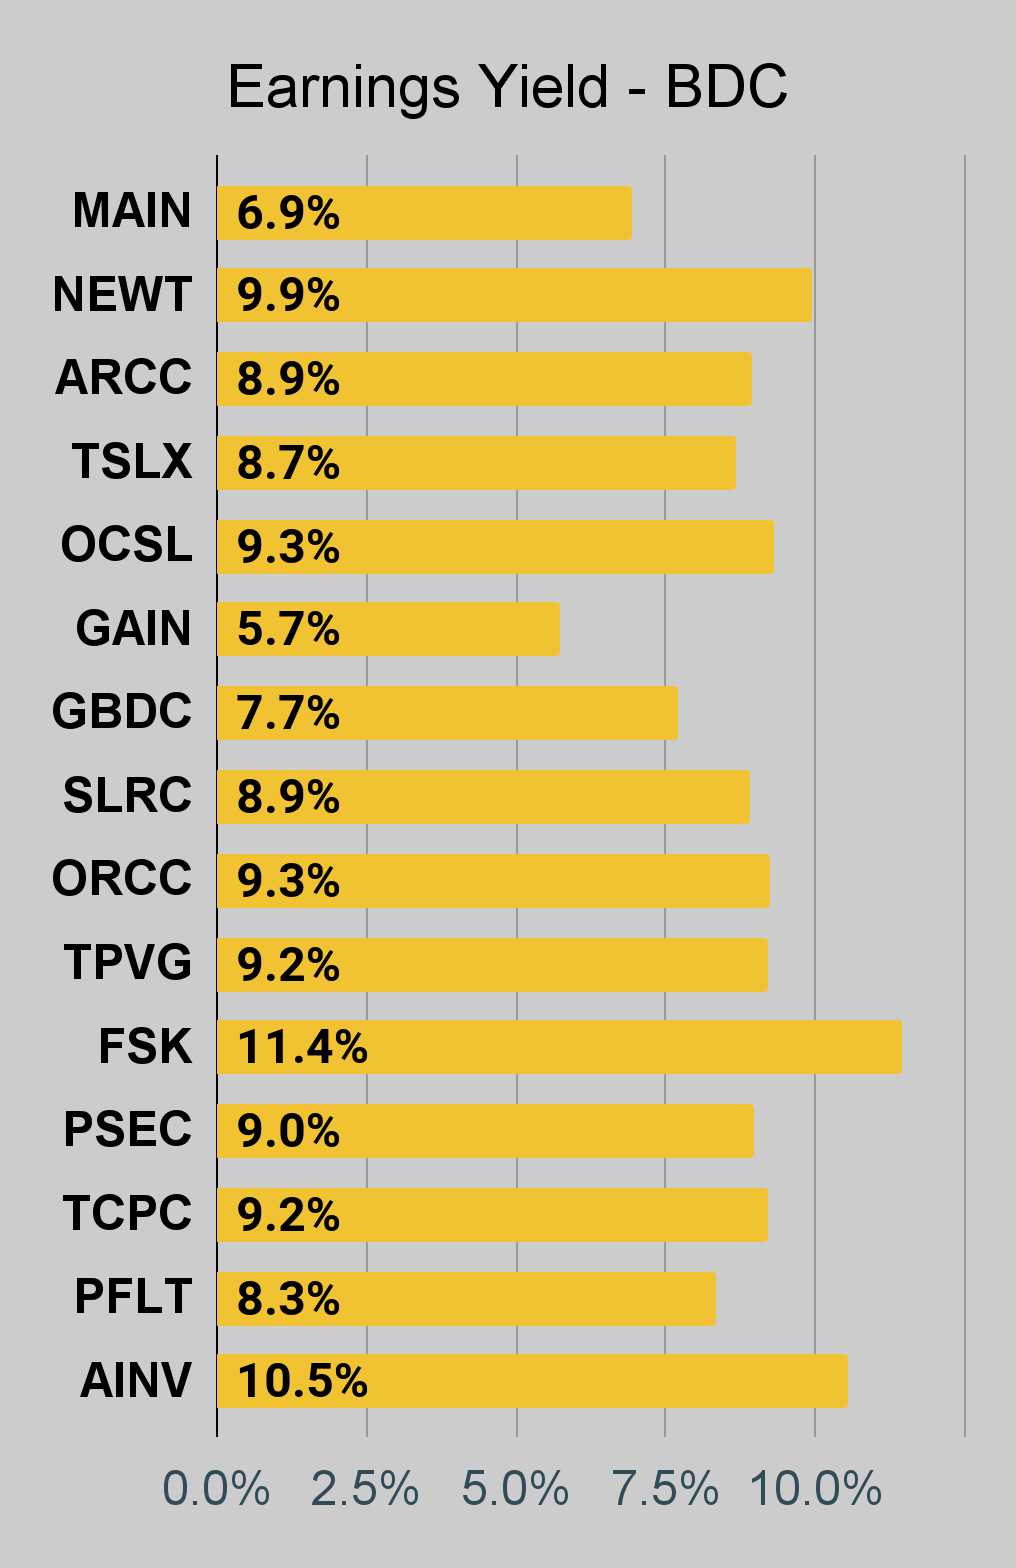 The REIT Forum |
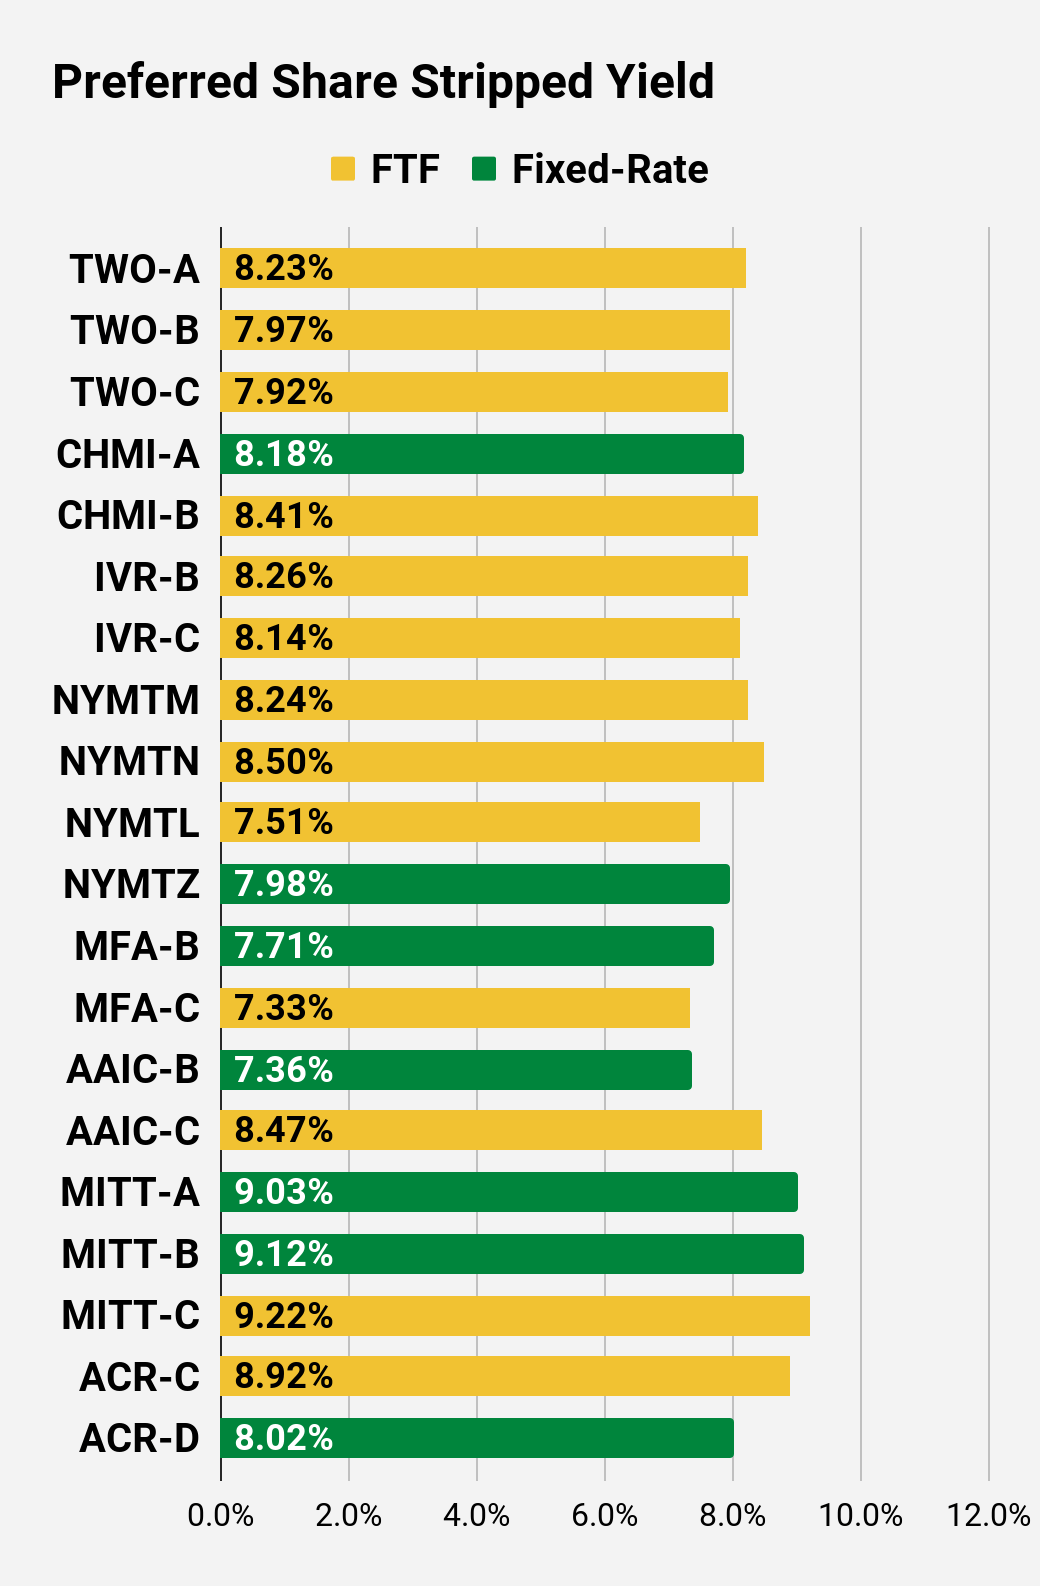
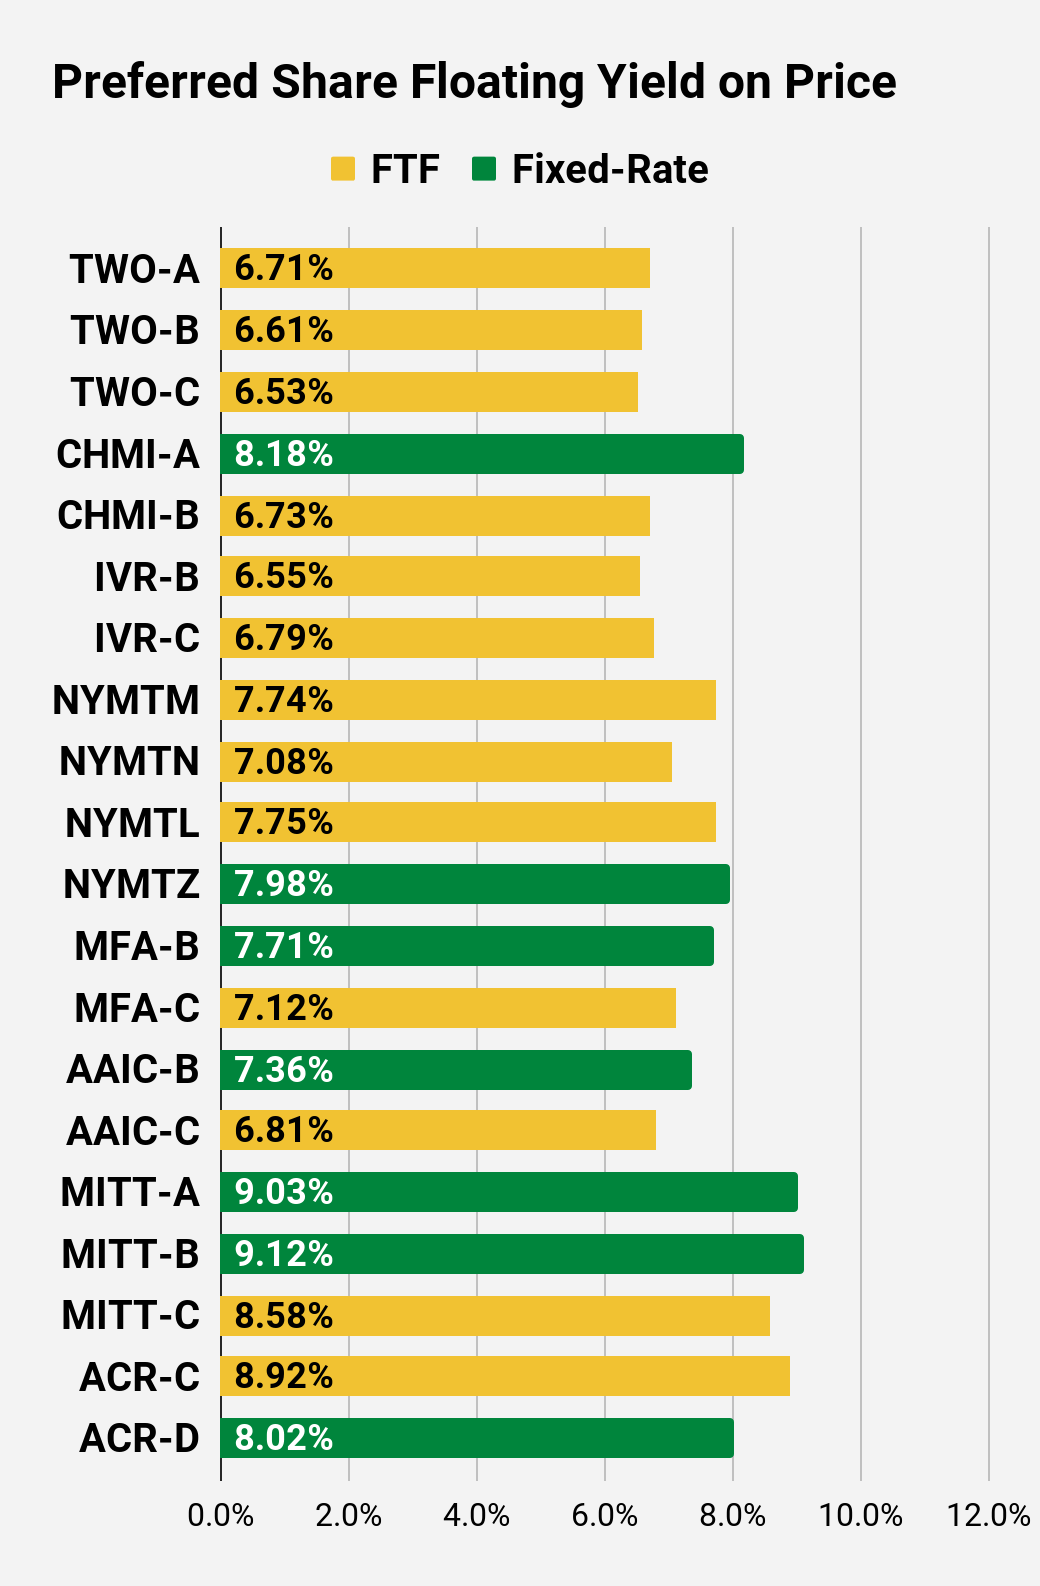
Preferred Share Charts
 The REIT Forum |
 The REIT Forum |
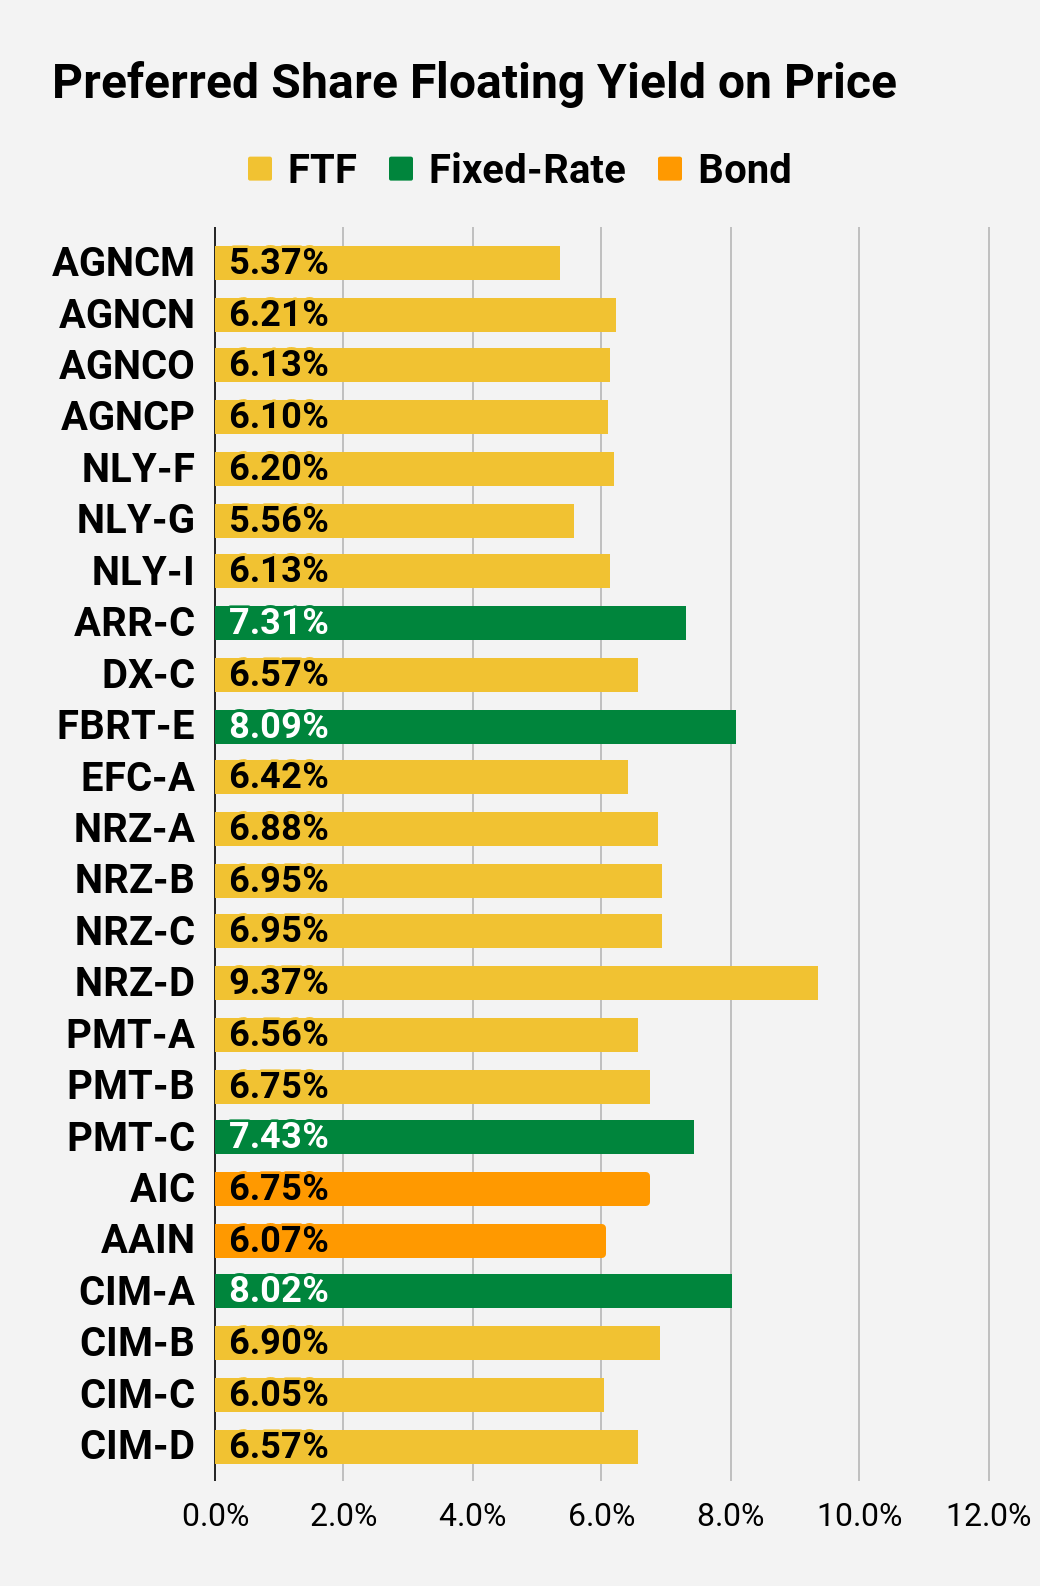 The REIT Forum |
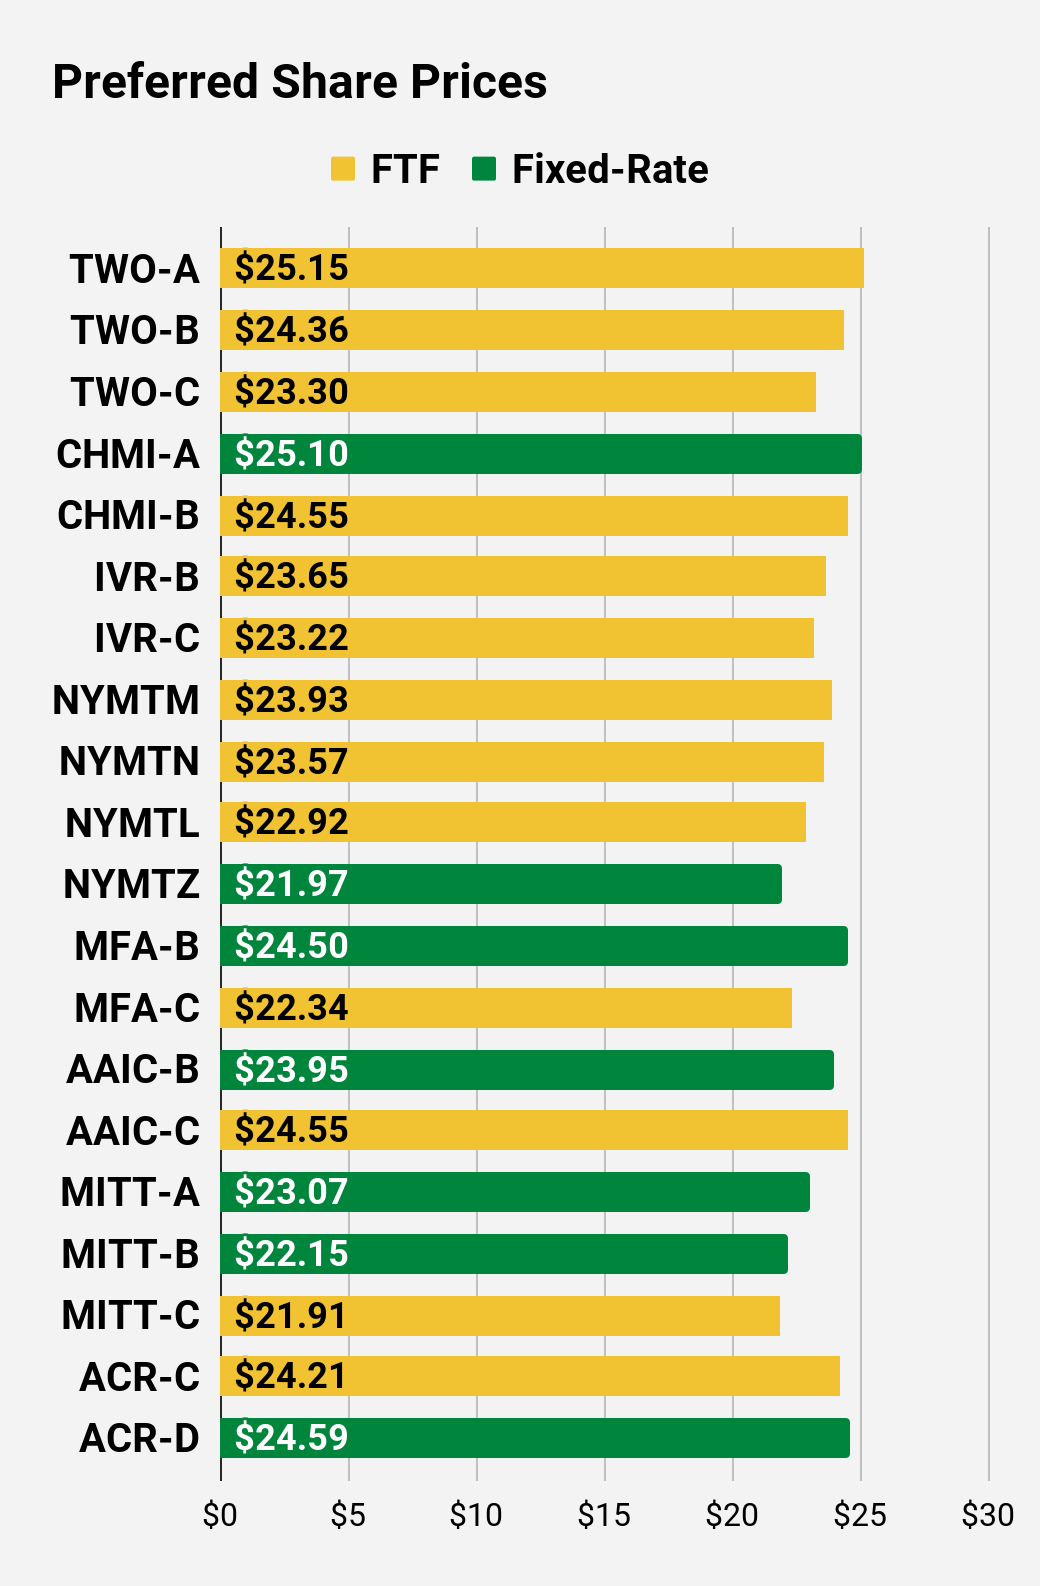 The REIT Forum |
 The REIT Forum |
 The REIT Forum |
Preferred Share Data
Beyond the charts, we’re also providing our readers with access to several other metrics for the preferred shares.
After testing out a series on preferred shares, we decided to try merging it into the series on common shares. After all, we are still talking about positions in mortgage REITs. We don’t have any desire to cover preferred shares without cumulative dividends, so any preferred shares you see in our column will have cumulative dividends. You can verify that by using Quantum Online. We’ve included the links in the table below.
To better organize the table, we needed to abbreviate column names as follows:
- Price = Recent Share Price – Shown in Charts
- BoF = Bond or FTF (Fixed-to-Floating)
- S-Yield = Stripped Yield – Shown in Charts
- Coupon = Initial Fixed-Rate Coupon
- FYoP = Floating Yield on Price – Shown in Charts
- NCD = Next Call Date (the soonest shares could be called)
- Note: For all FTF issues, the floating rate would start on NCD.
- WCC = Worst Cash to Call (lowest net cash return possible from a call)
- QO Link = Link to Quantum Online Page
Second Batch:
Strategy
Our goal is to maximize total returns. We achieve those most effectively by including “trading” strategies. We regularly trade positions in the mortgage REIT common shares and BDCs because:
- Prices are inefficient.
- Long-term, share prices generally revolve around book value.
- Short-term, price-to-book ratios can deviate materially.
- Book value isn’t the only step in analysis, but it is the cornerstone.
We also allocate to preferred shares and equity REITs. We encourage buy-and-hold investors to consider using more preferred shares and equity REITs.
Performance
We compare our performance against 4 ETFs that investors might use for exposure to our sectors:
The REIT Forum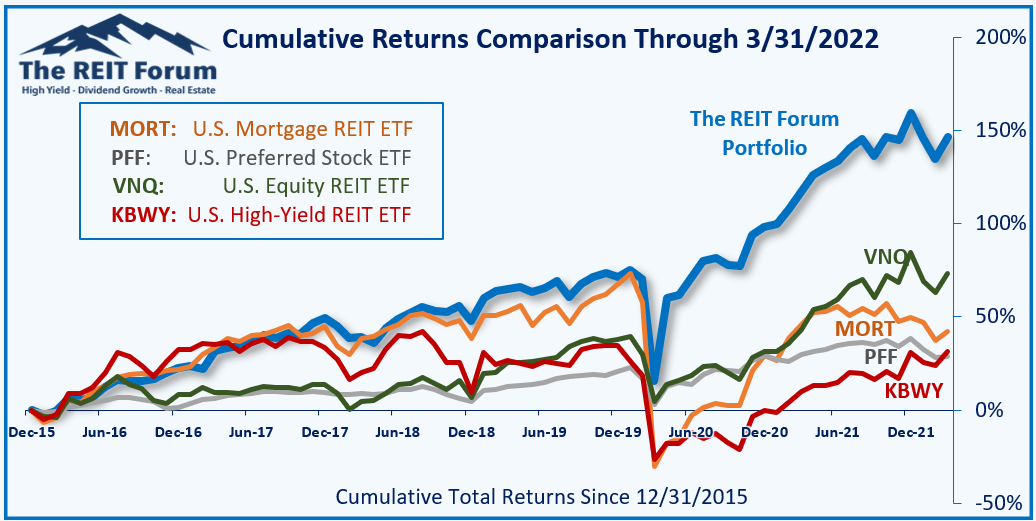
The 4 ETFs we use for comparison are:
|
Ticker |
Exposure |
|
One of the largest mortgage REIT ETFs |
|
|
One of the largest preferred share ETFs |
|
|
Largest equity REIT ETF |
|
|
The high-yield equity REIT ETF. Yes, it has been dreadful. |
When investors think it isn’t possible to earn solid returns in preferred shares or mortgage REITs, we politely disagree. The sector has plenty of opportunities, but investors still need to be wary of the risks. We can’t simply reach for yield and hope for the best. When it comes to common shares, we need to be even more vigilant to protect our principal by regularly watching prices and updating estimates for book value and price targets.
Ratings: Bearish on CHMI
Be the first to comment