


There’s nothing spooky about collecting income.
Irina Kashaeva
Get ready for charts, images, and tables because they are better than words. The ratings and outlooks we highlight here come after Scott Kennedy’s weekly updates in the REIT Forum. Your continued feedback is greatly appreciated, so please leave a comment with suggestions.
Despite high Treasury rates today (especially the two-year rates), I think investors may want to maintain some allocation to fixed-rate preferred shares in their portfolio. That still requires having a respectable amount of upside to call value and an attractive dividend yield. There needs to be a reward for taking on interest rate risk. However, I see the start of a change in the narratives.
Signs of Weakness in Treasury Yields and Inflation
Bond yields have finally shown signs of dropping. While they remain dramatically elevated from several months ago, the trend has started to reverse. It would be nice to see Treasury yields break below the 100-day moving average.
On Nov. 10, 2022, we saw yet another reading showing that the CPI (consumer price index) excluding shelter was still roughly flat after four months. That triggered Treasury yields to fall. When Jerome Powell came out indicating that perhaps the Federal Reserve shouldn’t look exclusively in the rearview mirror, it sent yields falling again:
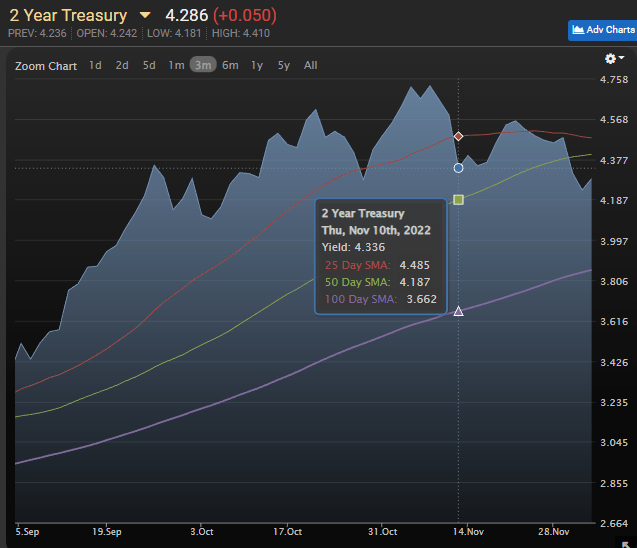
MBS Live
We saw a similar story with the 10-year Treasury yields, except they dropped even further:
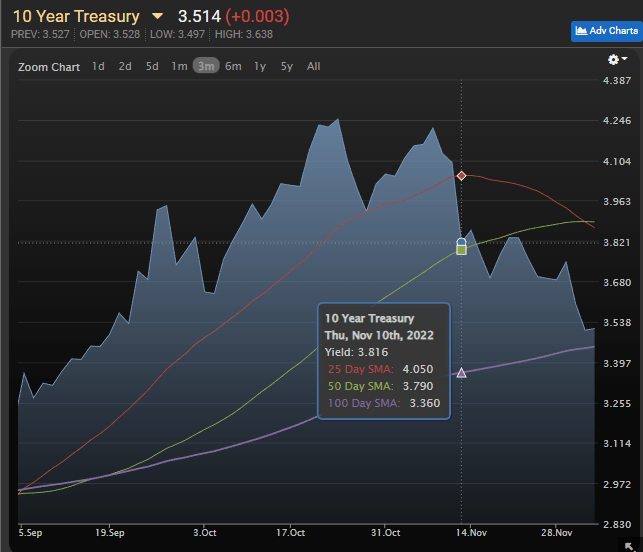
MBS Live
Why is the 10-year Treasury dropping faster? Because global bond managers are looking at the data on inflation and odds of recessions. They still see the Federal Reserve pushing rates too high and taking too long to reduce them.
The two-year yield of 4.286% compares to a three-year yield of 3.997%. The market is pricing in cuts in the target rates.
What About Food?
Clickbait thrives and food is an item most Americans can see. When food prices rise rapidly, it’s the perfect environment for an echo chamber. Raising interest rates has never produced additional eggs. Raising interest rates and driving a recession (with larger credit spreads) only makes it more difficult for farmers to get the funding necessary to replace tens of millions of hens that were culled to slow the spread of the avian flu.
Lower prices on eggs can come from higher supply or lower demand. Getting lower demand on a core ingredient is pretty hard. We don’t want to see a recession turn into a depression. Raising rates is not an effective way to combat inflation in basic necessities.
If interest rates don’t work, what will? The cure for high prices is high prices. We can see how it played out with the Avian flu in 2015:
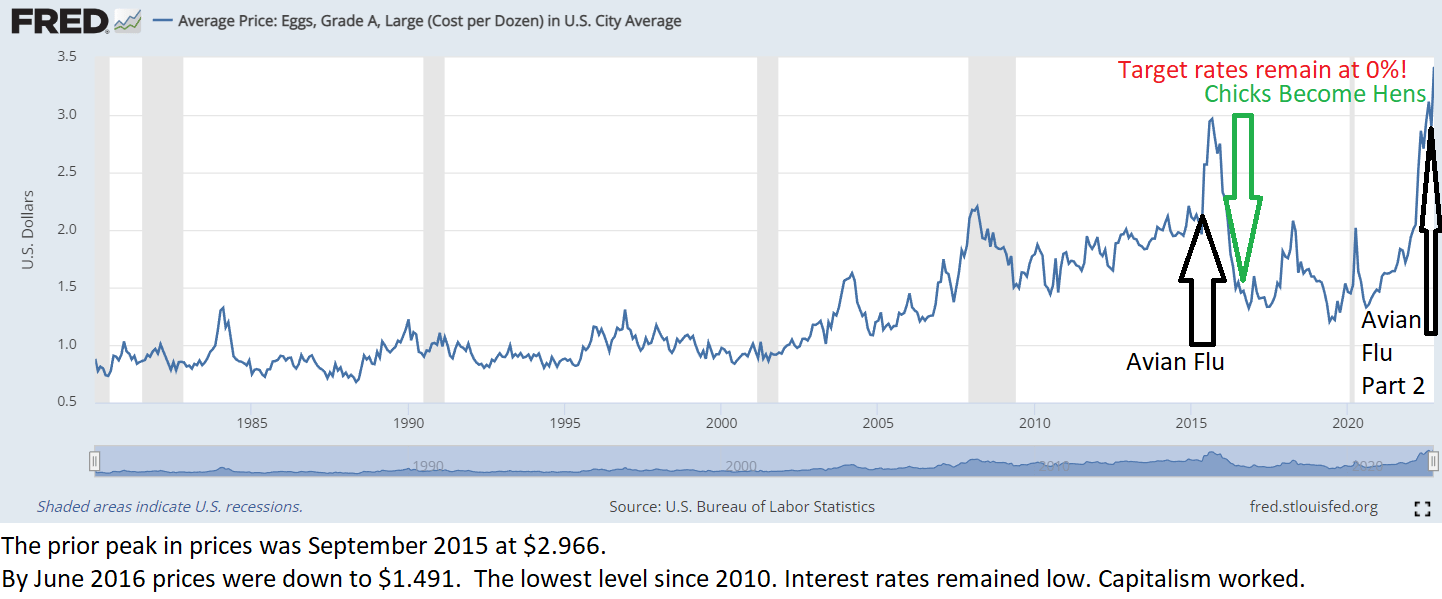
FRED
With high share prices, more hens were raised. Egg prices plunged because the free market was providing an incentive to increase egg production.
- Should we really panic about higher egg prices? Probably not.
- Is Jerome Powell going to lay even one egg? Probably not.
- Are farmers going to focus on turning their chicks into egg-laying hens? Absolutely.
Farmers want to sell as many eggs at these prices as possible because they know the price will crash.
Why will it crash? Because other farmers want to take advantage of the higher price also. Capitalism at work.
Since eggs go into several other products, it drives inflation throughout the grocery store. Even if a product doesn’t use eggs, the drop in egg production means more people eating other foods.
What About Coffee?
Do higher rates produce more coffee? Obviously not.
But coffee prices have been rising rapidly. Well, domestic prices have been rising rapidly. Global prices actually declined since peaking in February 2022:
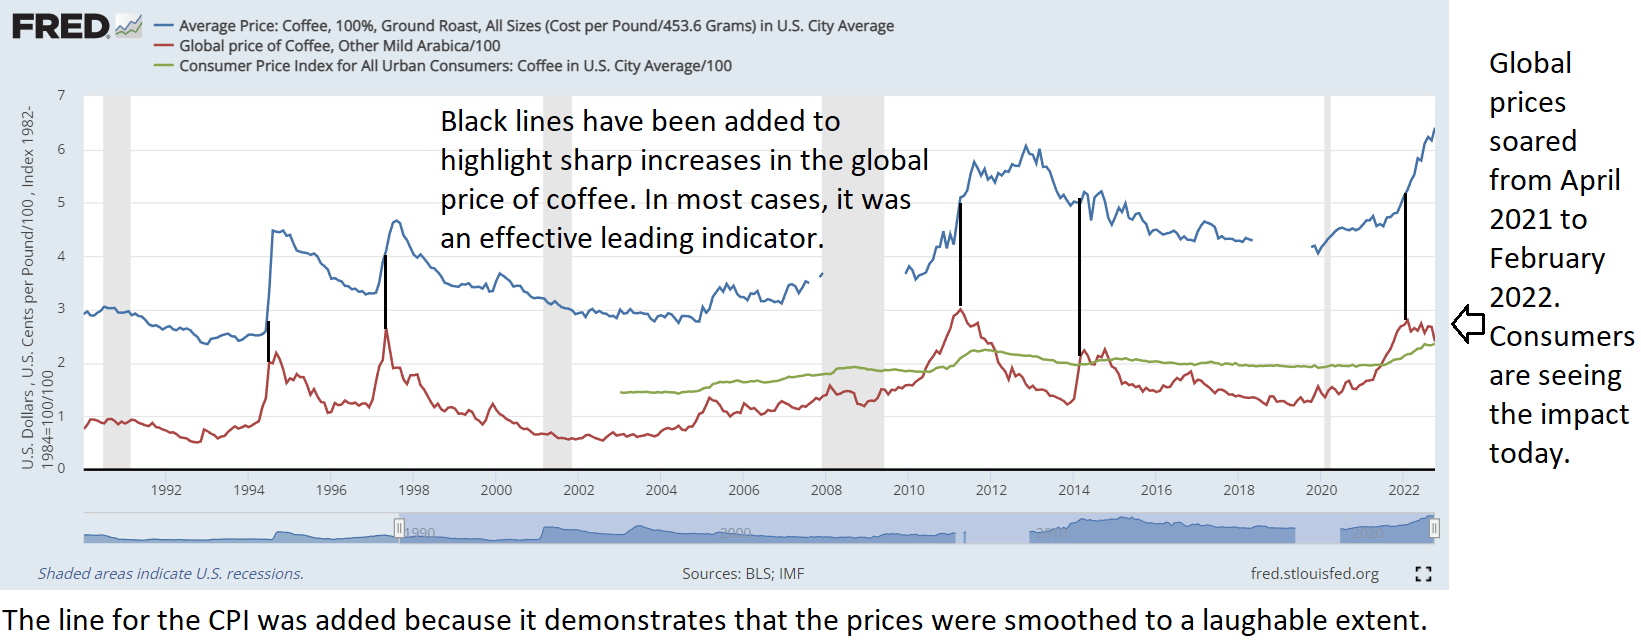
FRED
So, what drove the price up? Brazil normally produces over 35% of the world’s coffee and bad weather in Brazil (not to mention the pandemic impacts) drove dramatically lower production in 2021. As the shortfall in production became evident, global prices began rising rapidly. That’s why the global prices were ripping higher in 2021, not 2022. However, consumers are seeing most of the impact over the last several months.
What About Butter and Margarine?
Margarine requires vegetable oil. Soybean, palm, sunflower, and canola oil are the key ingredients. What country produces the most sunflower oil? Ukraine. This is one of several inflationary impacts of the war. You can see the impact of reduced supply in the following chart:
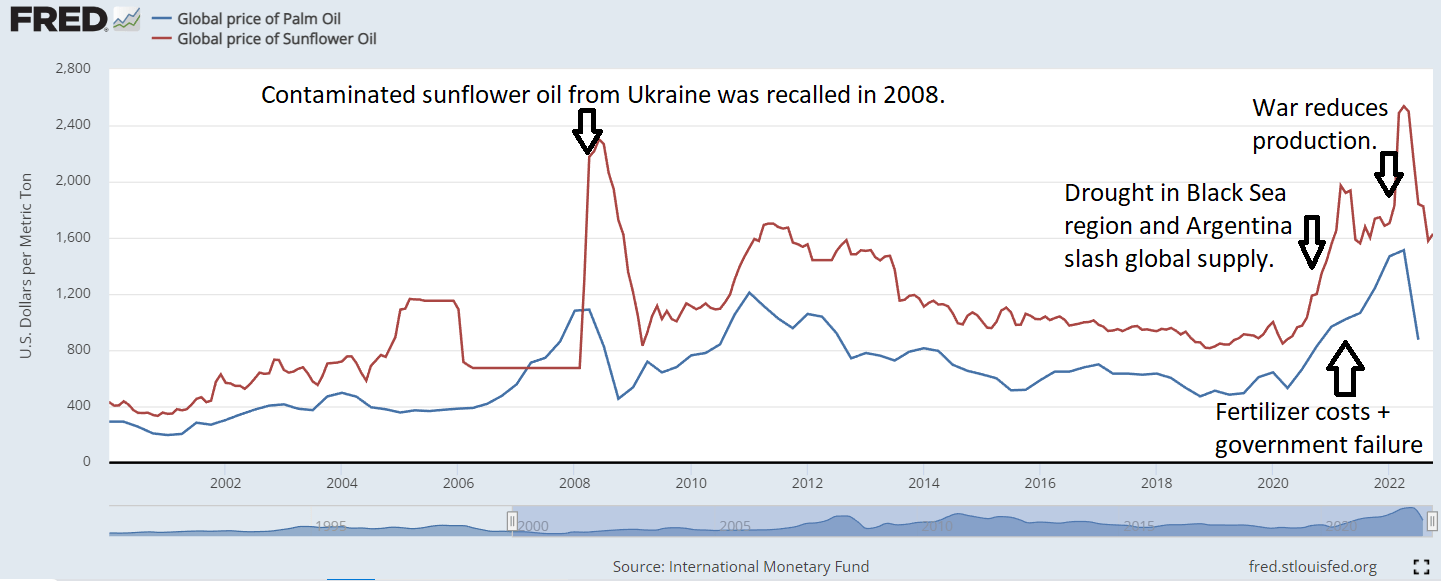
FRED
So, we know supply for sunflower oil was a problem. What happened to palm oil? How could it soar so much and then fall so hard?
The first issue is that dramatic increases in the price of fertilizer made production more expensive. As a grower of palm oil, you’ll be concerned about spending heavily on fertilizer unless you know you can achieve a significant premium on selling your palm oil. That contributed to a reduction in supply. However, Indonesia is the world’s largest exporter of palm oil. Yet exports of palm levy were subject to a huge levy. That made exporting far more expensive. Despite the levy, it was still worth producing and exporting palm oil. Then the Indonesian government decided to simply ban exports over concern about higher domestic prices. Banning exports for a country that produces 59% of the world’s total palm oil exports had a predictable impact.
If you guessed that the supply of palm oil couldn’t be sold domestically, you’d be right. The ban was lifted. However, it was only after:
High palm oil stocks have forced mills to limit purchases of palm fruits. Farmers have complained their unsold fruits have been left to rot. There were 7.23 million tonnes of crude palm oil in storage tanks at the end of May, data from the Indonesian Palm Oil Association (GAPKI) showed on Friday.
With palm oil prices at all time-record highs, nearly triple the level from two years prior, the supply was left to rot. Each business tried to make the best decision they could, given the ban on exports. Rather than record profits for mills and record profits for farmers, the produce was wasted. That’s supply constraints for the global market, and it destroys the local economy.
Global prices are plunging now as mills seek to unload their storage. As bad as the higher prices were for the rest of the world, no one suffered worse than the farmers whose product became worthless as a result of government failure.
Contrary to today’s popular opinion, higher interest rates won’t do anything to improve production of vegetable oil.
The Power of Supply
We’ve rarely had demand for commodities falling. With a relatively steady demand curve, supply determines price. Want lower prices? Increase supply.
Raising interest rates cannot fix supply. Raising rates will not prevent a ban on exports. Raising rates will not prevent droughts.
Raising rates will reduce the incentive to invest in new productive capacity. That’s a terrible outcome.
Deficits
Aside from weak supply, deficits are the other major factor supporting inflation. Higher interest rates never prevented deficits, so raising rates will not prevent deficits today. Higher interest expenses simply increase the annual deficit.
Official Numbers
See the official CPI release (link will automatically update itself to the latest report).
From the November report:
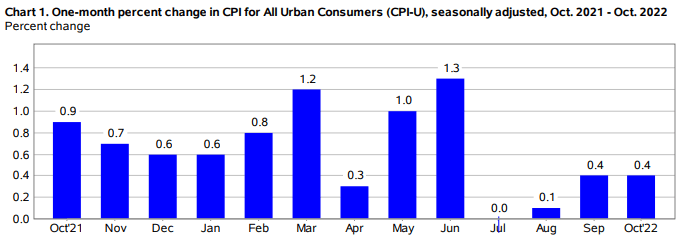
Bureau of Labor Statistics
The inflation was carried by “CPI: Shelter” yet again. “The shelter index continued to increase, rising 0.8 percent in October, the largest monthly increase in that index since August 1990.”
Apartment Reality
Let’s check with a big landlord. Someone that owns at least 50,000 apartments. Equity Residential (EQR) owns 79,594 apartments. EQR, would you care to tell us if October saw the largest monthly increase in rents since 1990?

EQR
That is a resounding “no.” They tend to see a bit of weakness from August to about November or December. However, it’s dipping a little faster than normal. As we’ve said before, CPI: Shelter is not a useful short-term proxy for rental rates.
Expected Near-Term Results
Same as a month earlier, we still expect CPI: Shelter’s lagged value to continue propping up inflation metrics on average over the next few months at least. To fully adjust for changes in rental rates that already occurred, it will take more than a year since rental rates stopped climbing.
Eventual Results
When stories about the price of eggs stop generating enough clicks, people may notice that the environment is shifting. The argument for paying out hundreds of billions in additional interest expense each year on the Federal Debt relied on people being scared of inflation.
Therefore, it wouldn’t be surprising if we see rates come down over the next two years. The negative slope on the yield curve (two-year rates way above 10-year rates) clearly signals that the big money is already betting on rates falling.
If we return to a lower-for-longer environment over the next few years, investors will be back to hunting for yield. Without getting paid over 4% on Treasuries, investors will be looking for alternative sources of yield.
This macroeconomic analysis comes from our monthly Portfolio Update.
Stock Table
We will close out the rest of the article with the tables and charts we provide for readers to help them track the sector for both common shares and preferred shares.
We’re including a quick table for the common shares that will be shown in our tables:
Let the images begin!
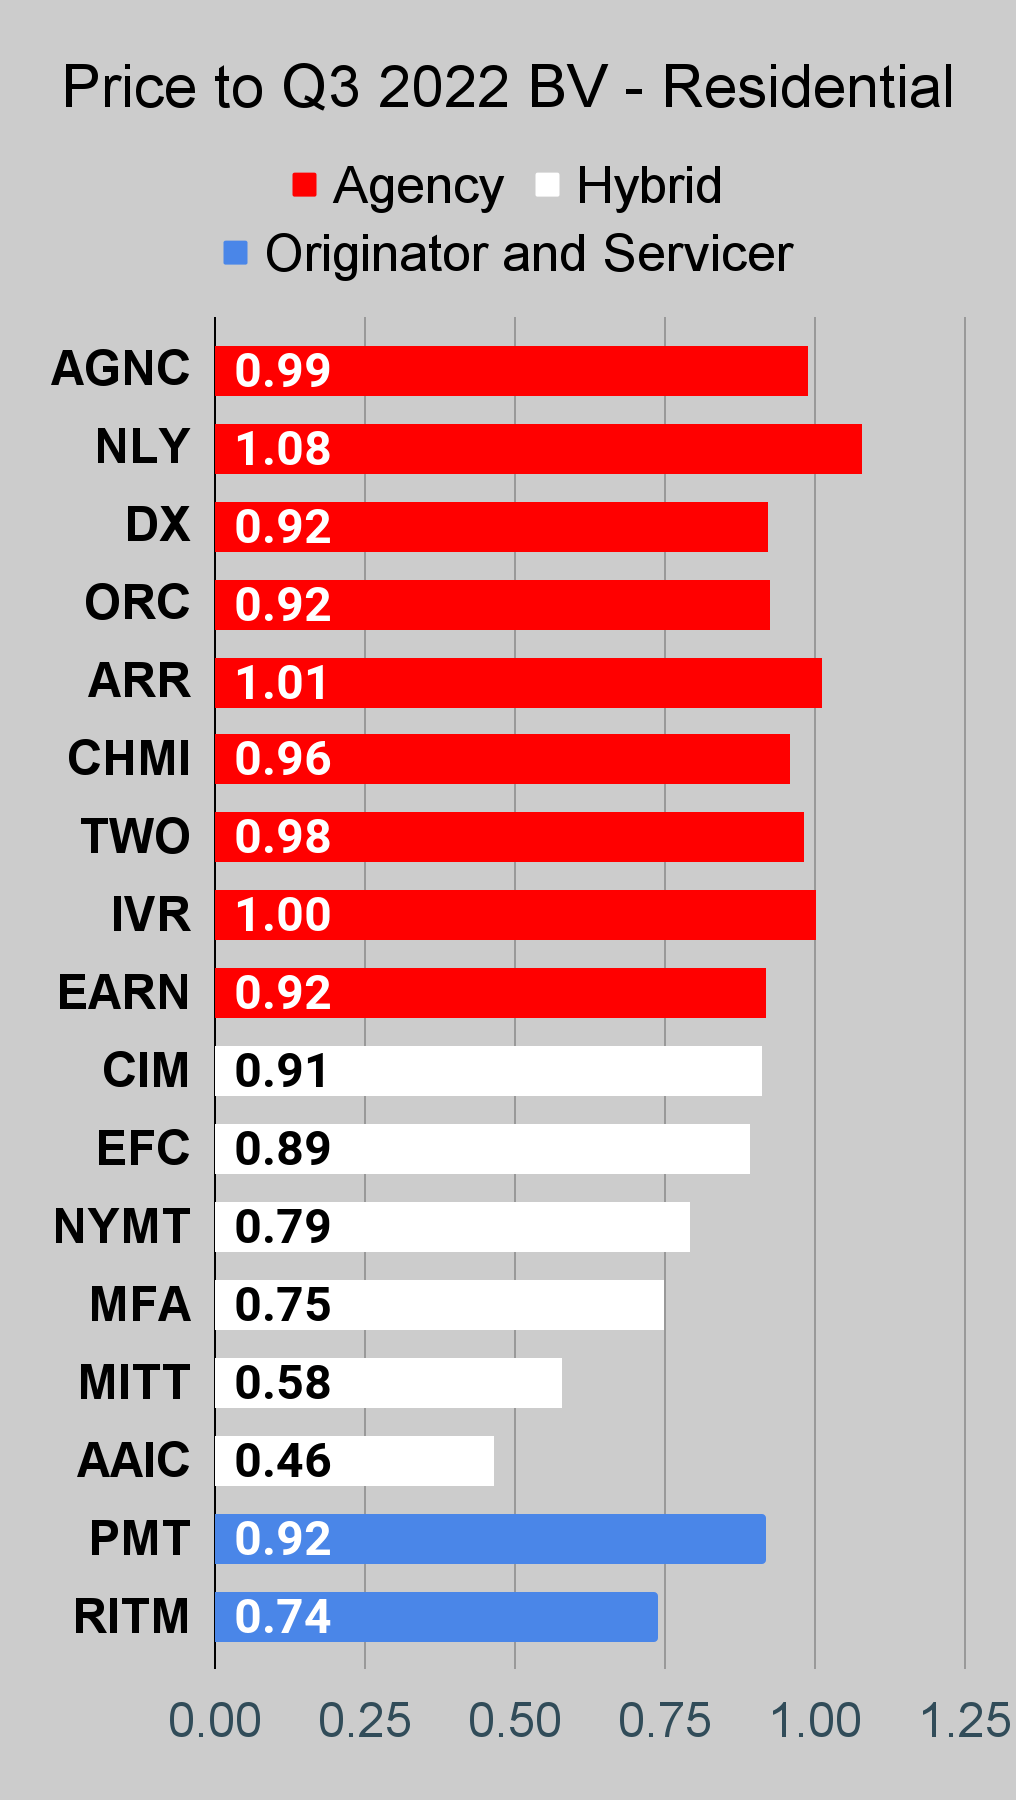
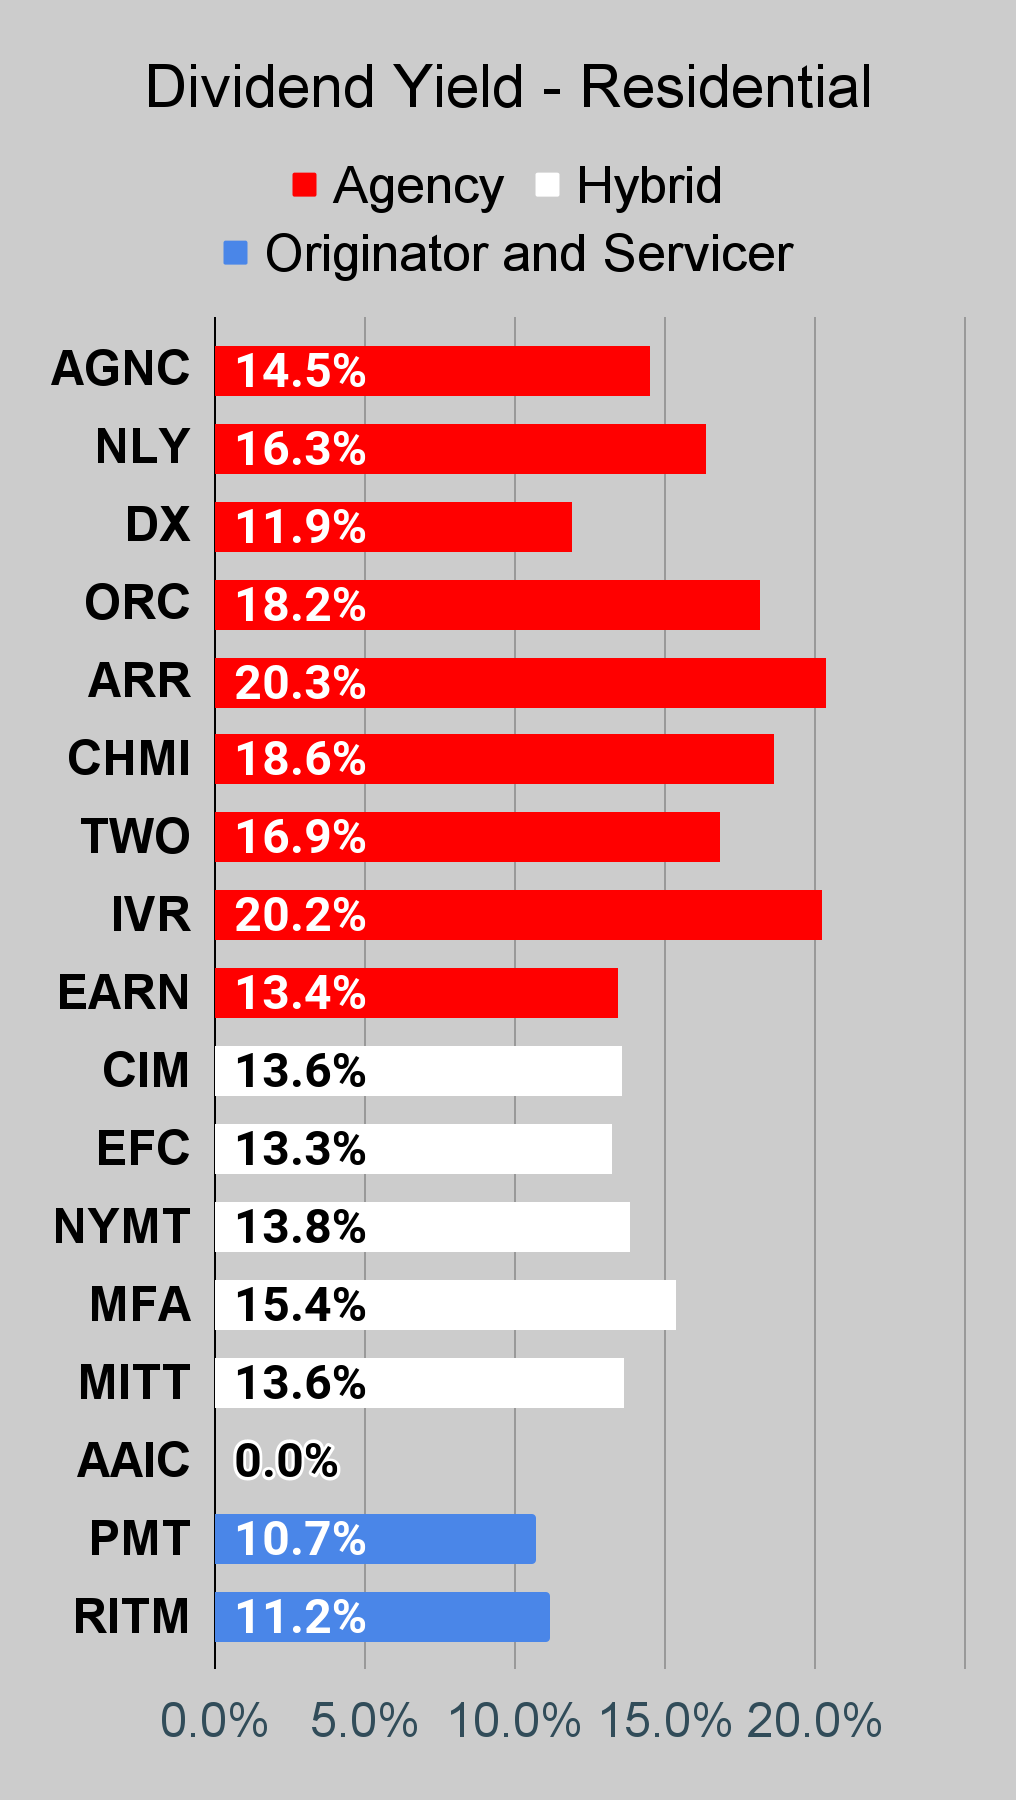
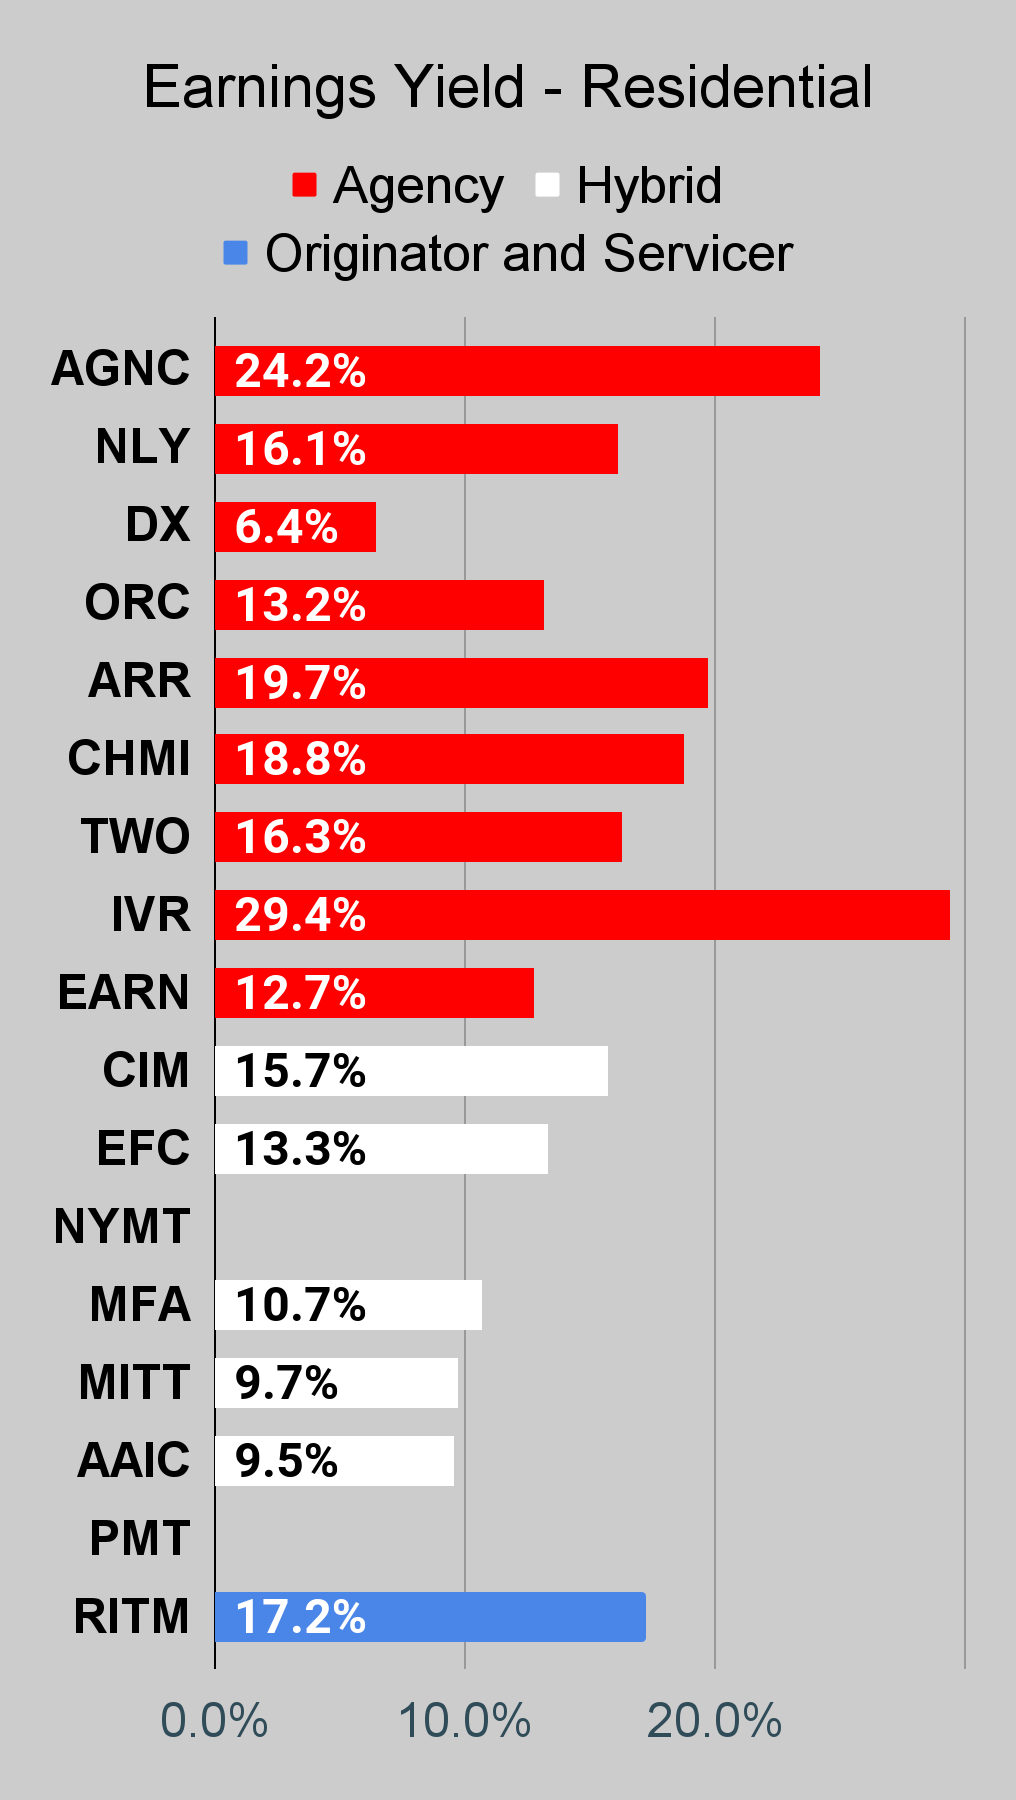
Residential Mortgage REIT Charts
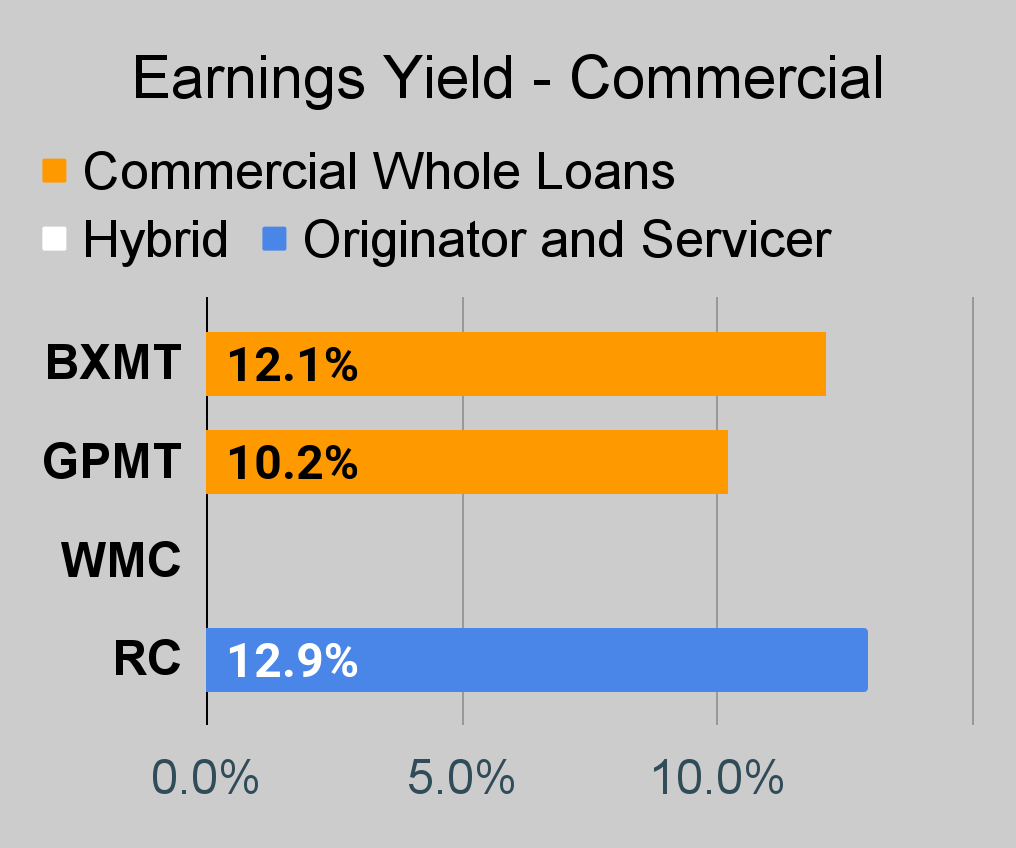
Note: The chart for our public articles uses the book value per share from the latest earnings release. Current estimated book value per share is used in reaching our targets and trading decisions. It’s available in our service, but those estimates are not included in the charts below. PMT and NYMT are not showing an earnings yield metric as neither REIT provides a quarterly “Core EPS” metric.
 The REIT Forum |
 The REIT Forum |
 The REIT Forum |
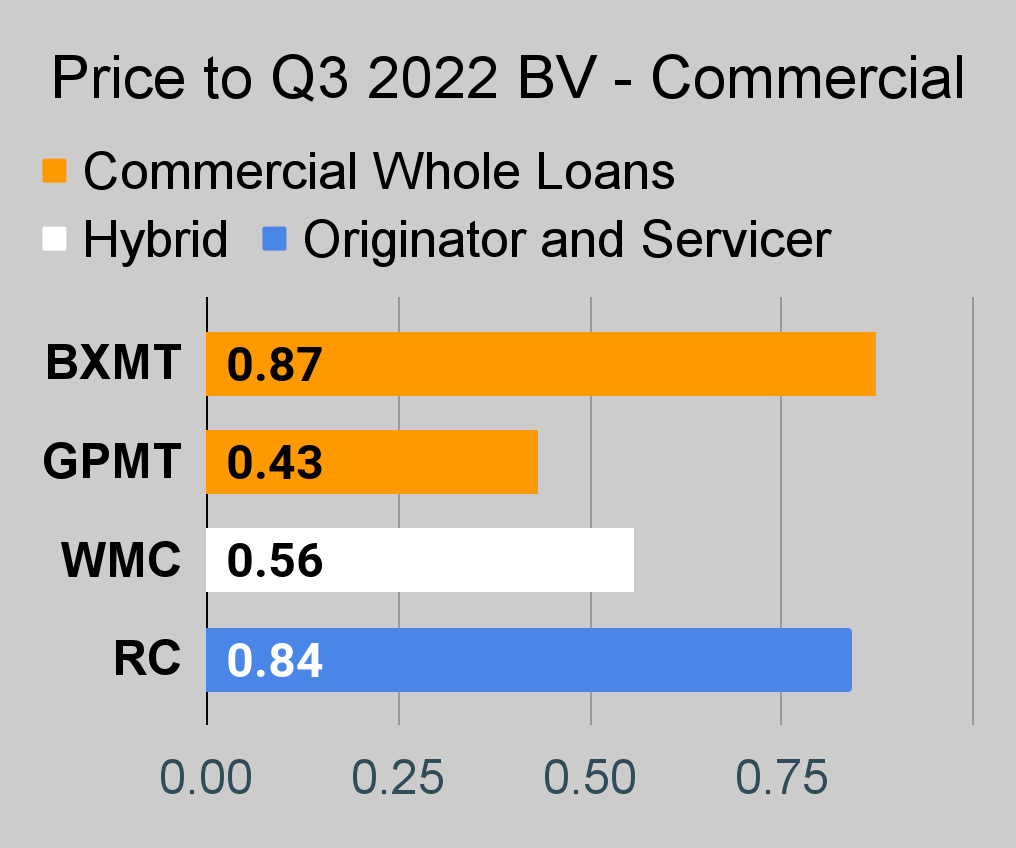
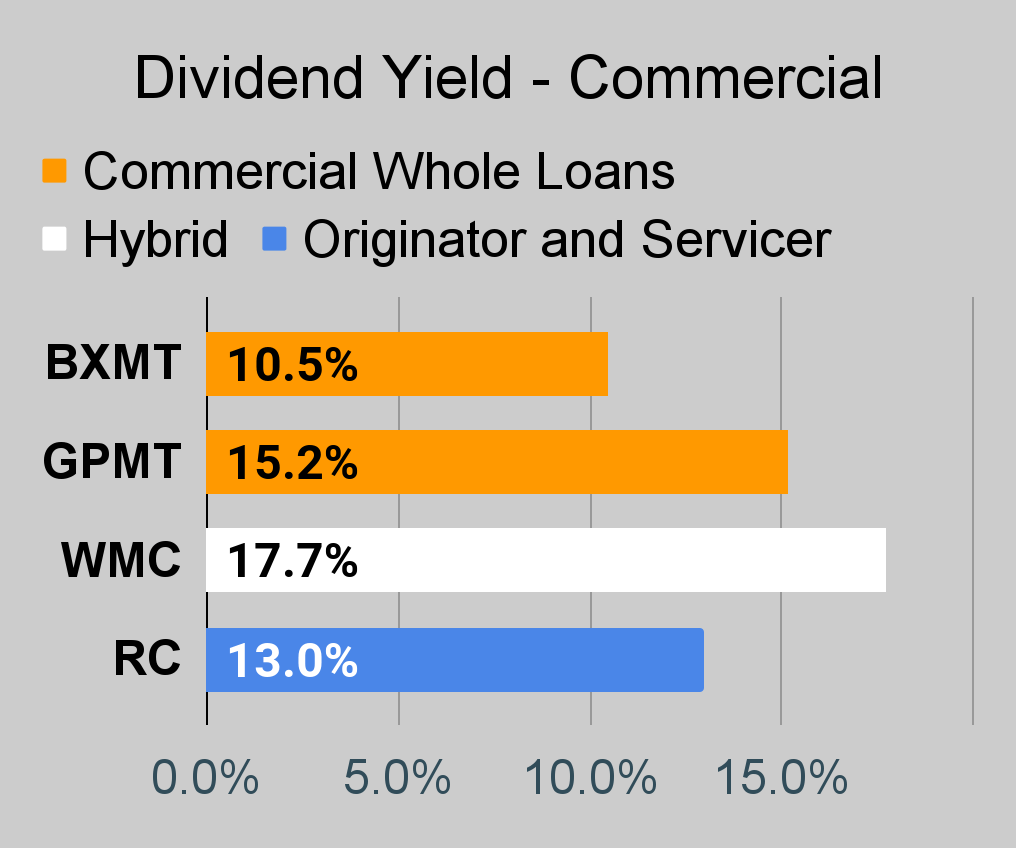
Commercial Mortgage REIT Charts
 The REIT Forum |
 The REIT Forum |
 The REIT Forum |
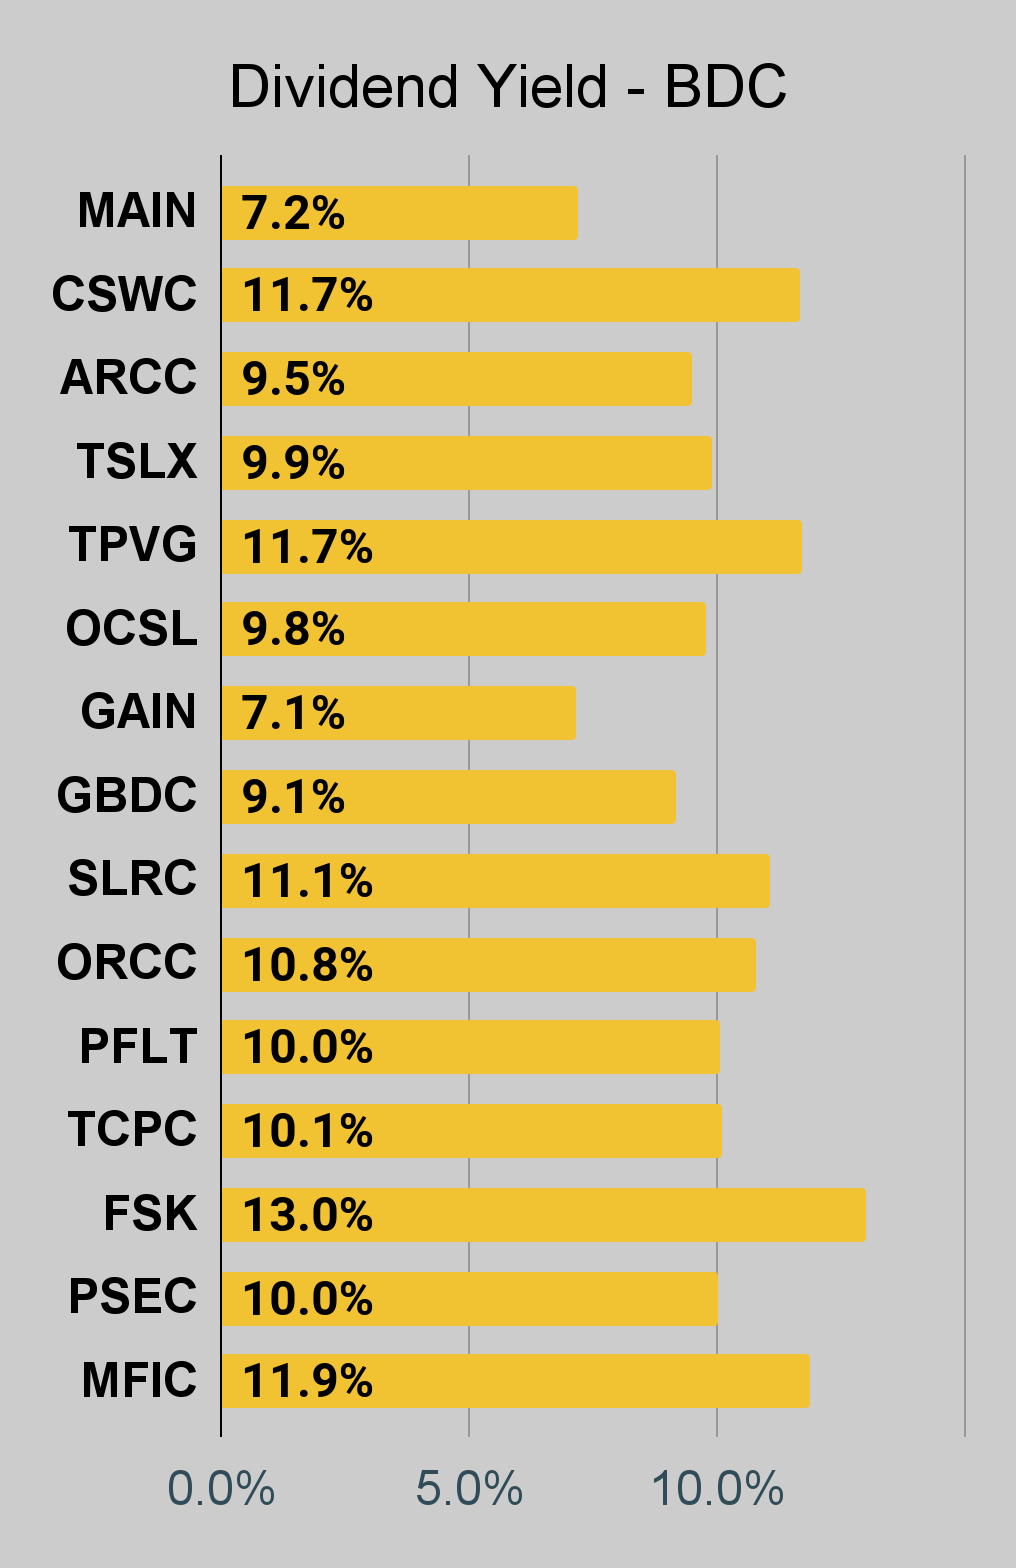
BDC Charts
 The REIT Forum |
 The REIT Forum |
 The REIT Forum |
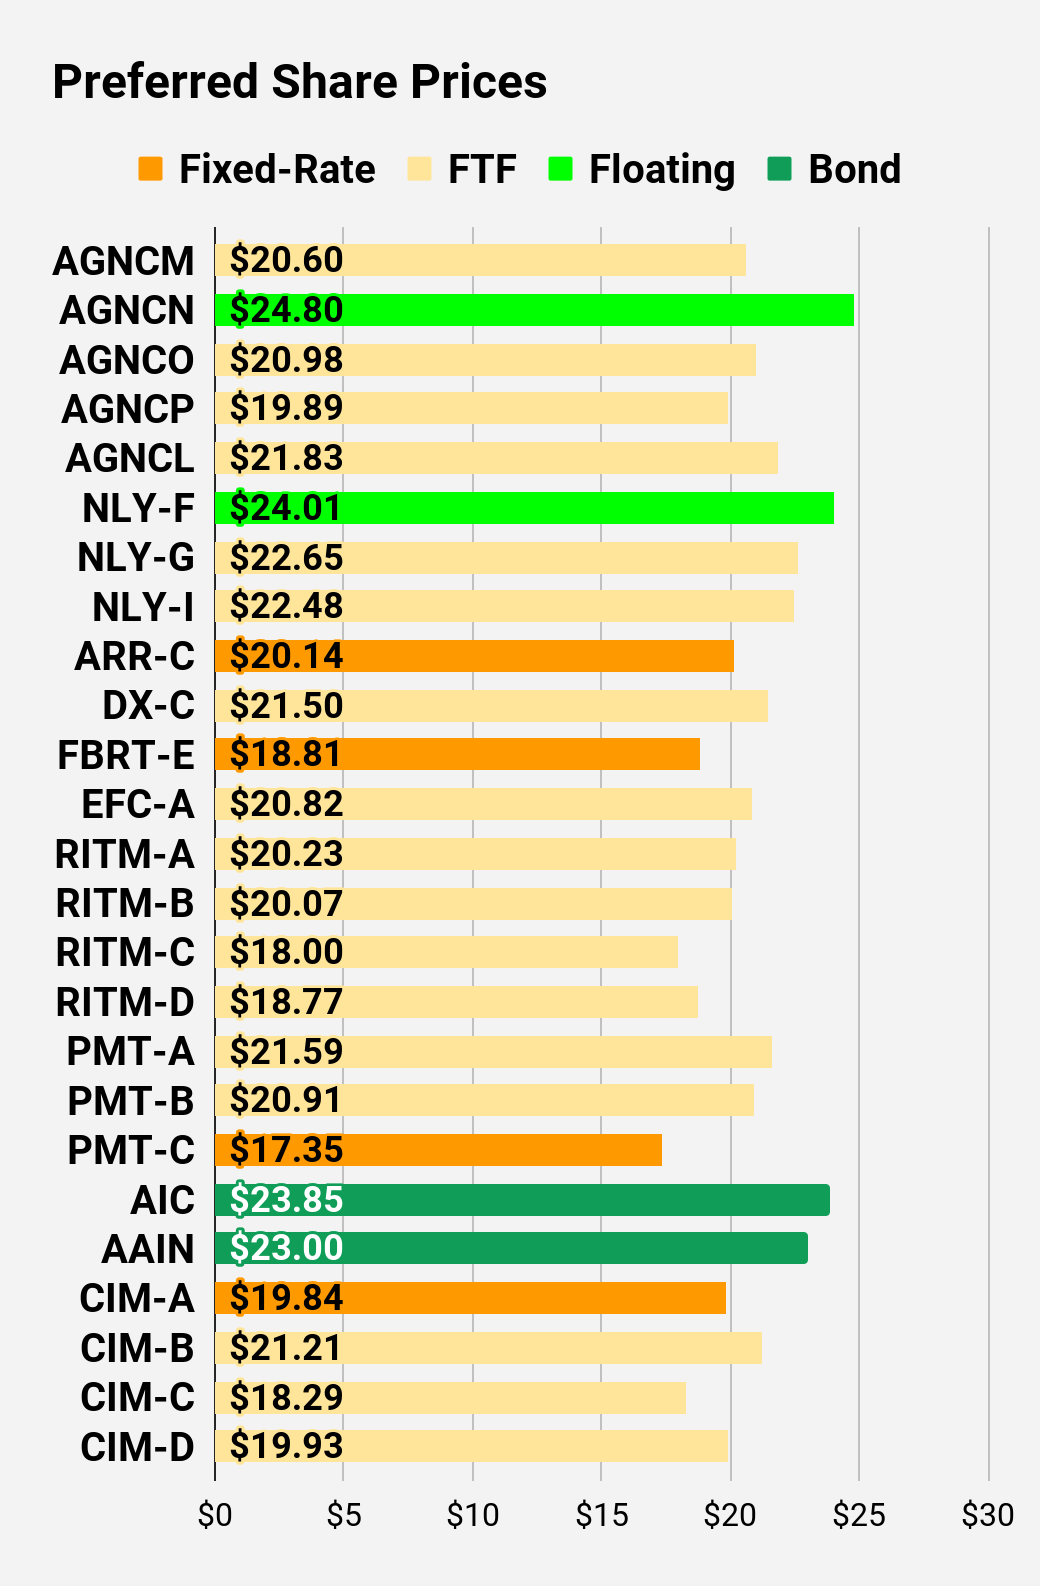
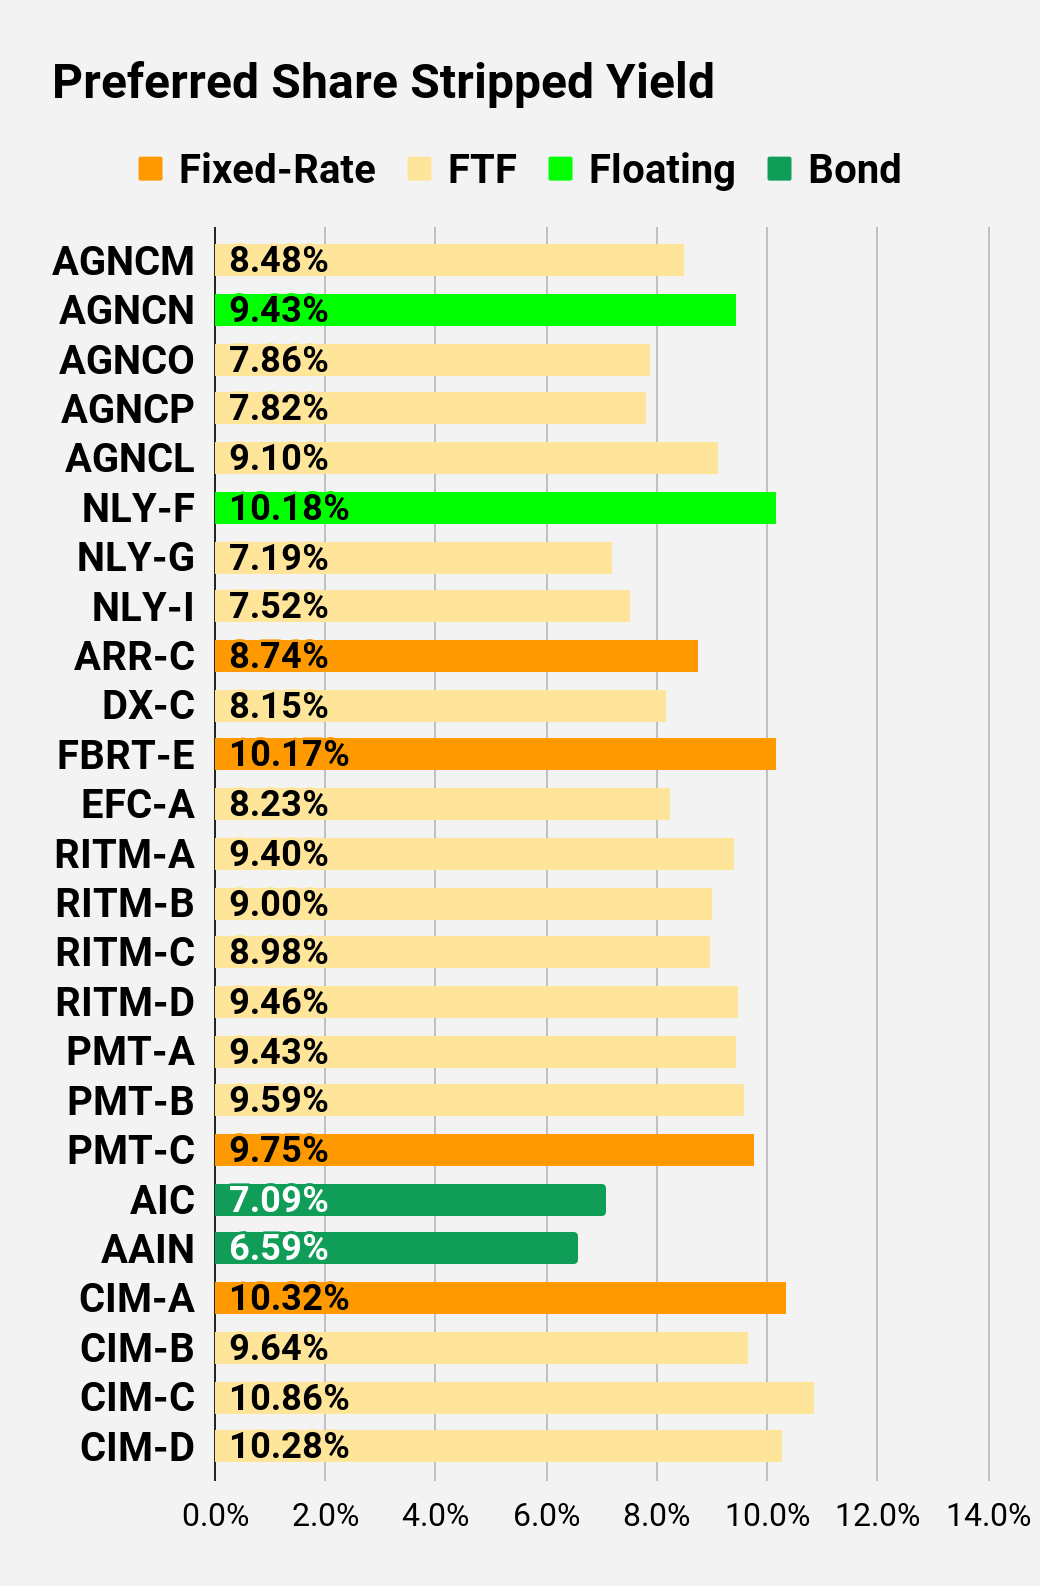
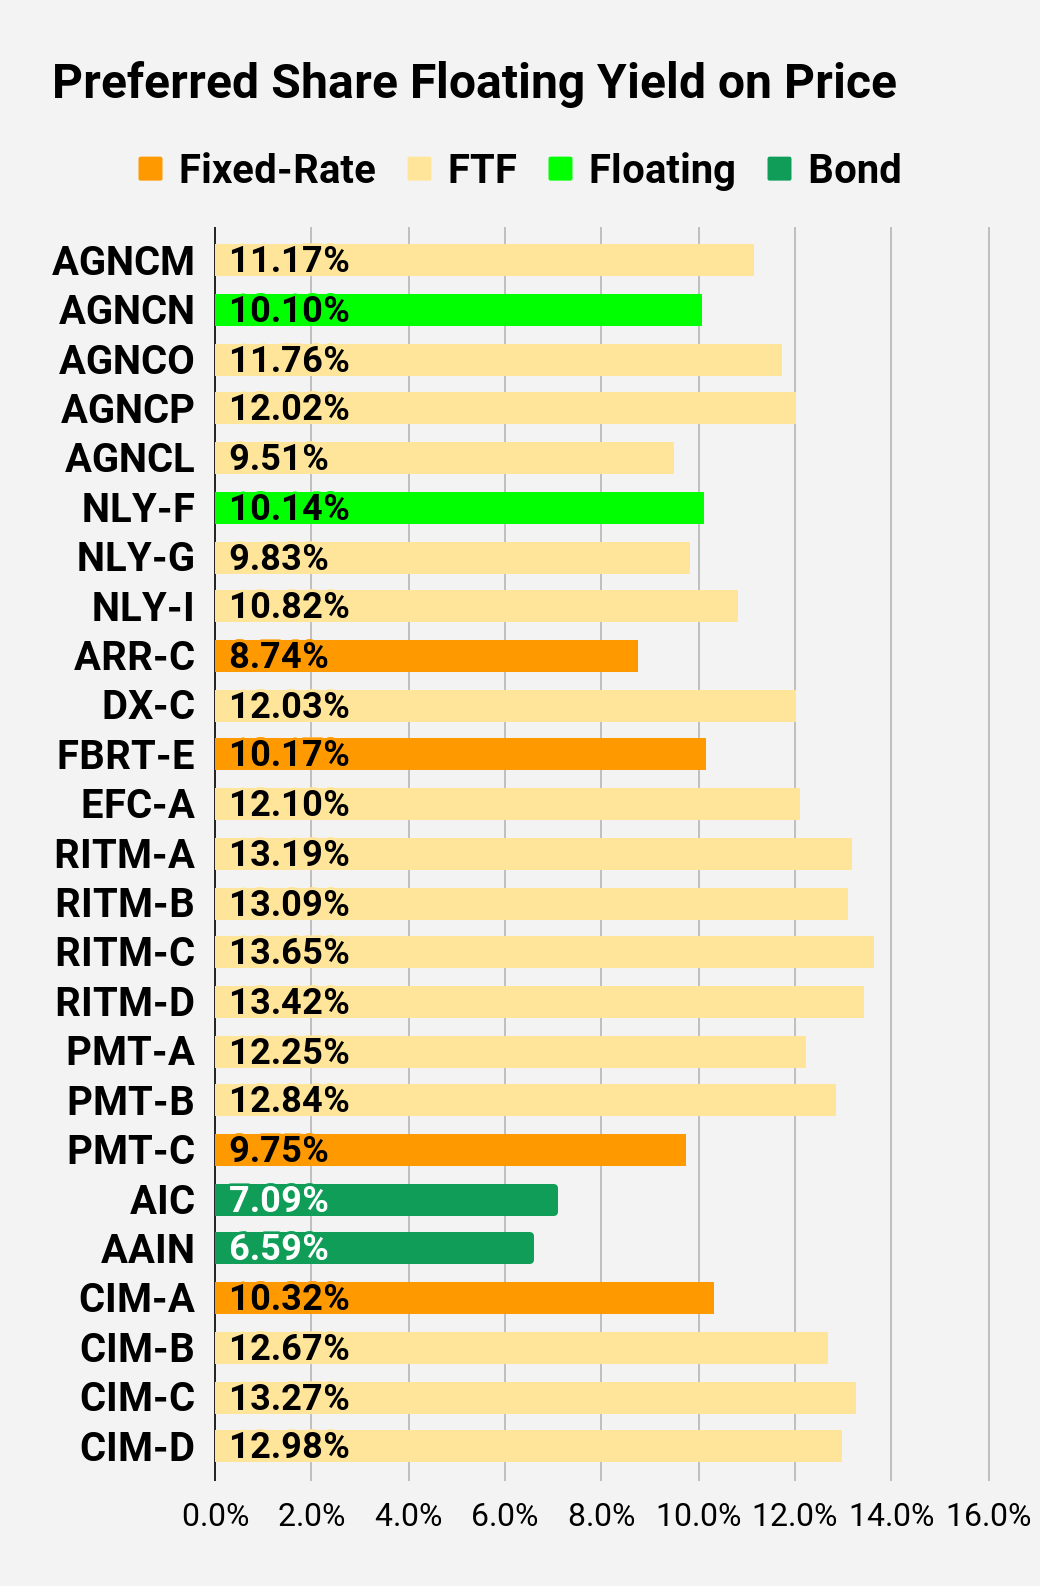
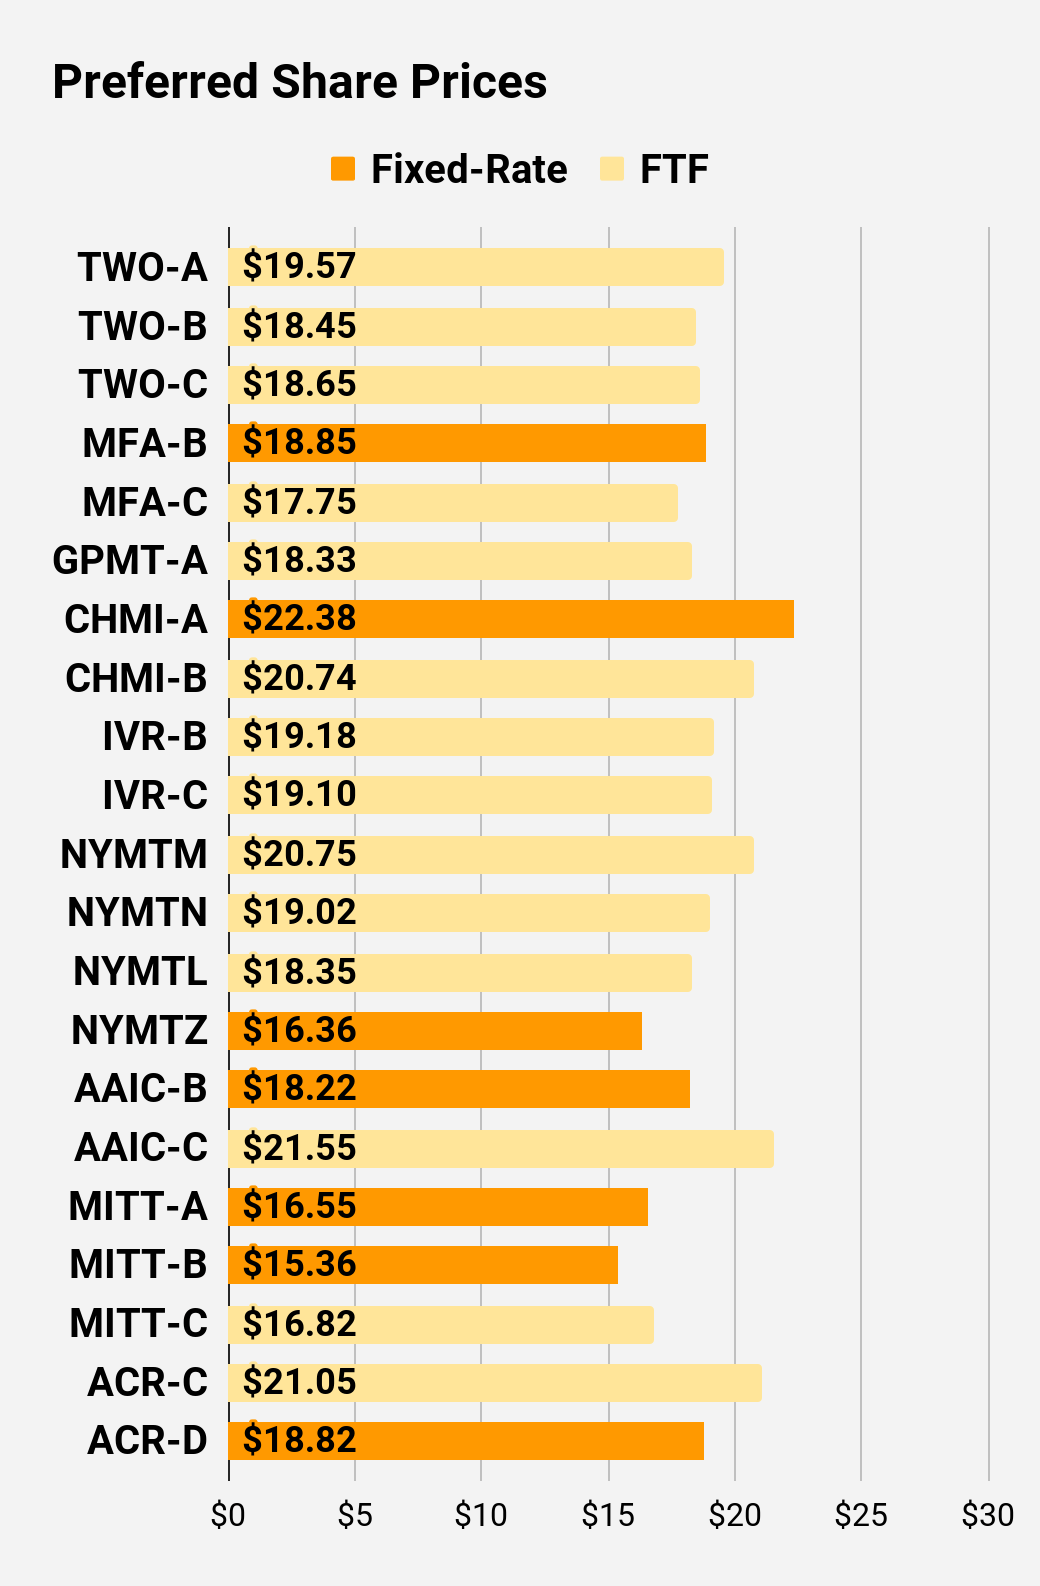
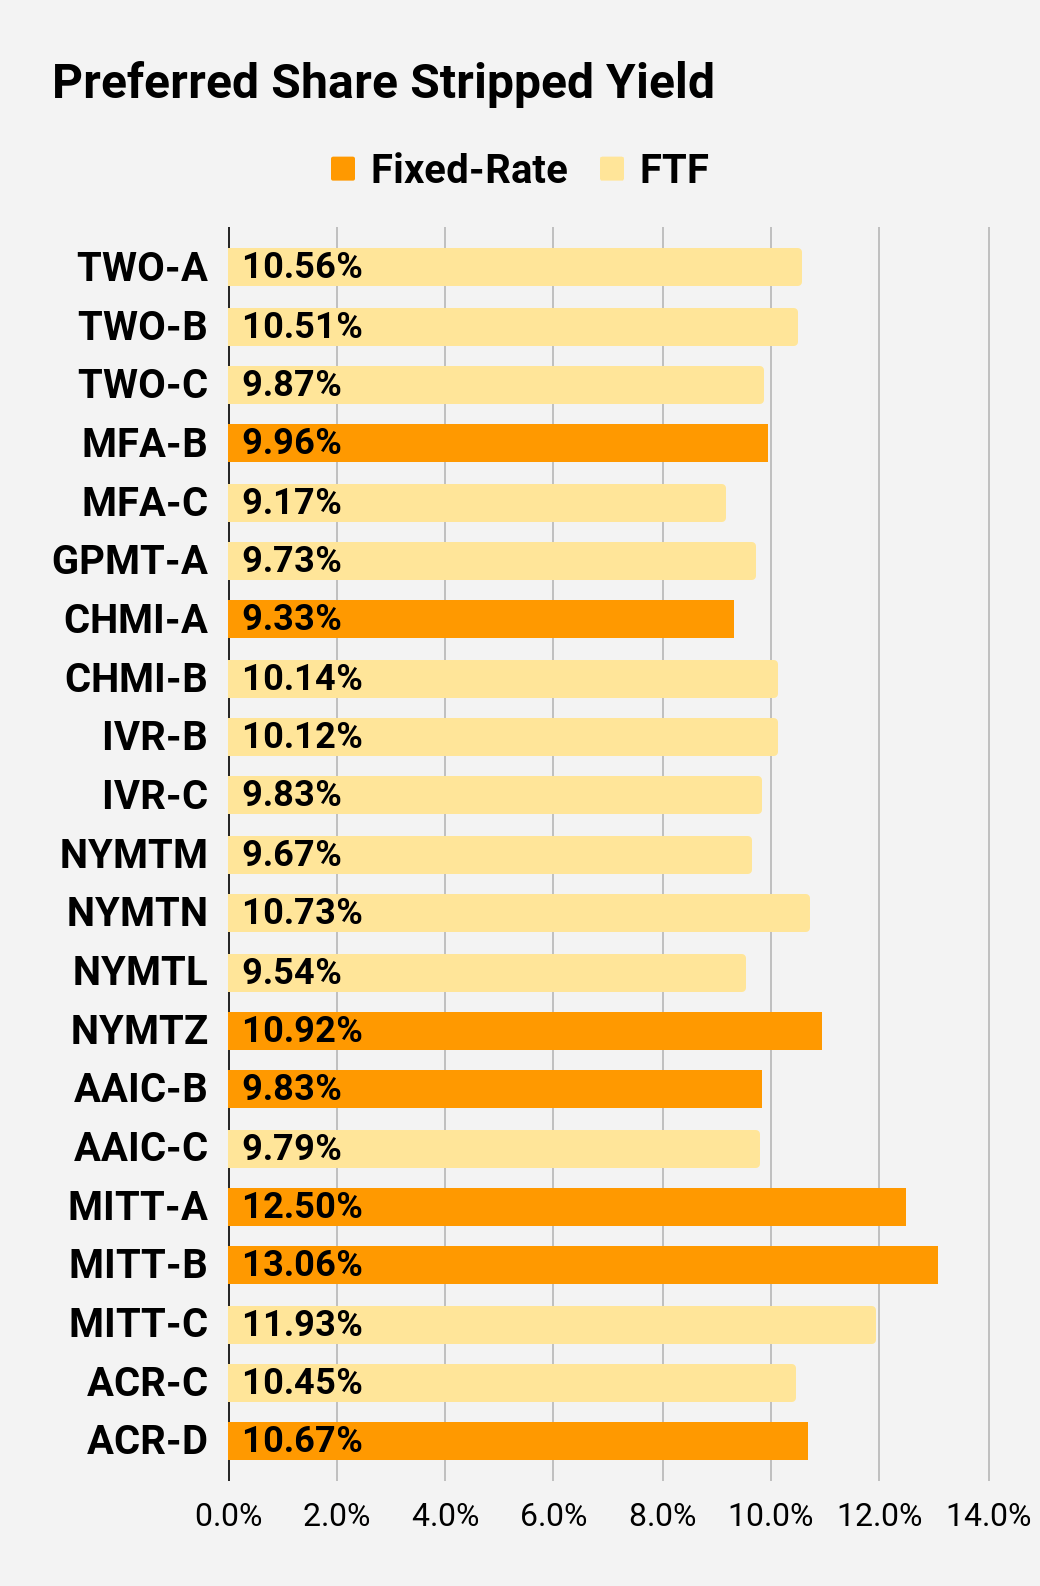
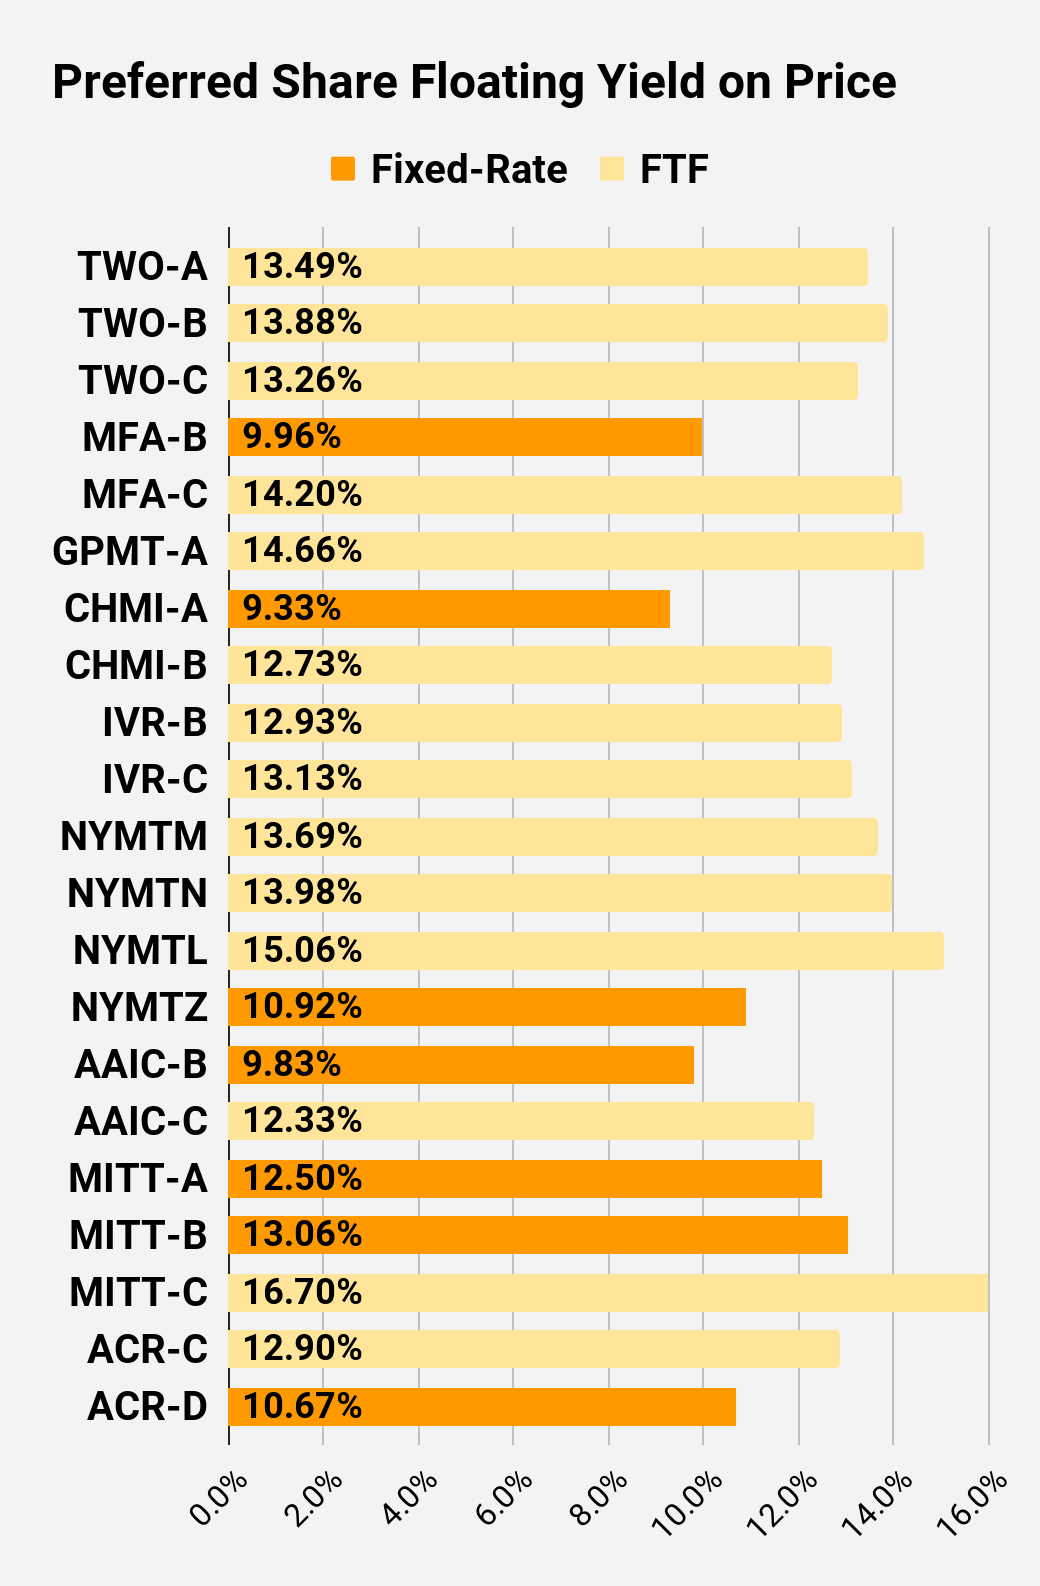
Preferred Share Charts
I changed the coloring a bit. We needed to adjust to include that the first fixed-to-floating shares have transitioned over to floating rates. When a share is already floating, the stripped yield may be different from the “Floating Yield on Price” due to changes in interest rates. For instance, NLY-F already has a floating rate. However, the rate is only reset once per three months. The stripped yield is calculated using the upcoming projected dividend payment and the “Floating Yield on Price” is based on where the dividend would be if the rate reset today. In my opinion, for these shares the “Floating Yield on Price” is clearly the more important metric.
 The REIT Forum |
 The REIT Forum |
 The REIT Forum |
 The REIT Forum |
 The REIT Forum |
 The REIT Forum |
Preferred Share Data
Beyond the charts, we’re also providing our readers with access to several other metrics for the preferred shares.
After testing out a series on preferred shares, we decided to try merging it into the series on common shares. After all, we are still talking about positions in mortgage REITs. We don’t have any desire to cover preferred shares without cumulative dividends, so any preferred shares you see in our column will have cumulative dividends. You can verify that by using Quantum Online. We’ve included the links in the table below.
To better organize the table, we needed to abbreviate column names as follows:
- Price = Recent Share Price – Shown in Charts
- BoF = Bond or FTF (Fixed-to-Floating)
- S-Yield = Stripped Yield – Shown in Charts
- Coupon = Initial Fixed-Rate Coupon
- FYoP = Floating Yield on Price – Shown in Charts
- NCD = Next Call Date (the soonest shares could be called)
- Note: For all FTF issues, the floating rate would start on NCD.
- WCC = Worst Cash to Call (lowest net cash return possible from a call)
- QO Link = Link to Quantum Online Page
Second Batch:
Strategy
Our goal is to maximize total returns. We achieve those most effectively by including “trading” strategies. We regularly trade positions in the mortgage REIT common shares and BDCs because:
- Prices are inefficient.
- Long term, share prices generally revolve around book value.
- Short term, price-to-book ratios can deviate materially.
- Book value isn’t the only step in analysis, but it is the cornerstone.
We also allocate to preferred shares and equity REITs. We encourage buy-and-hold investors to consider using more preferred shares and equity REITs.
Performance
We compare our performance against four ETFs that investors might use for exposure to our sectors:

The REIT Forum
The four ETFs we use for comparison are:
|
Ticker |
Exposure |
|
One of the largest mortgage REIT ETFs |
|
|
One of the largest preferred share ETFs |
|
|
Largest equity REIT ETF |
|
|
The high-yield equity REIT ETF. Yes, it has been dreadful. |
When investors think it isn’t possible to earn solid returns in preferred shares or mortgage REITs, we politely disagree. The sector has plenty of opportunities, but investors still need to be wary of the risks. We can’t simply reach for yield and hope for the best. When it comes to common shares, we need to be even more vigilant to protect our principal by regularly watching prices and updating estimates for book value and price targets.
Ratings: None in this article.
Be the first to comment