

Chris Hondros
Manole Capital Management
Oct’22
How Goldman Sachs (NYSE:GS) + Apple (AAPL) + Mastercard (MA) Didn’t Work
Spending
Some of the fundamentals and metrics we like to follow are monthly retail spending trends. Mastercard provides monthly data in their SpendingPulse report, and they also provide estimates for the upcoming holiday shopping season. We like these Mastercard metrics, as they capture in-store and online retail sales, across all forms of payment (not just those on MA).
Before we look ahead to the important holiday season, let’s examine the last two months of spending trends. In August 2022, Mastercard SpendingPulse reported US retail sales grew +11.7% YoY and +20.4% compared to 2019. eCommerce sales in August grew +8.9% and +100.2% compared to the same period during Covid. The sectors showing strong double-digit growth were restaurants, airlines, and lodging. In September 2022, Mastercard SpendingPulse reported US retail sales accelerated sequentially and grew +11.0% YoY and +24.6% compared to 2019. eCommerce sales in September also accelerated sequentially and grew +10.7% and were +90.3% higher versus the same period during Covid. In-store sales remained strong at 11.1% YoY too. The sectors showing strong double-digit growth were electronics, as well as last month’s restaurants, airlines, and lodging, while retail sectors contracting or slowing were luxury and hardware / housing related spending.
During this upcoming holiday season (which covers November 1st through December 24th), Mastercard is estimating that US retail sales will increase +7.1% YoY. Last year, US retail sales grew +8.5% YoY, as there was pandemic-induced spending and pent-up demand. Also, this was impressive growth off of a low +0.4% in 2020, which was clearly Covid-19 impacted.
Retailers are planning for certain in-store experiences, in an attempt to draw shoppers into their stores. Mastercard expects holiday door-busters to boost traffic and drive consumers to increase spending by +7.9% YoY. eCommerce continues to grow, especially due to its convenience, and grow +4.2% YoY (up 70% pre-Covid).
Clearly, spending trends remain quite robust, despite all of the market worries. As Visa’s (V) CEO Al Kelly just said at a business conference, “the consumer still feels quite strong, and we are just not seeing these negative impacts in our numbers.” Brian Moynihan, CEO of Bank of America (BAC), echoed those bullish sentiments when he said, “US consumers are in good shape and will continue to spend at an elevated clip.”
Growth
The payments industry has always been a staple of our portfolio. Why are these spending metrics so resilient, despite so many economic uncertainties? We believe it has a lot to do with the slow and steady migration away from paper cash, but also due to materially growing the card acceptance footprint. In 2012, Visa had roughly 25 million acceptance points around the world. Now, Visa has 80 million and the number exceeds 100 million, if one includes payment facilitators like Square, Adyen and Stripe. In the last decade, the number of global card acceptance points has increased by 4x. This occurs because the payment networks are leveraging technology and focusing their attention on new categories like rent, parking lots, vending machines, etc.
As we continue to highlight, global card penetration is still fairly low. While it is estimated to be at 60% to 70% in the United Kingdom, Canada, and the United States, it is only 53% in Ireland, 46% in Chile, 34% in Spain, 29% in Poland, 23% in Germany, and 21% in Mexico. Because of these factors, we are confident that we’re still in the early innings of this payment secular growth tailwind.
Nobody should forget that consumer spending accounts for about 2/3rd’s of US economic activity. The US Bureau of Economic Analysis highlights PCE (Personal Consumption Expenditures) growth and it is a beautiful chart (up and to the right, except for a little Covid blip). PCE has been one of the key growth components of our economy and thank goodness that Americans love to shop and spend their hard-earned money.
Payment Economics
Before we dive into GS and their Apple Card, we thought it would be helpful to review typical payment economics. Credit card interchange rates are set by the payment networks (Visa, Mastercard and American Express (AXP)) and are then re-priced by merchant acquirers and payment processors, at a slight mark-up to merchants. This all-in cost to transact is called the MDR (merchant discount rate). The interchange rates range from a low of 1.3% (grocery stores or gas stations) all the way up to 2.9% (pornography, tobacco, alcohol, etc.) of the sale. This wide range is dependent upon the network used, the type of merchant, the size of the transaction and a whole host of other factors. We created this pie chart to display how these fees get re-distributed to each party, so one can easily understand the economics of a typical $100 credit card transaction. As you can see, the vast majority of the economics go to the card issuers and banks, for taking the vast majority of the risk while the smallest component of these fees goes towards the payment networks.
Warren Fisher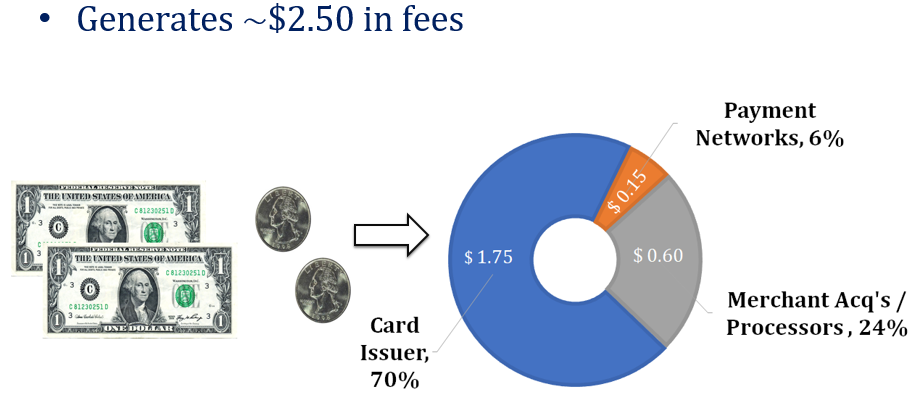
Delinquencies Ultimately Matter
As we just mentioned, spending trends remain quite healthy. One of the reasons we don’t like to invest in the card issuing sector is that they are the entities that take the most risk in the payment ecosystem. As our earlier pie chart shows, card issuers earn roughly 70% of the MDR, but they are taking the most risk in each transaction. Making matters worse, there is no collateral to these lines of credit, unlike a house or car that could be foreclosed upon or re-possessed. In addition, they are enticing customers with loyalty and rewards programs, that ultimately have significant costs.
While our payment networks, merchant acquirers and payment processors do not have the same level of credit risk, we like to monitor credit delinquency trends. We analyze monthly master trust loan data to get an understanding of how consumers are spending and if they are paying back those charges. Firms like American Express, Bank of America, Citigroup (C), Discover (DFS), JPMorgan (JPM), Synchrony (SYF) all publish monthly data on payment rates, excess spreads, cash flow and delinquencies. As consumers fail to make minimum payments, balances can balloon higher, especially when one considers that the average (according to Bankrate) US credit card interest rate is 17.96%. This is the highest interest rate on record since 1996. Analysts can track 30-day, 60-day and then 90-day delinquency rates, which unfortunately then leads to card issuers writing-off accounts at a loss.
What are recent delinquency trends? American Express has a higher-end customer and its delinquency rates are quite low at 0.8% (August 2022). Discover typically runs in the middle-of-the-pack and has a delinquency rate in August of 1.96%. This was higher by 57 basis points YoY or an increase of 40%. Both JP Morgan and Bank of America just released 3 rd quarter results and reported healthy consumer spending trends and below Covid levels of delinquencies.
In addition to the monthly master trust data, TransUnion provides an annual update each year on card delinquency rates. TransUnion estimates there were about 500 million bank-issued credit cards in circulation this summer, up +7.5% YoY. That was a larger than expected increase in credit cards in circulation, as some card issuers seemed to be aggressively granting lines of credit to American consumers. On those half a billion credit cards, TransUnion states the delinquency rates averaged 1.57% with an average balance per consumer of $5,270.
While these are still below Covid levels, both metrics showed a noticeable increase versus last year. Many of these card issuers are working with consumers that are facing economic uncertainty and are providing some with financial assistance. Unfortunately, more and more consumers are experiencing stress, leading to higher delinquencies and loss rates for issuers. Speaking of credit losses, we will now discuss the “most successful” new credit card launched in the industry over the last couple of years.
The Apple + Goldman Sachs + Mastercard:
How could one product that combines these three fantastic companies not be a total homerun, right? Well, it comes down to focus. Apple focuses on building its iPhone, while Mastercard is a scalable network for billions of payment transactions. We aren’t necessarily sure that GS brought card issuing expertise to this partnership.
GS Apple card (Warren Fisher) GS Apple card (Warren Fisher)
Back in 2019, Goldman Sachs made a splash in the card industry by working with Apple and Mastercard on a credit card. The actual card is fairly sleek (as you can see below), as customers names are etched into an Apple titanium card. The no-fee card generated a lot of hype, as many early users were quick to post their latest card on various social media sites.
The initial goal of Marcus (back in 2016) was to leverage Goldman’s wonderful name brand and build a full-service digital bank. This card was a large piece of GS’s ambitions to grow its retail banking franchise called Marcus. After 5 years, Marcus now has 14 million customers and $16 billion in loan balances. Surprisingly, Marcus now represents nearly 20% of the firm’s total revenue.
We thought it would be interesting to look how the Apple Card is doing in terms of loans and exposures. With over $100 billion in assets, this has been a successful source of cheap deposits for GS. Despite having an institutional / “white shoe” brand in the investment banking and trading world, GS’s Apple Card has been a disappointment.
The original plan was to roll-out checking accounts to the masses, but this hasn’t been the windfall that some executives projected. After rolling out its simple checking accounts, Marcus wanted to then offer easy-to-use consumer lending products. This was the initial thesis GS likely had with its Apple Card. With the disappointing results in this card partnership, GS management must now be viewing this as a questionable move.
It has been widely written that GS’s consumer division is on track to lose $1.2 billion this year, and it will likely have to set aside more in reserves to cover future loan losses. A recent Bloomberg article (on Marcus) stated that cumulative losses for Marcus exceed $4 billion and that’s before one accounts for the $2.2 billion deal for GreenSky (loan provider) last year. This division has encountered significant management turnover, costly overruns, and missed most of its internal profitability targets. Inside of GS, there are divisions and legions of employees that question why the company took this questionable tact. David Solomon, GS’s CEO, has steadfastly supported Marcus, but many institutional shareholders are disappointed that he continues to throw more money at this struggling entity.
How do GS’s results compare to some other card issuers? Competitors like Bank of America are enjoying record high repayment rates, while GS’s loss rate on credit card loans hit 2.93% in the second quarter. This is one of the highest levels of delinquencies of any of the major US card issuers. American Express indicated that its trends “remain strong”, especially in the SMB and premium consumer segments. Discover cited strong consumer spending and healthy credit quality. With GS ranking at the bottom of the card issuer table, one has to wonder if it is second guessing whether or not its retail ambitions in 2016 were misguided.
The early results have not been positive, largely because of selecting and granting the wrong customers with lines of credit. Roughly a quarter of its customers (and those lines of credit) went to customers with FICO scores less than 660 (defined as “fair to poor”). While we are not a believer that FICO scores are the only credit metric to monitor, it does pay to understand how certain card issuers are bypassing understanding the risks of adding new accounts. The whole purpose of a credit score is to risk rank your consumers. One can use the score at the initial acquisition of an account, or you can measure it through the entire credit cycle. We believe it is better to constantly monitor this information, but that is often viewed as overkill and un-necessary (like a belt and suspenders approach). Did GS properly assess the risk in its initial Apple Card underwriting?
When the credit cycle turns (and it always eventually does), adding some of those higher risk accounts could prove costly. Adding new accounts requires that credit card issuers calibrate their loan approval models to the underlying risk. Did GS take on lower quality clients to appease their new partner – Apple? Were these some of the conditions that GS had to agree to, that others like JP Morgan felt were too onerous? We weren’t a party to those behind-the-scenes negotiations, but we’d be surprised if Apple didn’t look for and ask for credit waivers.
These are unfortunately the decisions that become quite costly, as these are the first customers to turn delinquent in an economic downturn. The Federal Reserve Bank of New York does a survey about the mean probability of consumers being able to make their minimum debt payments. Unfortunately, this survey found that 12.2% of consumers will not be able to make their minimum debt payments (up from 10.8% last month).
We don’t point out these Marcus flaws to act as a bearish note on GS. We are simply trying to get across a couple of key investment themes. One is “stick to your knitting”. In our opinion, GS has a wonderful brand and is known around the world as one of the best institutional broker dealers. It dominates investment banking, advisory work, and trading. Why did it need to branch out into checking accounts and card issuing? This endeavor hasn’t helped GS’s valuation, as it is now trading below book value.
The second point we are making is truly understanding the business you are in. When it comes to advisory work or banking or trading, GS serves its clients and acts as a valuable partner. Helping clients solve their financial issues is exactly what GS has done for decades, and what they should be doing for years to come. How does offering a $2,000 line of credit to a Gen-Z student build on GS’s brand? Maybe that consumer becomes a customer of GS’s in 10 or 15 years, but we’re not sure this venture was true to its culture and long-term aspirations. The card issuing business comes with tremendous balance sheet risk and further exposes GS to cyclical businesses. We simply believe it was a business venture that didn’t need to occur and should be viewed as a mistake.
Looking back a few years, GS certainly was enamored with the idea of launching a FINTECH business. With its strong presence in Silicon Valley, many GS executives thought it would be simple to migrate from an institutional and corporate business, to one that could dominate an average US consumer franchise. Is launching a new high-yield savings account truly novel and inspirational? After 5 years, maybe GS management will re-assess whether or not Marcus and its “world’s greatest” consumer checking account fits into its long-term business plans.
Conclusion:
We strive to never get “married to an idea” or be too stubborn to admit when we are wrong. One of the legends of investing is Charlie Munger, the 98-yr old sidekick of Warren Buffett. We agree with Mr. Munger who said “We all are learning, modifying, or destroying ideas all the time. Rapid destruction of your ideas when the time is right is one of the most valuable qualities you can acquire. You must force yourself to consider arguments on the other side.”
Warren Fisher, CFA
Founder and CEO
Manole Capital Management
DISCLAIMER:
Firm: Manole Capital Management LLC is a registered investment adviser. The firm is defined to include all accounts managed by Manole Capital Management LLC. In general: This disclaimer applies to this document and the verbal or written comments of any person representing it. The information presented is available for client or potential client use only. This summary, which has been furnished on a confidential basis to the recipient, does not constitute an offer of any securities or investment advisory services, which may be made only by means of a private placement memorandum or similar materials which contain a description of material terms and risks. This summary is intended exclusively for the use of the person it has been delivered to by Warren Fisher and it is not to be reproduced or redistributed to any other person without the prior consent of Warren Fisher. Past Performance: Past performance generally is not, and should not be construed as, an indication of future results. The information provided should not be relied upon as the basis for making any investment decisions or for selecting The Firm. Past portfolio characteristics are not necessarily indicative of future portfolio characteristics and can be changed. Past strategy allocations are not necessarily indicative of future allocations. Strategy allocations are based on the capital used for the strategy mentioned. This document may contain forward-looking statements and projections that are based on current beliefs and assumptions and on information currently available. Risk of Loss: An investment involves a high degree of risk, including the possibility of a total loss thereof. Any investment or strategy managed by The Firm is speculative in nature and there can be no assurance that the investment objective(s) will be achieved. Investors must be prepared to bear the risk of a total loss of their investment. Distribution: Manole Capital expressly prohibits any reproduction, in hard copy, electronic or any other form, or any re-distribution of this presentation to any third party without the prior written consent of Manole. This presentation is not intended for distribution to, or use by, any person or entity in any jurisdiction or country where such distribution or use is contrary to local law or regulation. Additional information: Prospective investors are urged to carefully read the applicable memorandums in its entirety. All information is believed to be reasonable, but involve risks, uncertainties and assumptions and prospective investors may not put undue reliance on any of these statements. Information provided herein is presented as of the date in the header (unless otherwise noted) and is derived from sources Warren Fisher considers reliable, but it cannot guarantee its complete accuracy. Any information may be changed or updated without notice to the recipient. Tax, legal or accounting advice: This presentation is not intended to provide, and should not be relied upon for, accounting, legal or tax advice or investment recommendations. Any statements of the US federal tax consequences contained in this presentation were not intended to be used and cannot be used to avoid penalties under the US Internal Revenue Code or to promote, market or recommend to another party any tax related matters addressed herein.
Be the first to comment