

TexBr/iStock via Getty Images
By Cristopher Anguiano
U.S. Equities’ Predominance
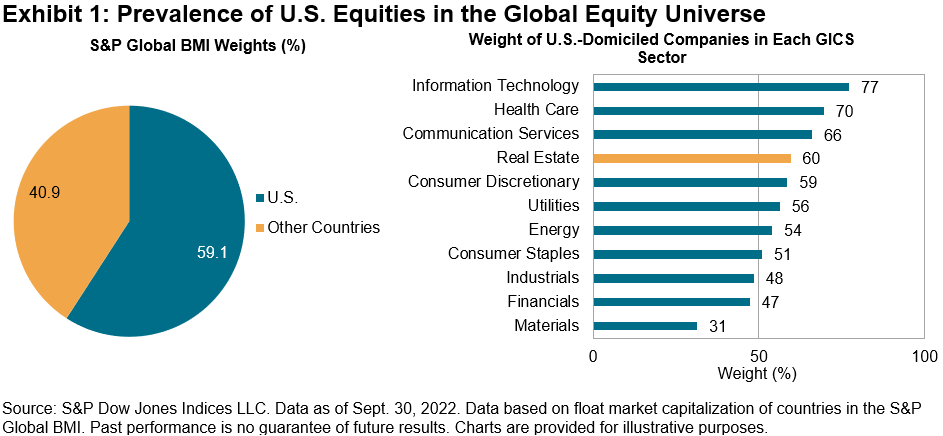
U.S. equities represent 59.1% of the total global equity market in terms of float market capitalization (FMC) and at least 50% of the weight in 8 of the 11 GICS sectors globally. Given trends and narratives, U.S. equities seem to have an outsized role in explaining performance globally and may help investors to understand market dynamics.
Real Estate Sector Evolution
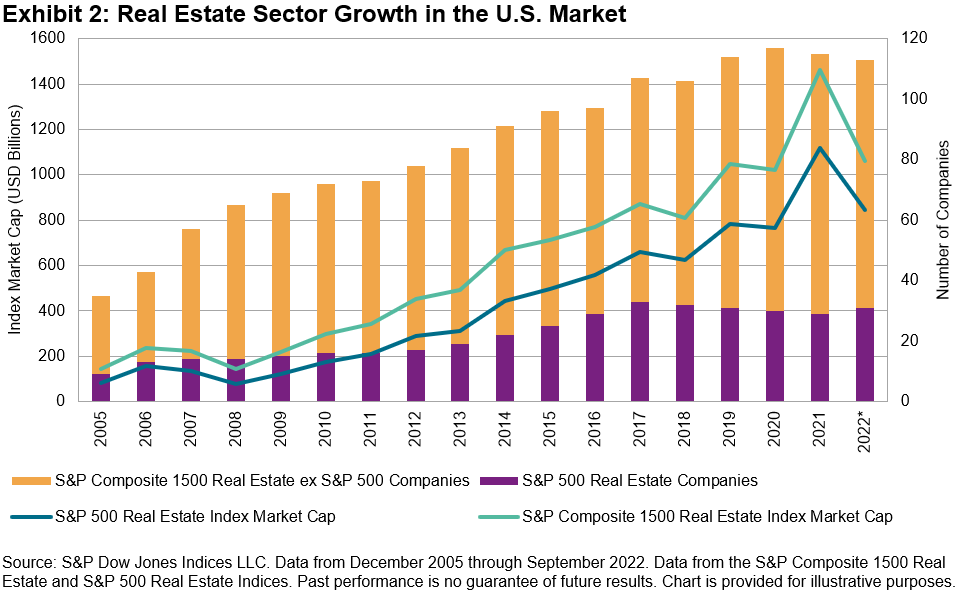
U.S.-domiciled companies accounted for 60% of the global Real Estate sector’s float-market capitalization as of Sept. 30, 2022, and Real Estate companies within the U.S. market have increased in number and size over the past decade. For example, Exhibit 2 shows there were 113 Real Estate companies in the S&P Composite 1500® at the end of September 2022, with a collective FMC of USD 1,060 billion, up from 35 companies with USD 142 billion of FMC at the end of 2005.
Long-Term Risk/Return Characteristics
The S&P IPSA, the Chilean large-cap benchmark, has shown strong returns YTD. But over the long term, the U.S. Real Estate Select Sector and the S&P 500® outperformed with lower return volatility.
Combined with the relatively low average five-year rolling correlation (0.33) between the Real Estate Select Sector and the S&P IPSA, historically, Chilean market participants may wish to consider the potential diversification of incorporating U.S. Real Estate and U.S. equities more broadly.
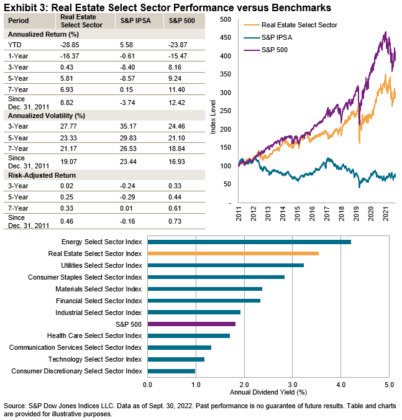
The Real Estate Select Sector has grown in recent years and has offered higher dividend yield than the S&P 500 and many of its GICS sector segments. Hence, this sector and the U.S. equities market may be of interest to Chilean investors, especially in the current inflationary environment.
Disclosure: Copyright © 2022 S&P Dow Jones Indices LLC, a division of S&P Global. All rights reserved. This material is reproduced with the prior written consent of S&P DJI. For more information on S&P DJI please visit S&P Dow Jones Indices. For full terms of use and disclosures please visit Terms of Use.
Editor’s Note: The summary bullets for this article were chosen by Seeking Alpha editors.
Be the first to comment