


virtualphoto/E+ via Getty Images
Introduction
At my grandparents’ house growing up, there was a book on the shelf called Dow 36,000. My grandpa wasn’t a fan of this book. The authors boldly claimed that the Dow would surge from roughly ~10,000 to 36,000 within five years of publication in 1999. By the time I found it on my grandpa’s shelf in 2008, the Dow had instead fallen to under 10,000. Grandpa wasn’t alone. After publication, Dow 36,000 was mocked in the media for making some of the most spectacularly wrong investment predictions ever. You can pick up a used copy today for about a dollar.
Spending a good deal of time with my grandparents growing up gave me two great skills I’ve carried with me my whole life, the first being the stock market and the second being the game of golf. I owe a debt of gratitude to the people who helped shape me – from my parents, who introduced me to good food and traveling, to the posh English lady next door who taught me the importance of reading, to my friends from school who got me into watching excessive amounts of NFL– all habits I’ve carried over for my whole life. Unlike the authors of Dow 36,000, I had better timing getting into the markets in 2008. I guess they were eventually vindicated (sort of) when the Dow hit 36,000 in 2021, 17 years behind schedule.
In the spirit of sticking my neck out with long-term predictions about the stock market, we’re going to look at where the broader S&P 500 index (NYSEARCA:SPY) will be in 10 years, with some analysis of demographics, public finance, and possible improvements in technology.
What Will Happen With The Stock Market?
No one knows for sure what will happen with the stock market over the next 10 years, but we can make educated guesses based on earnings trends, demographics, government finances, and GDP growth projections.
First, we’ll look at whether the short-run valuation is high or low, and second we’ll present the greatest challenge and the greatest opportunity for the markets over the next 10 years. Finally, we’ll close with my projections for the price of the S&P 500 in 10 years, and key takeaways for investors.
The Short-Term Outlook For The S&P
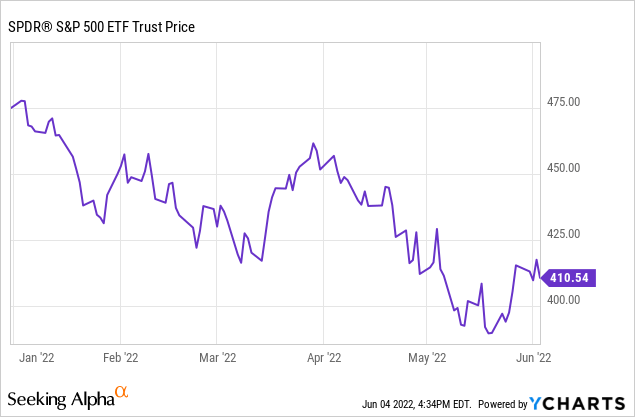
The first thing you should know about the short-term outlook for the S&P 500 is that stocks are in a downtrend. This is pretty important because research shows that stocks do much better when they’re in an uptrend than when they’re in a downtrend, especially on a risk-adjusted basis.
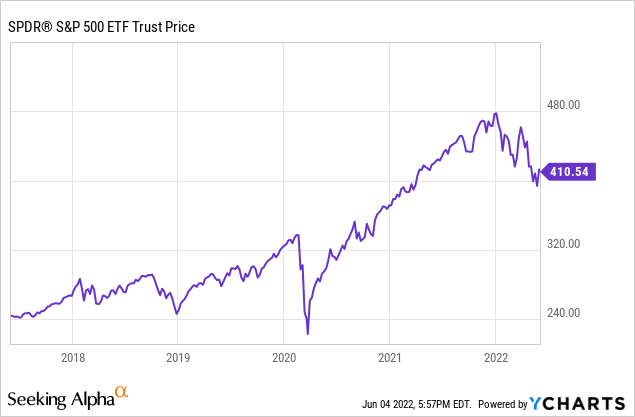
The S&P 500 is down about 14% for this year after a raging bull market since the turn of the decade.
Will The Markets Go Lower?
I’ve covered this a good deal before, but I’ll reiterate (long-time readers may wish to skip this section). It’s worth noting that 2021 was the best year for corporate profits in history. Much of this was driven by stimulus. Relief checks totaled $8,000 for the median family of four ($600 per person in late December 2020, $1,400 more in March). The expanded child tax credit paid the median family of four $500-600 per month for most of 2021. Most borrowers with student loans didn’t pay anything toward them, their collective tab now totaling nearly $1.8 trillion. The eviction and foreclosure moratoriums allowed millions of people to live rent free and spend the money on consumption instead. Expanded unemployment benefits paid millions of people as well.
That’s not all. Helped by the Federal Reserve’s quantitative easing policies, millions of Americans refinanced their mortgages in 2020 and 2021, lowering their payments and combining with the moratoriums helping spark a huge boom in housing by boosting demand and temporarily curtailing supply at the same time. Borrowers collectively pulled out $275 billion in equity via cash-out-refinances during this time. At the same time, many people looked at their swelling 401k balances or cryptocurrency investments and decided they’d had enough of working.
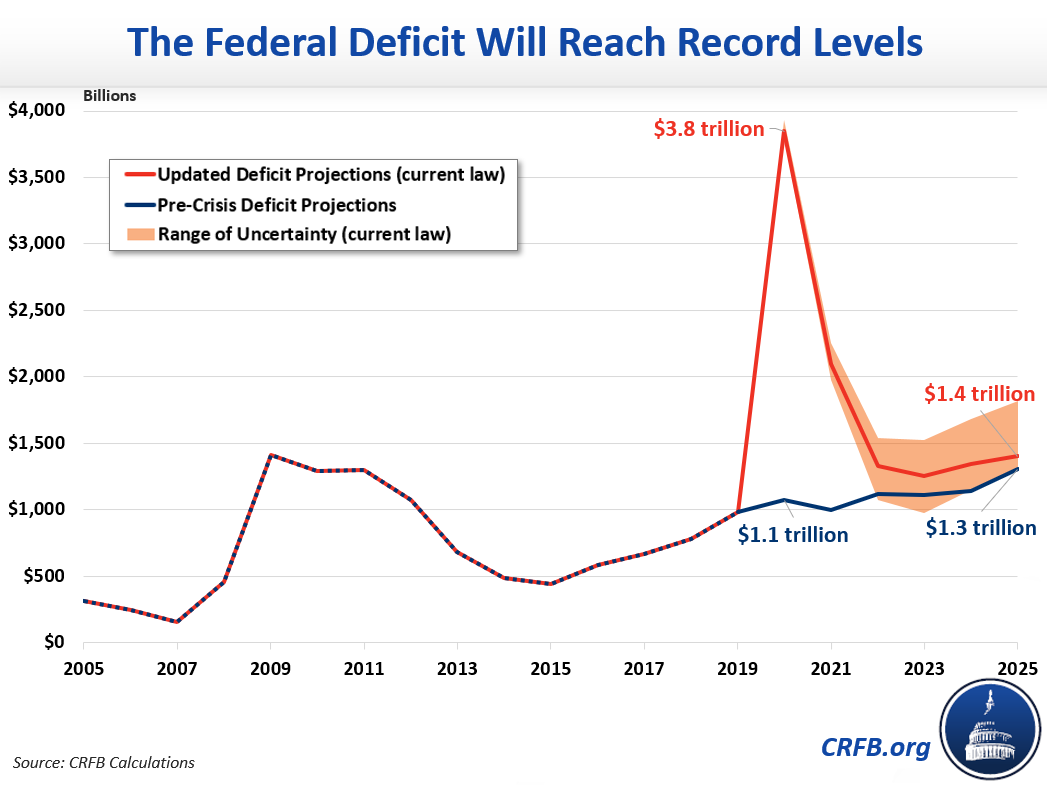
CRFB
These factors all combined to make 2021 the best year ever for corporate profits. S&P 500 earnings hit $209, smashing the record of $163 set in 2019 by nearly 30%. In light of everything going on in 2021, the fact that earnings were so good is not surprising. But the true question is whether they’re sustainable going forward – my analysis suggests probably not, and that we might need to trade closer to pre-COVID prices than post-COVID prices for the market at large. The consensus of Wall Street analysts, on the other hand, is to expect earnings to sustain at current levels and increase at historically unprecedented levels from here. Where will they get the money though?
Complicating matters is the Federal Reserve, which is now tasked with the unenviable job of reversing the boom in stimulus now that the effects of the coronavirus on the economy have subsided. Going forward, the paths of inflation and earnings will be the key drivers of stocks.
I don’t have all the answers here, but the market has spoken so far this year, pricing in a more aggressive Fed and reductions in earnings growth, especially in the technology and consumer discretionary sectors. Key tests for whether Wall Street gets this right or we do include May CPI (June 10th release), June CPI (July 13), and Q2 earnings for S&P 500 components (throughout July and August).
We’re in some trouble from a stock market perspective if the pandemic boom was cyclical and driven by the government and not a fundamental change that made the economy more profitable. It’s increasingly looking like it was the former, although there is some hope for the latter later on.
The Long-Term Outlook For The S&P 500
You may not have seen this graph before, but it’s one of the most important factors for determining your future.
The Bad News: Demographics
This is a graph of the percentage of US residents in each age bracket, also known as a population pyramid.
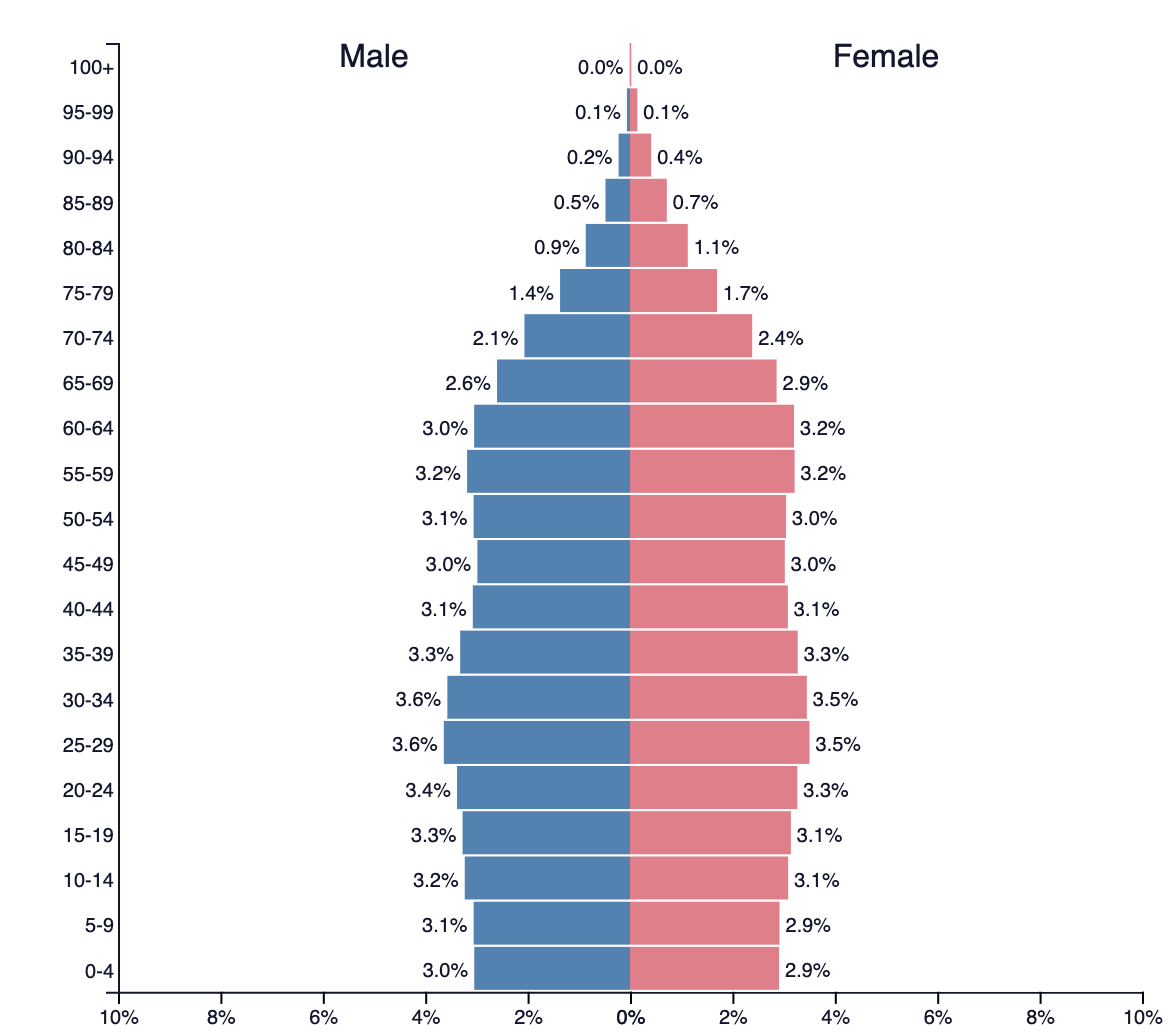
US Population Pyramid 2021 (Populationpyramid.net)
A few key points.
- There are millions of late Baby Boomers and early Gen Xers that are 50+ and are looking to retire. Most of them actually haven’t saved much money for retirement though, so we’ll see how this plays out! They’re not very healthy either, which is going to cost taxpayers an incredible of money.
- I’m 26. My lifetime has been marked by steadily declining birth rates. As such, the class of kindergarteners in the US today is about 20% smaller than mine was 20 years ago. Early on in this trend, the argument was that millennials were delaying having kids – now it’s clear that they’re not having them in large part. These two megatrends of aging Boomers and lower birth rates have huge implications for everything from healthcare to housing to education, and it’s likely to be at least somewhat of a drag on GDP growth going forward.
- In the past few decades, the US has experienced something called a demographic dividend. Lower birth rates combined with a small population of elderly meant we could have lower taxes for the same public services, and the demographics would help the economy grow. This allowed us to get away with poor policies, which we’ll get into in a second. This demographic gift is gone, and it will now be moving into reverse into a demographic drag. We might be able to offset some of this change with skilled immigration, but it’s by no means a panacea. The situation that many European countries are in now is where the US will be in 10-15 years’ time – the difference being that their markets are cheap on a P/E basis while ours is still very expensive.
In countries with strong rule-of-law and good property rights, nominal corporate profits (long-run growth of 6.5% annually or so, or about 3.1% real growth) should track very closely with the growth in nominal GDP, which I calculated at 6.3% annualized over the last 75 years. Note that in emerging market countries where corporate governance isn’t much of a thing, then often the GDP growth gets separated from investors’ pockets, but that’s a topic for another article.
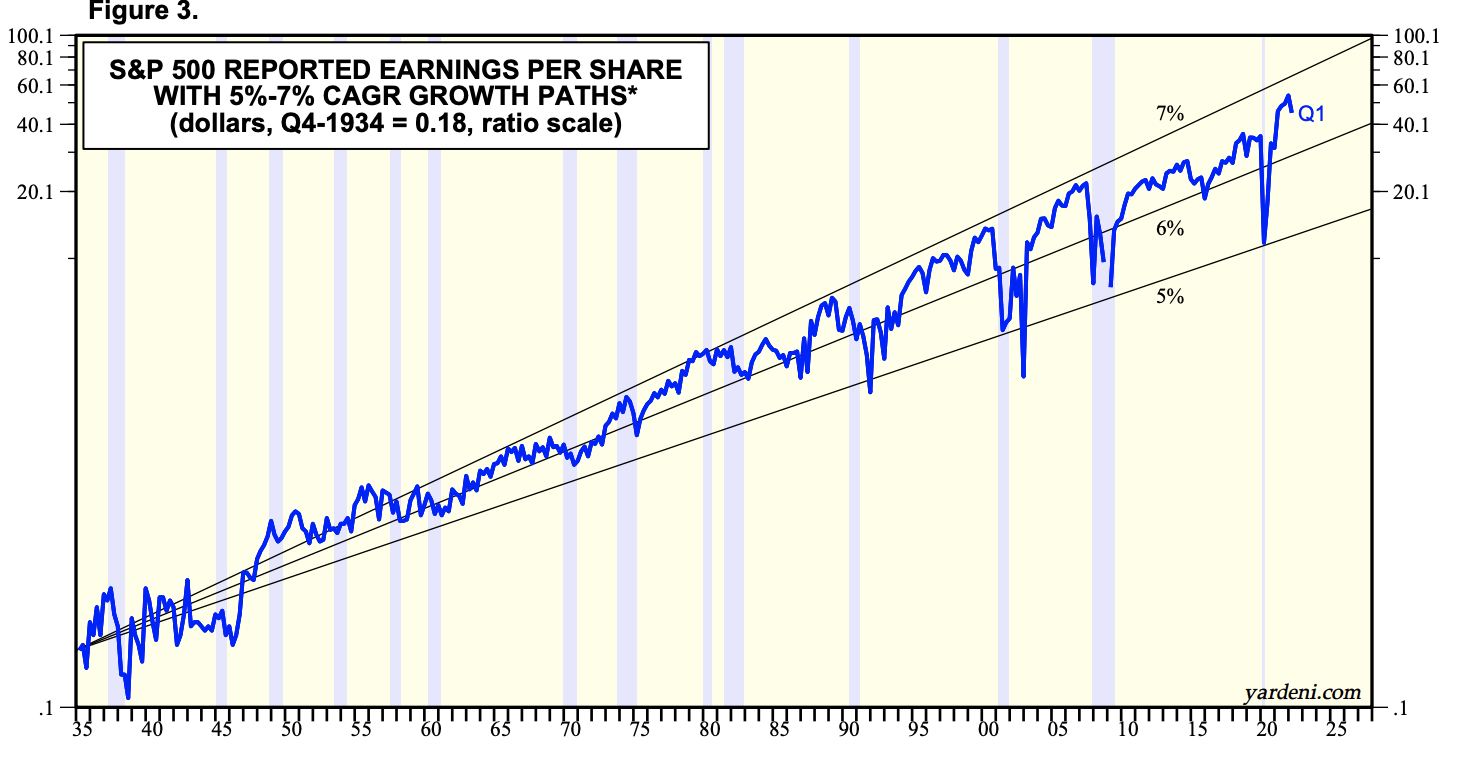
Corporate Profit Growth (Ratio Scale) (Yardeni Research)
Since the turn of the century, GDP growth has slowed down substantially. US real GDP only grew about 1.8% annually in the 2000s before improving to about 2.2% annually in the 2010s (add about 2% for inflation to get nominal figures). And the jury is still out for the 2020s, but we’re not doing so hot so far.
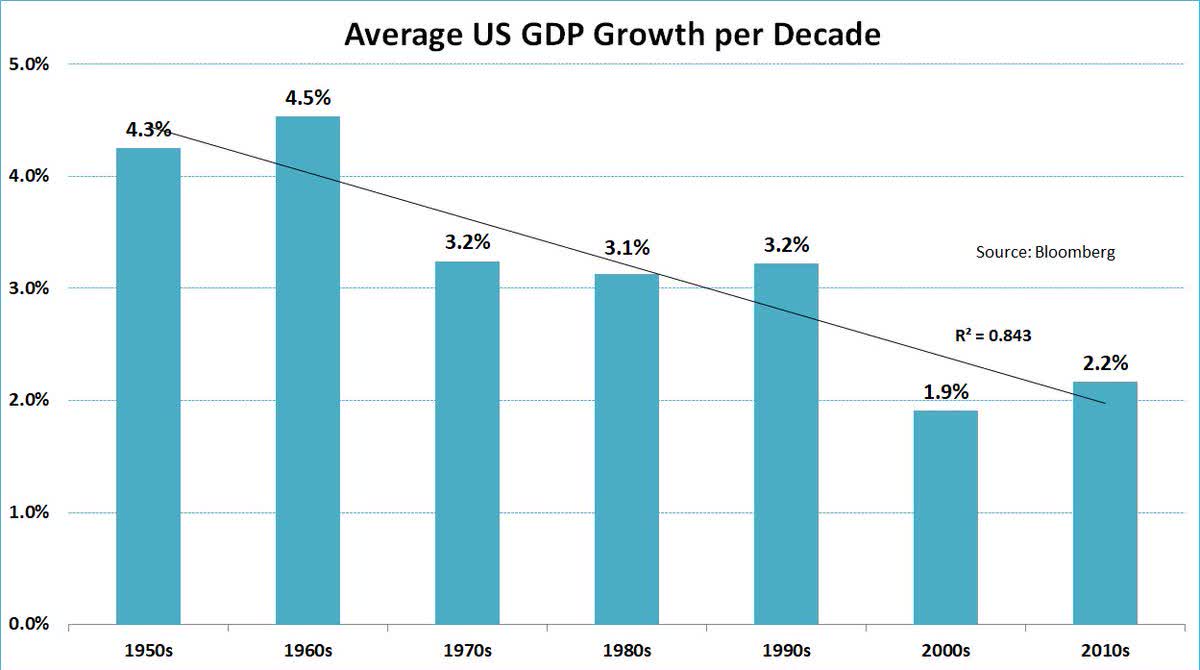
Real GDP Growth Is Slowing Down (Bloomberg)
Corporate profits, on the other hand, have not slowed down to the same extent and have recently accelerated. The main reason why this is – several rounds of tax cuts and interest rate decreases by the US government to attempt to boost demand and get things back on track. It’s worked superficially because corporate profits are up, but when you look under the hood, we’re spending substantially more than we’re earning as a country and we’re getting crushed on measures like life expectancy, life satisfaction, and debt to GDP.
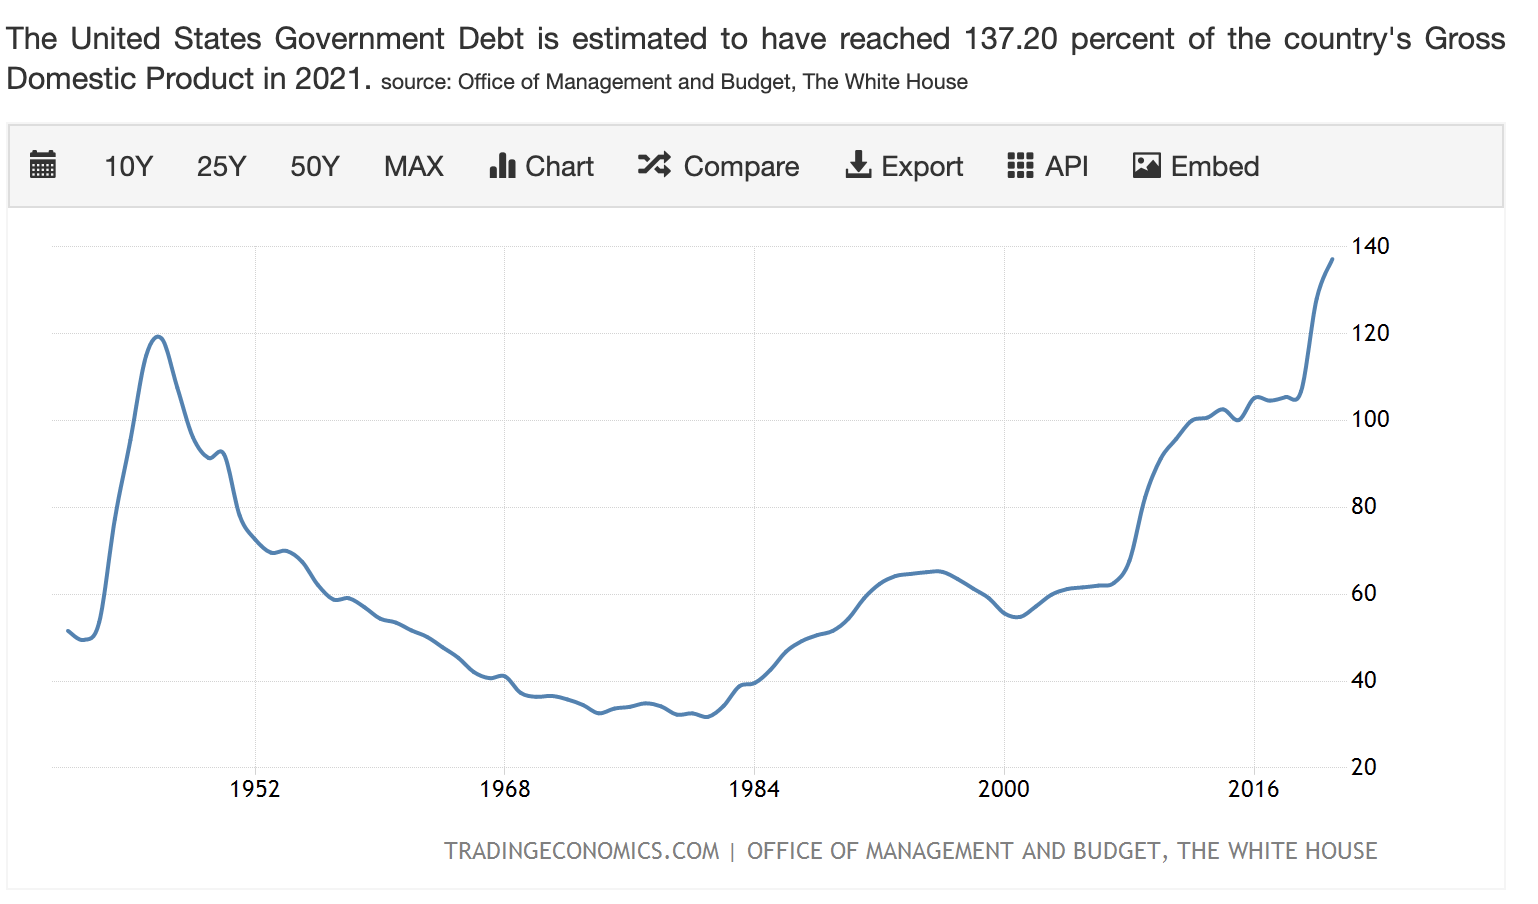
Is The Party Over? (Trading Economics)
About 20% of Americans die before age 65, roughly double the rate of our high-income peers. Health insurance is a pervasive issue for middle class families. And while there are regional variations, Americans are anywhere from 5x to 20x more likely to die of drug overdoses than other high-income countries (Canada is the only country that comes close), 5-10x more likely to be a victim of homicide or violent crime, and are under significantly more stress and in poorer health than our high-income peers, both qualitatively and quantitatively. Despite this, we have the highest prison population in the world per capita and spend the most on healthcare by a large margin. It’s not totally clear why these are happening, but a lot of the divergence has happened over the past 20 years.
It’s not that the United States is a terrible place – it’s probably the best place in the world to make a few million dollars, and we have abundant sunshine in all but our most northern parts. But there are very problematic demographic trends ranging from aging, obesity, poor health, and drug overdoses that threaten the ability of the US to grow our economy. Friends I have in the healthcare sector are burnt out and quitting since COVID – they’re understaffed and caught in between the flood of people with tons of self-inflicted health issues and the hospital politics on the other that put profits first and patients second.
This could be another article, but the main economic issues in my mind are toxic amounts of rent-seeking behavior and a failure to control negative externalities.
There are so many examples. Big ag and factory farms might make chicken a little cheaper, but they cause salmonella outbreaks, create giant reservoirs for flu viruses, and offer a less healthy product to consumers. Big media makes big money off of dividing the public and sowing dissent. Big tech increasingly seeks “rent” rather than win-win solutions that increase productivity, and if whistleblowers are to be believed, is perfectly comfortable fanning the flames of depression, anxiety, and extremism among the population. Big education took in trillions from the government, and now we have a student loan crisis as too many students went to college and weren’t taught the skills they need to succeed in the global economy. Big pharma offers its own “solutions” with pervasive overprescriptions of antidepressants, amphetamines, and opiates. Then there’s Wall Street!
I’ll be blunt. None of this is sustainable. The low amount of taxes that federal and state governments are currently collecting is not sustainable given the demographic trends we’re facing and the social problems that need to eventually be tackled. Taxes and interest rates are not likely to go down over the next 10 years and may have to go up substantially in the case of taxes. If you try to collect all of this money from the rich, you distort the economy and hurt growth, and besides, there aren’t enough rich people to go around to fund it.
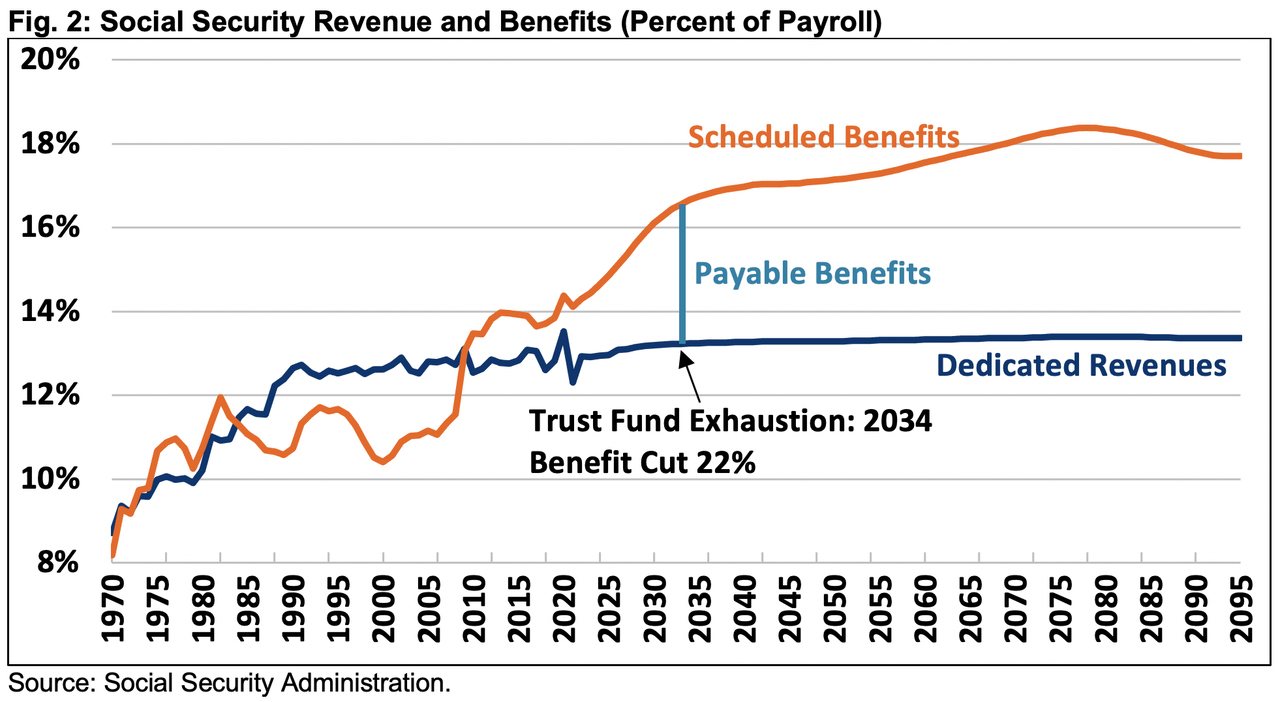
Instead, what will need to happen is that taxes will need to go up substantially for everyone in the top 50%-60% of income earners in the US, and more as a percentage of their income for middle-income and upper-middle-income earners than for the super rich. The most likely way this gets done is with a large national sales ta x– or VAT – something you’re likely to be hearing a lot about in the next couple of elections. The government is simply not going to be able to fund their spending otherwise, especially on key programs like Social Security. This means that corporate profits are not going to be helped in the future by huge rounds of deficit spending and tax cuts. The fiscal situation is going to turn from a tailwind to a headwind for corporate profits.
It’s not impossible to fight through these kinds of demographic headwinds–countries like Italy and Spain made bad policy decisions for decades and have only recently begun to start to dig their way out from overspending. Over the past 10 years, they’ve begun cutting spending to run primary surpluses in good years, broadening the tax base, and reforming their tax systems to get rid of toxic economic disincentives like inheritance taxes and wealth taxes (region by region in many cases). It takes a great deal of courage for politicians to run surpluses rather than try to buy votes in the short run. They easily could have blamed the rich and tried to score political points by jacking taxes up to 90% rather than collectively deal with the debt in a way that doesn’t completely discourage entrepreneurship, but they chose not to.
We’re not in the fiscal position of countries like Australia, Norway, and Switzerland that have minimal debt, but we can take the example of countries like Italy and Spain that have shown willingness to balance their budgets. While the US won’t default on its debt due to our ability to raise taxes or print money, printing money to get out of debt will have the same overall effect on the standard of living of the average person that raising taxes will. The only example that the modern monetary theorists use for a country that has gotten away with this level of debt is Japan, but Japan isn’t as indebted as it looks (their central bank owns tons of stocks and they lend a lot of money from one government agency to the other), and actually has had a lot of issues with debt.
The next few years will really be our last chance to deal with the changing demographics and public debt load to get back on a sustainable track without it being incredibly burdensome on American taxpayers and workers. For these reasons, corporate profit growth is likely to face some serious headwinds. However, there’s hope. As painful as adjusting to our new reality may be, the next recession will pave the way for the bull market that will come after.
The Good News: Technological Advances
Having probably scared the hell out of you, I’m now going to offer you some hope. For one, the 2010s saw a higher GDP growth rate than the 2000s did in the US. You could easily explain this away because the recessions happened before and after it, but I think there’s more to it.
More than we give it credit for, the 2010s and early 2020s saw some really fascinating advances in tech. For every bad example of how big tech has created chaos, there’s an example of how startups have gone on to disrupt industries and pave the way to growth. Uber (UBER) disintermediated the taxi industry, increasing the supply of rides available to consumers while effectively crushing a large, profitable, and rent-seeking industry.
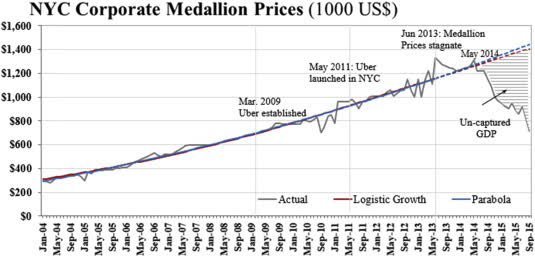
Uber’s Coup (Technology in Society)
Airbnb (ABNB) allowed millions of homeowners across the world to rent out their houses short term or intermediate term, drawing both praise and controversy. Amazon (AMZN) is highly controversial as well for its labor issues, but it’s brought consumers unprecedented levels of choice in buying goods, in the US and abroad. Zoom (ZM) and other telework providers have challenged the traditional office model, where companies pay millions to rent large offices in places like Manhattan and San Francisco, while millions of workers slog into the cities on subways and commuter trains. The pandemic taught us that school and church don’t work well with Zoom, but as an alternative to business travel and paying $5 a gallon to commute to the office for face time, we’re making progress by pushing the envelope on remote work.
One study found that in only five months of telework, US workers saved $90 billion in commuting costs. These numbers are now quite conservative given gasoline prices roaring higher in the time since.
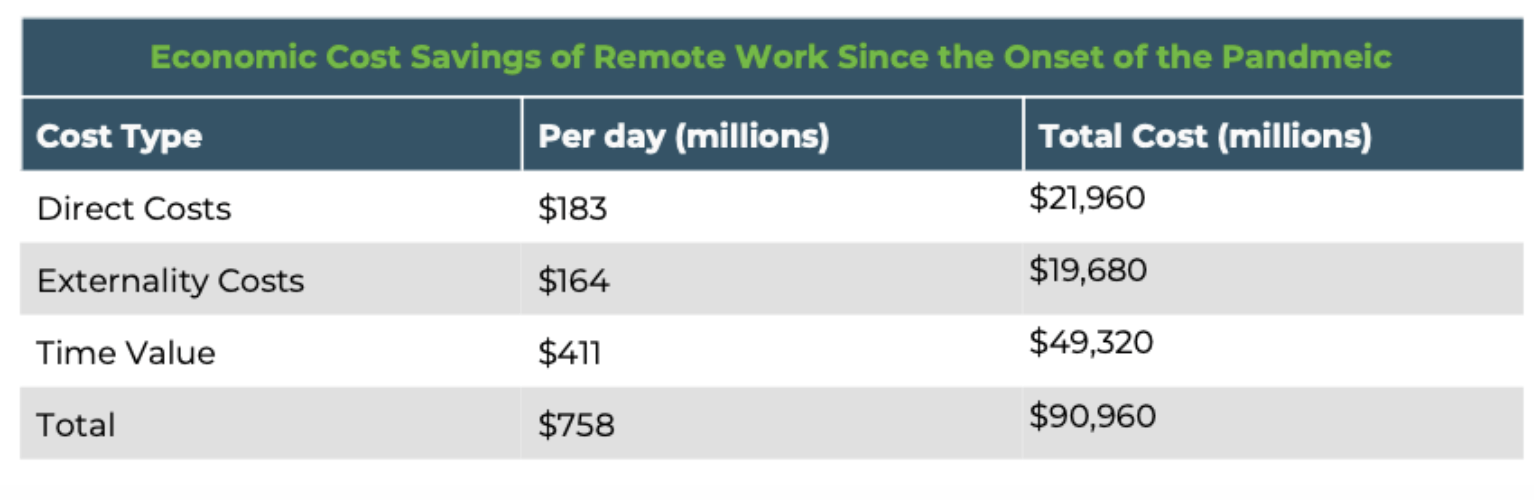
Cost Savings From Remote Work (NJBIA)
I don’t think we’ve fully realized the potential of the Internet to increase productivity. From doing routine doctor visits via telehealth, to conducting work in a more decentralized and effective way, to allowing workers to live close to family, the potential of the internet is clearly not fully harnessed yet.
Before the Internet, if you wanted to hire for a position and you were in, say, Long Island, you basically were limited to your local labor pool. Even 10 years ago, you might have found a match for your role, but they might live in New Jersey and have a mortgage, and their spouse would need to find new work, so they can’t take your job. But with the Internet, employers and employees can increasingly get better matches, and many employees have the option to live in lower-cost-of-living areas, which can benefit both parties. Artificial intelligence has great potential as well, although I tend to focus more on concrete trends.
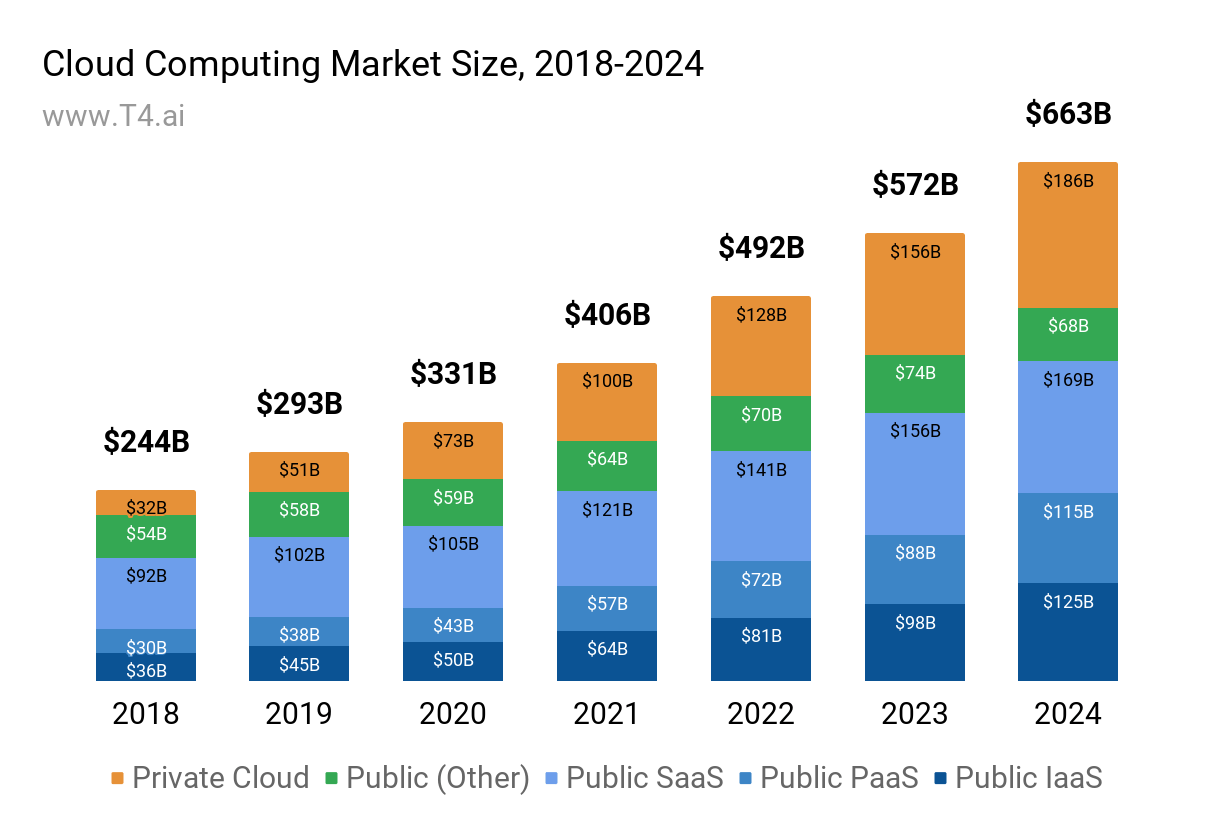
Cloud Computing Growth (T4)
Now we find ourselves in the midst of an energy crisis. But what if we could improve cars so that they’re less expensive to operate and improve the battery range of EVs to better than current gasoline cars? What if we could get our electricity from the sun and store it with improved battery technology and only use natural gas for heating? Solar (photosynthesis) is how nature prefers to get its energy, so we might be onto something.
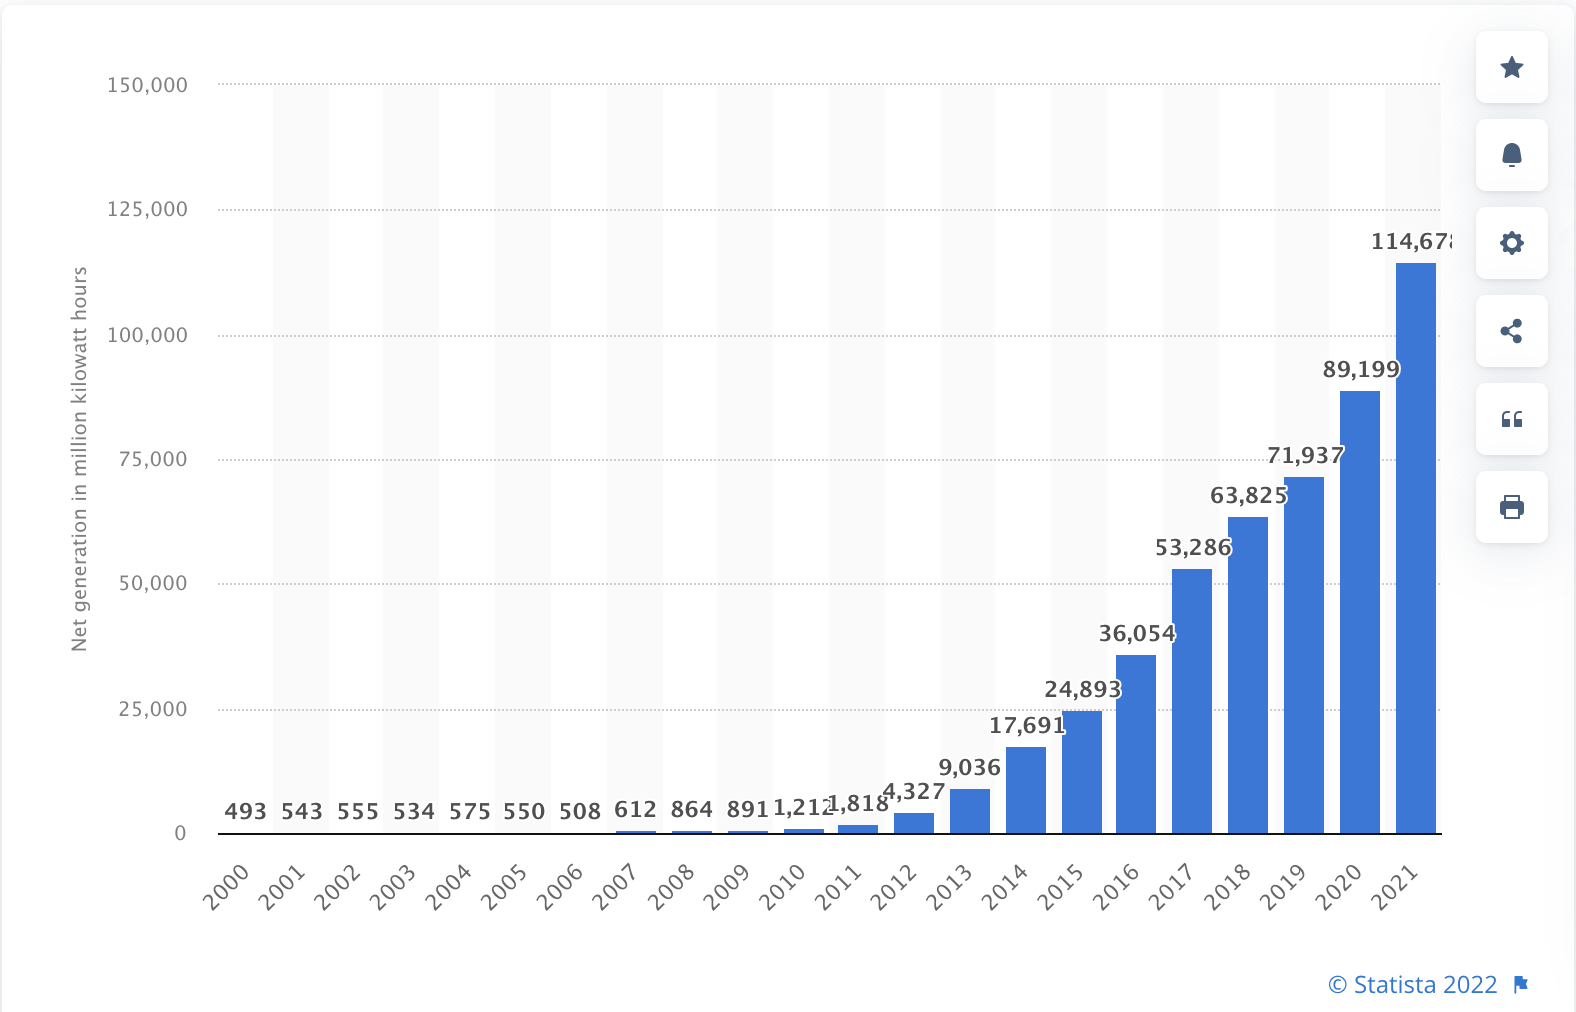
Solar Production (US) (Statista)
We wouldn’t have to worry as much about Iraq or Ukraine or OPEC, because the world’s dictators would lose their principal source of income, which is oil. I’ve probably given Russia and China too much of the benefit of the doubt over the last few years, but this allows for the world to be less interconnected in ways that cause conflict. The oil we do pump in the US we could export, boosting GDP growth even more.
So slow growth isn’t a death sentence, although the demographic trends are an undeniable challenge. The US economy only grew real GDP by 1% annually during the Great Depression, but after that came an epic economic boom. This said – I wouldn’t underestimate how much technological advancement will need to happen for us to overcome the demographic hurdles that are currently in place. Political solutions could also help unlock growth in the US – fixing our healthcare and education systems could unlock a lot of money for taxpayers and consumers who have had enough of paying through the nose for subpar results.
S&P 500 2032 Forecast
To hang a number on the S&P 500 in 10 years, we really need to make two predictions.
The first is whether the current level of earnings and multiple is sustainable or is at a cyclical high. I argue that it’s not sustainable. I expect earnings to come in roughly 15% lower than analyst estimates over the next couple of years.
Let’s say S&P 500 earnings come in at $190 for 2022. This would be consistent with a mild recession, or slow growth while we work through the hangover of too much stimulus. If this earnings number is right, this probably takes the downtrend in the S&P 500 to 3300-3400, assuming roughly 17.5x earnings. If either the earnings picture is worse than expected or inflation cannot be effectively controlled then markets could see a bottom lower than this.
From the bottom in earnings, I think profits will grind out steady growth to $300 per share in 10 years, which is good for a 4.7% CAGR from the post-boom level I expect profits to adjust to. This is reflective of both the demographic and fiscal challenges we have and the power of technology to continue to deliver gains despite stiff headwinds. Without these big trends in technology helping us, I think this would be closer to 3%.
Assuming a 17.5x multiple on this, you get a target for the S&P 500 of 5,250. This is admittedly only a 2.5% price return from current prices, but you would pocket a substantial amount of dividends along the way that you could spend or reinvest, averaging around 2% per year over the period (starting lower but growing quickly over time if prices come down and earnings come up over a bear market cycle). A 20x multiple would be a bit sunnier, implying a price of 6,000. This wouldn’t be a “lost decade,” but rather a reflection that the massive bull market in stocks since 2019 has likely overshot the economy’s ability to deliver, pricing in most of the productivity gains likely to occur over the next decade. I think you only really can count on dividends in the short run until stocks correct to more reasonable values.
Note that these assumptions are very sensitive to our inputs. Bear markets are very harsh on the CAGR calculations in the short run, and 10 years is close enough to the short run that if you overpay you might not come out too far ahead.
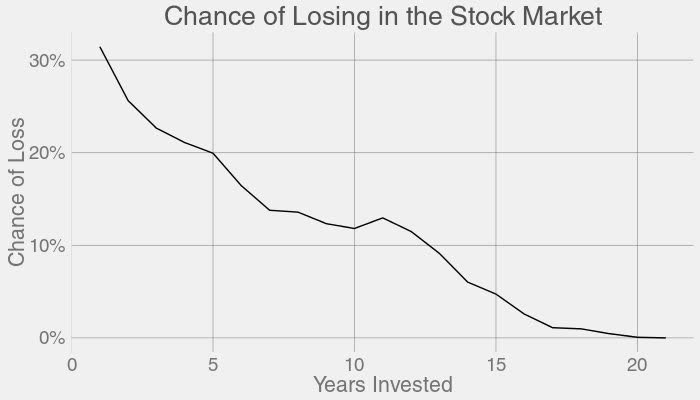
Odds of Losing Money in Stocks (Github)
But over a 20-year period, you almost always get closer to the long-run return of 9% or so. If you’re able to buy stocks into a steep bear market when valuations are low, you’ll almost certainly do well, regardless of timing. My prediction might prove too low if inflation stays high, but bigger nominal gains coupled with weaker purchasing power would likely put investors in the same spot as a grinding, sideways market compared to their cost of living over the next decade, with the added drag of paying capital gains tax on “gains” that are just really keeping pace with inflation.
Key Takeaways
- I believe the stock market is pricing an unsustainable amount of future profit growth in the short run due to unprecedented levels of stimulus/deficit spending in 2021.
- Fortunately (or unfortunately if you’re considering retiring and living off principal), I believe this will resolve over the next 6-12 months, with stocks falling another ~20%.
- GDP growth has slowed over time in the United States, while corporate profit growth has held up better. This is a bit of a mystery, but I believe temporary tax cuts and lower interest rates are the principal reasons why.
- Due to changing demographic profiles, accumulated government debt, and the need to tackle serious social problems in the US, taxes are likely to rise, putting pressure on the ability of corporate profits to continue growing.
- Technological improvements offer the potential for win-win solutions and continued growth that will make this process significantly less painful and offer the potential for markets to rise despite fiscal headwinds.
- The risk/reward for stocks currently looks poor, but should markedly improve if stocks fall to more reasonable valuations or if earnings grow faster than I expect.
- In all, stocks should offer positive annual returns over the next 10 years, but well below historical averages. 20-year returns should be better.
- Returns should be better for small (IJR) and mid-cap (IJH) stocks, international stocks (VEA) with lower valuations, and quality companies at home and abroad, especially those with shareholder-friendly dividend policies. And opportunities for Alpha are likely to exist in any market.
Be the first to comment