

MicroStockHub/iStock via Getty Images
After briefly reaching highs above $2000, Gold has fallen to $1785 (-14%) following the deep selling in the US major indexes throughout most of April & May 2022.
Interpretation Of The Current Consolidation In Gold
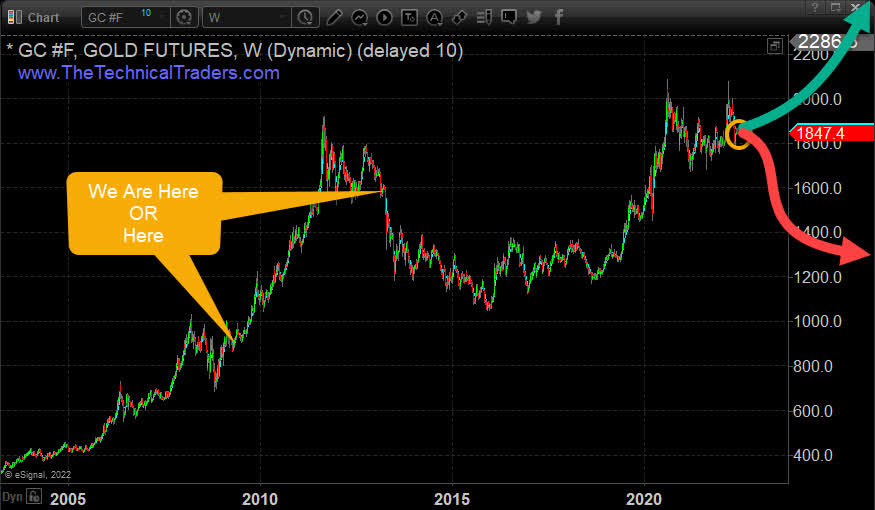
My team and I see the recent lows in Gold as similar to the April/May 2009 consolidation after the Global Financial Crisis. Also similar to the January 2013 consolidation before an extended -34% price decline took place – ending in December 2015.
The primary difference between now and then is that the US Federal Reserve is currently initiating a new round of Quantitative Tightening (QT), raising rates, while battling Inflation. In both the previous examples, the US Federal Reserve was moving aggressively into Quantitative Easing, attempting to aid in the recovery of the US & the global economy.
It seems to me, that the underlying factors driving the price of Gold have drastically changed. All it would take for Gold to break into a new trend, up or down, would be to see some new catalyst or contagion event come to life.
Gold Weekly Chart
Gold Establishes A New Momentum Base While USD Rallied +15.75%
The strength of Gold over the past 15+ months while combating the strength of the US Dollar has been impressive. I’ve shared my thoughts in many interviews over the past year suggesting Gold was in a consolidation range (moving downward) while still holding up impressively as the US Dollar continued to skyrocket higher.
Trends in the US Dollar and Gold, I believe, are directly related to underlying global economic factors. These factors are prompting a shift away from traditional Growth sectors and pushing traders to reconsider the safety of precious metals. Another factor is that the US Federal Reserve has been actively telegraphing rate increases for nearly 12+ months as Inflation started to surge in early 2021.
I see the extended consolidation in Gold over the past 15+ months, above $1700, as a new momentum base for the price – similar to what happened in 2009 and 2013. The next question is “will it break upward or downward?”.
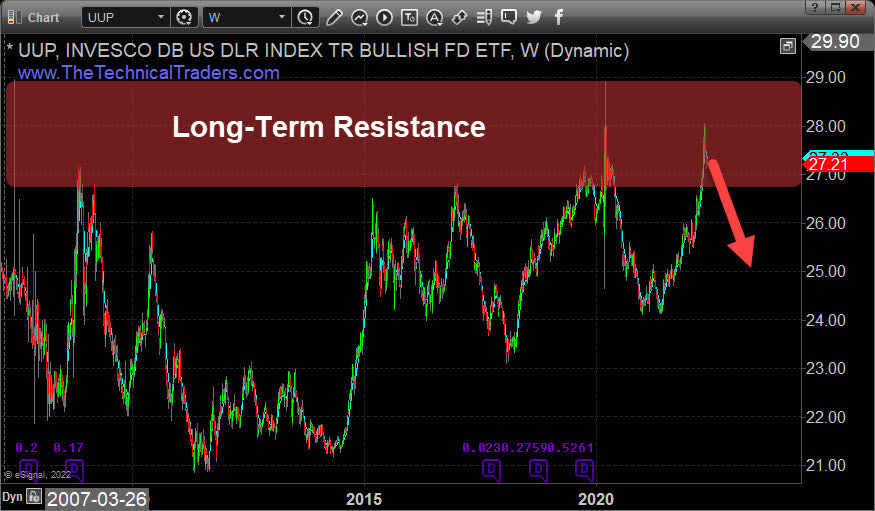
As time progresses, we’ll have to see how the US Dollar and Gold react to the Long-Term Resistance area I’ve highlighted on the chart above.
Plan A vs. Plan B For Gold Throughout 2022
I like to consider trading to take high-probability opportunities within confirmed/defined trends. The smartest move for Gold traders right now is to wait for any future price confirmation before trying to guess which direction Gold will move.
| Plan A | Plan B |
| Watch the $1775 level as critical support | Watch the $1735 level as critical support |
| Consider the current bullish price trend as Neutralif any daily close breaks below $1775 | Consider the current bullish trend as continuedBearish if any daily close breaks below $1680 |
| If the price recovers above $1775 after moving lower,adjust to a potential bullish price trend for gold. | If the price breaks to below $1735, do not attemptto ‘bottom-pick’. |
These Plan A and Plan B constructs are how I think of trading in general. It is not worth trying to guess where the price may go or if I’m missing out on some opportunity. Risking 5% or 10% of my capital on a guess is just not worth it to me. I could be wrong in my guess multiple times trying to chase an emotional belief that a bottom or top is setting up. This, in turn, could destroy 25% to 40% of my trading capital in the process.
If I’m patient and wait for the market price to confirm a trend, then I’ll be able to execute a high-probability trade with limited risk.
Falling Back To Long-Term Technical Analysis As A Guide
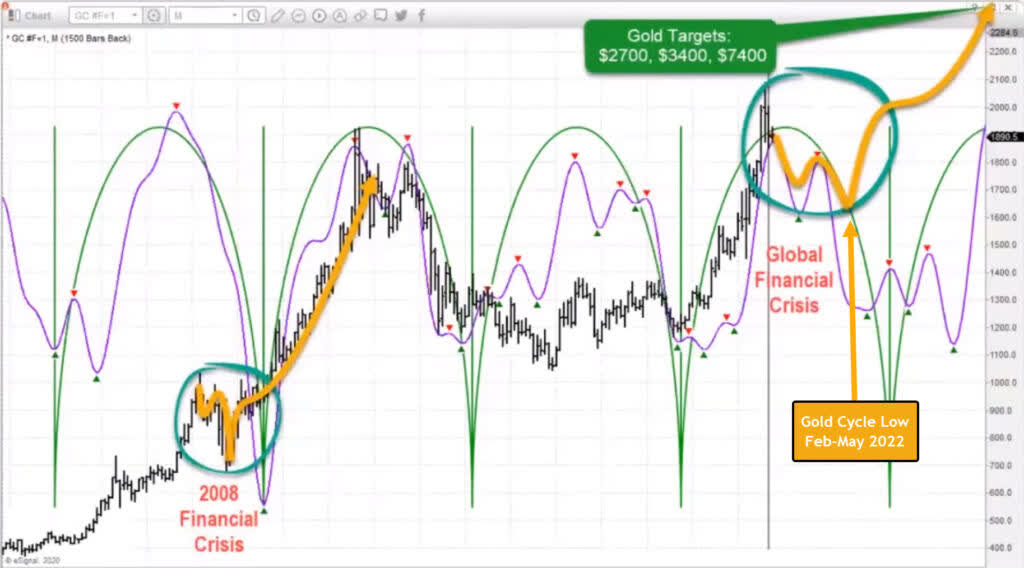
I created this chart in early 2021 highlighting my cycle expectations for Gold over the next 3+ years. Throughout most of 2021 and into early 2022, I expected Gold to trend downward – reaching a low price near $1625 sometime near February-May 2022. The recent low in Gold on May 16, 2022, was $1785. Prior to that, Gold reached a low of $1676.70 on March 8, 2021.
Although my $1625 level has not been reached yet, I am eagerly waiting for the next phase of my prediction – the potential rally wave that should start in June 2022 or soon after. This next rally phase may target $2000~2050, then stall for many months before continuing to trend higher, targeting $2400+.
Patience is the key to all trading and long-term success. Knowing there are opportunities for very short-term trades every day is fantastic if that is your style. I prefer to trade longer-term swing trades, protecting my capital and trading the most efficient setups.
In my opinion, the best opportunity for Gold traders is to wait for price confirmation of my predicted cycles. Once this happens, then look for opportunities when we know Gold has exited this consolidation phase.
Over the next 12 to 24+ months, we expect very large price swings in the US stock market and other asset classes across the globe. We believe the markets have begun to transition away from the continued central bank support rally phase and have started a revaluation phase as global traders attempt to identify the next big trends. Precious Metals will likely start to act as a proper hedge as caution and concern begin to drive traders/investors into Metals and other safe havens.
Historically, bonds have served as one of these safe havens. This is not proving to be the case this time around. So if bonds are off the table, what bond alternatives are there? How can they be deployed in a bond replacement strategy?
Editor’s Note: The summary bullets for this article were chosen by Seeking Alpha editors.
Be the first to comment