

Justin Sullivan
NVIDIA Corporation (NASDAQ:NVDA) (“Nvidia”) is a large manufacturer of graphical processing unit boards for computer hardware that can help speed it up. This company has been innovative, but competition is catching up. It has robust fundamental guidance estimates, but technical analysis shows temporary weakness in stock price.
Fundamentally very strong long-term
Ratios
The current ratio and quick ratio showed increases between 2018 to 2020, but 2021 and 2022 show a more robust recovery after the pandemic.
|
Unnamed: 0 |
2018 |
2019 |
2020 |
2021 |
2022 |
|
Period |
FY |
FY |
FY |
FY |
FY |
|
Current ratio |
8.027 |
7.944 |
7.674 |
4.090 |
6.650 |
|
Quick ratio |
7.262 |
6.656 |
7.037 |
3.564 |
5.965 |
|
Cash ratio |
3.471 |
0.588 |
6.108 |
0.216 |
0.459 |
Source: Financial Modelling Prep.
Growth
As 2020 was the weakest year, 2021 to 2022 showed a more substantial recovery for all metrics, with this year so far being the strongest. Most importantly, net income has grown at its strongest this year, showing stronger upward momentum.
|
Unnamed: 0 |
2018 |
2019 |
2020 |
2021 |
2022 |
|
Period |
FY |
FY |
FY |
FY |
FY |
|
Revenue growth |
0.406 |
0.206 |
-0.068 |
0.527 |
0.614 |
|
Gross profit growth |
0.433 |
0.232 |
-0.056 |
0.536 |
0.681 |
|
Ebitgrowth |
0.660 |
0.185 |
-0.252 |
0.592 |
1.216 |
|
Operating income growth |
0.660 |
0.185 |
-0.252 |
0.592 |
1.216 |
|
Net income growth |
0.829 |
0.359 |
-0.325 |
0.549 |
1.251 |
Source: Financial Modelling Prep.
Data
The simple moving average of 200-days showed deep losses, while the most recent 20 days showed a strong uptrend.
|
Unnamed: 0 |
Values |
|
SMA20 |
8.69% |
|
SMA50 |
-0.00% |
|
SMA200 |
-28.20% |
Source: FinViz.
Enterprise
From 2018 until this year, Nvidia has hit its stride, as graphical processing units have become very popular, driven by the crypto mining craze and higher-end gaming boards. But, as both have weakened this year, will the momentum continue into the next few years?
|
Unnamed: 0 |
2018 |
2019 |
2020 |
2021 |
2022 |
|
Symbol |
NVDA |
NVDA |
NVDA |
NVDA |
NVDA |
|
Stock price |
61.515 |
39.275 |
65.512 |
134.062 |
234.770 |
|
Number of shares |
2.396 B |
2.432 B |
2.436 B |
2.468 B |
2.496 B |
|
Market capitalization |
147.390 B |
95.517 B |
159.588 B |
330.866 B |
585.986 B |
Source: Financial Modelling Prep.
Estimate
Forward-looking estimates are the most critical way to gauge the future status of a company. The next six years are pretty impressive based on similar companies in this space. Comparatively, most companies will only showcase estimates up to 2026. Nvidia has enormous confidence in its forward guidance, where revenue is expected to double with net profit relatively flat. The same could be said for EBITDA as well.
|
YEARLY ESTIMATES |
2022 |
2023 |
2024 |
2025 |
2026 |
2027 |
|
Revenue |
26,662 |
26,985 |
30,487 |
36,400 |
41,126 |
53,664 |
|
EPS |
4.33 |
3.36 |
4.38 |
5.45 |
6.14 |
8.46 |
|
P/E Ratio |
31.75 |
40.91 |
31.38 |
25.22 |
22.35 |
16.23 |
|
EBITDA |
13,668 |
10,619 |
13,569 |
15,976 |
10,929 |
– |
|
Net Profit |
9,240 |
5,187 |
9,185 |
11,350 |
8,291 |
9,355 |
Source: BusinessInsider
Technical Analysis is mixed with short-term stock challenges
Fibonacci
One area of concern for Nvidia is the steep decline in stock price since the peak in September 2021. The price has not recovered this year, but there has been impressive short-term performance. Therefore, Nvidia stock could continue a short-term sell rating.
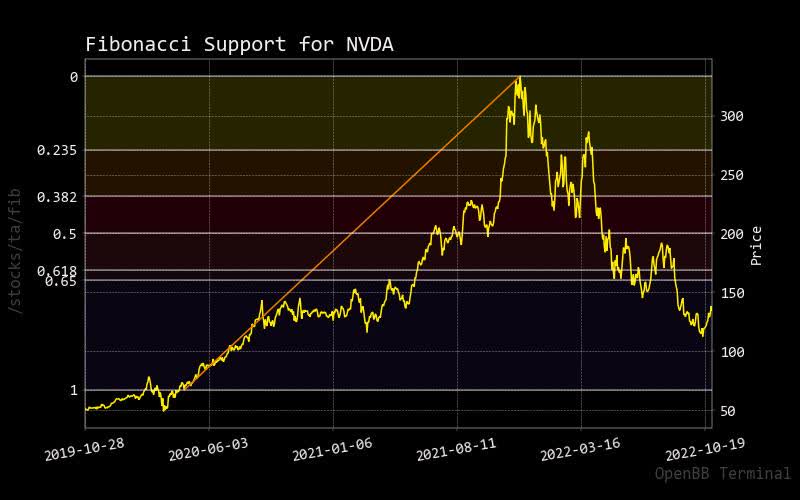
fibonacci nvda (custom platform)
Bollinger Bonds
As one can see, Nvidia’s stock price has broken through the upper band of Bollinger. Consider this a sign of market entry, but the concern is whether this is a short-term rally. If so, the other consideration is how long it will last.
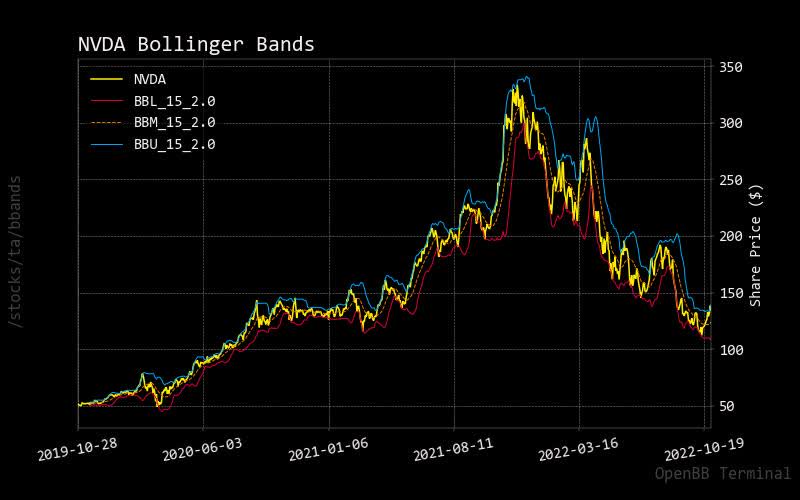
bollinger nvda (custom platform)
MACD
As one can see in this compressed MACD stock price line, the decline could be worse. More importantly, one needs to focus on whether the stock price is now crossing the zero line. Should one enter the market based on this signal? Let’s hold off until other analysis indicators confirm the short-term rally. The stock price is correlated to the overall performance of American major stock indices.
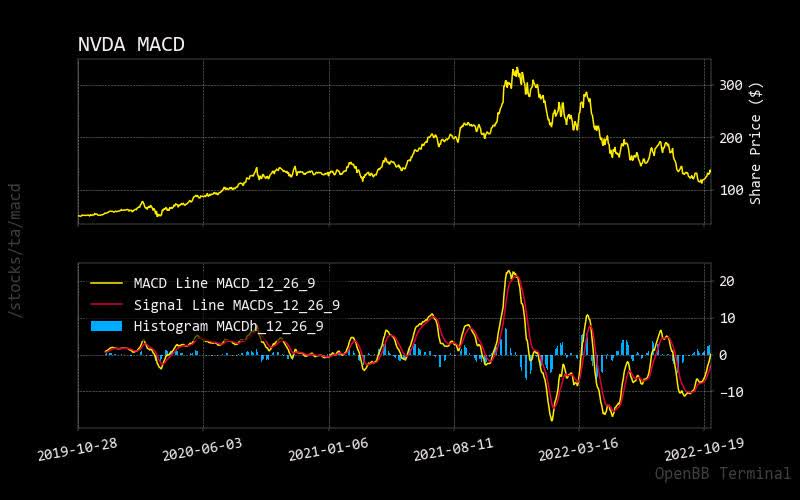
macd nvidia (custom plaftform)
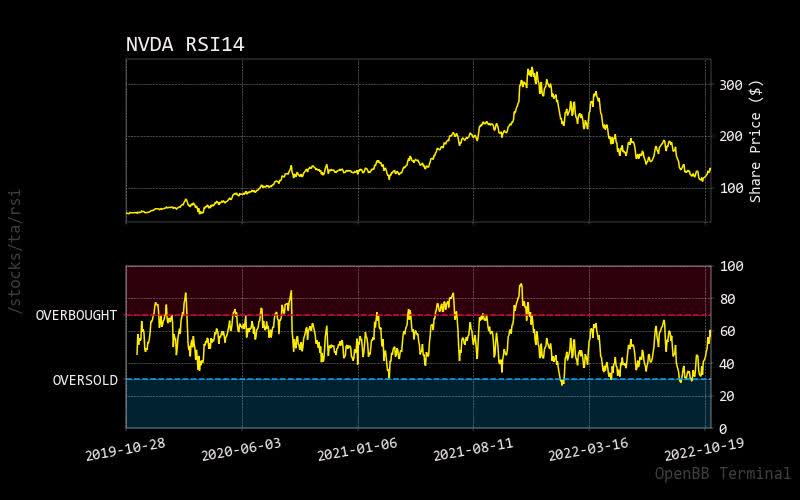
RSI
A more tangible way to confirm if a price is worthy of market entry is to look at the magical midpoint between overbought and undersold market conditions. Based on the current stock price, we may have already missed a short-term rally that would have given you close to 10% over the last 20 days.
rsi nvidia (custom platform)
Prediction via AI
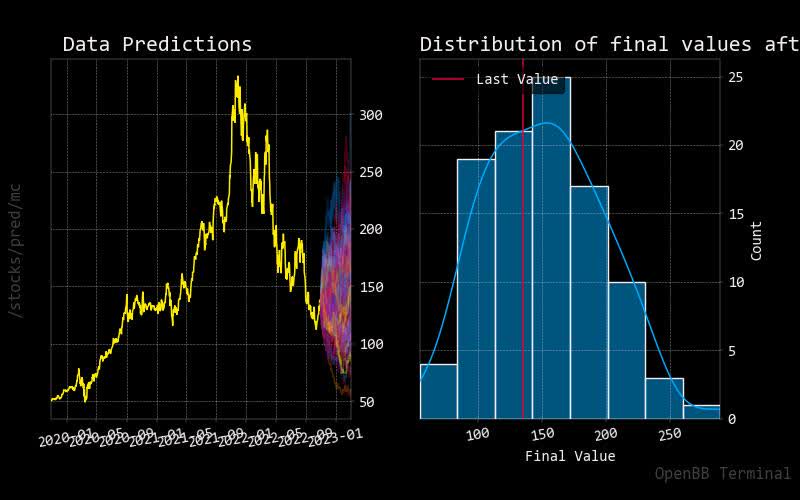
Monte Carlo
This Monte Carlo simulation showcases a higher probability of uptrend with more predicted paths versus fewer forecasted paths. Also, the normalized distribution chart shows a higher concentration for the expected stock price increase.
monte carlo nvda (custom platform)
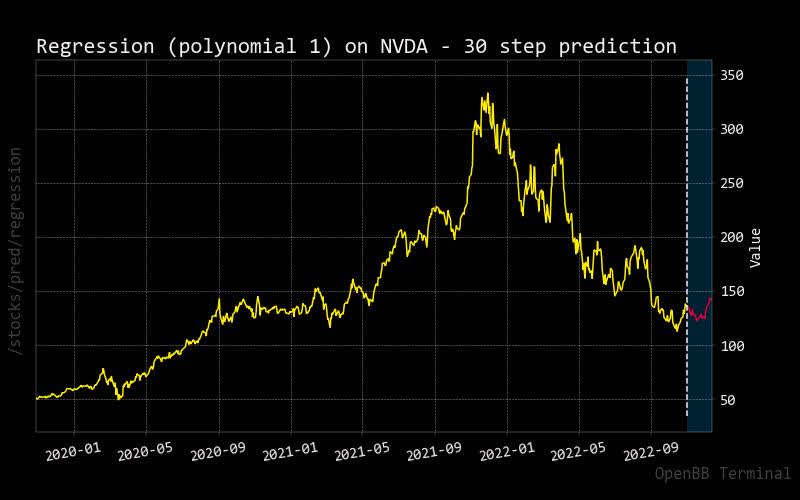
Regression
The predicted red regression line over the next 30 days indicates that Nvidia stock price may not go up. This could be a concern for those market analysts who placed an overwhelming sell call on the stock.
regression nvda (custom platform)
Risk points down temporarily
Sustainability
For a company involved with cryptocurrency mining, one needs to see a sustainable performance rating because of the growing green movement. If competitors get such a rating, do not be surprised they will overtake Nvidia in this space. Unfortunately, most investments are driven by BlackRock and Vanguard’s two largest asset managers to stay relevant as a company.
|
Unnamed: 0 |
Value |
|
Social score |
5.16 |
|
Peer count |
28 |
|
Governance score |
6.03 |
|
Total esg |
13.45 |
|
ESG performance |
UNDER_PERF |
|
Percentile |
7.14 |
|
Peer group |
Semiconductors |
|
Environment score |
2.26 |
Source: Yahoo Finance
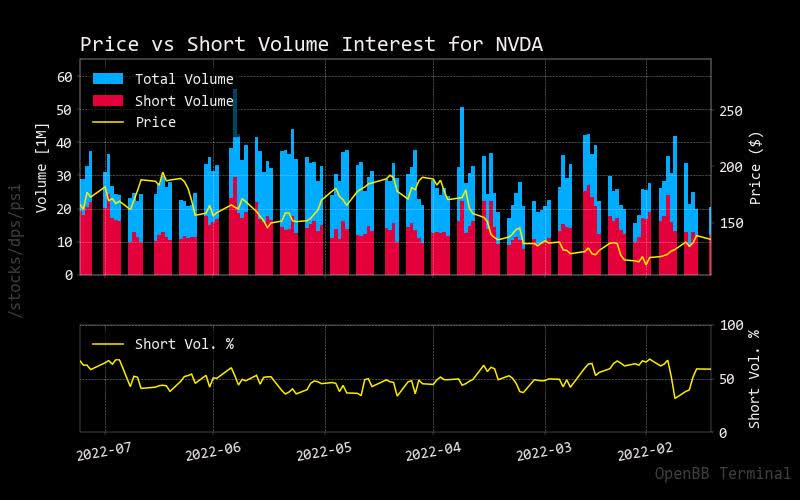
Price vs. Short Volume
Another way to confirm a stock price uptrend is to use short price volume against total volume. As you can see, there is a slight uptick of over 50%, which hints that more shorts are placed on this stock, with an expected decline for Nvidia.
shorting nvda (custom platform)
Source: StockGrid
Insider Stats
Another stat to confirm the theory of an expected stock price decline is to look at executives’ insider trading over the last few months. As you can see, as Nvidia stock price steeply declined during the summer, more stock was sold off by various executives as recently as last month.
|
Unnamed: 0 |
X |
Filing Date |
Trading Date |
Ticker |
Insider |
Title |
Trade Type |
Price |
Quantity |
Owned |
Delta Own |
Value |
|
0 |
nan |
2022-10-17 17:51:03 |
2022-10-13 |
NVDA |
Stevens Mark A |
Dir |
S – Sale |
$119.65 |
-87,500 |
5,582,091 |
-2% |
-$10,469,235 |
|
1 |
nan |
2022-10-13 19:10:48 |
2022-10-11 |
NVDA |
Stevens Mark A |
Dir |
S – Sale |
$116.49 |
-85,000 |
5,669,591 |
-1% |
-$9,902,020 |
|
2 |
nan |
2022-09-06 18:39:11 |
2022-09-01 |
NVDA |
Dabiri John |
Dir |
S – Sale |
$142.06 |
-945 |
3,205 |
-23% |
-$134,247 |
|
3 |
M |
2022-06-15 18:57:21 |
2022-06-13 |
NVDA |
Stevens Mark A |
Dir |
S – Sale |
$158.07 |
-227,650 |
5,754,591 |
-4% |
-$35,983,438 |
|
4 |
nan |
2022-06-09 16:46:48 |
2022-06-08 |
NVDA |
Shoquist Debora |
EVP, Operations |
S – Sale |
$188.23 |
-23,644 |
413,298 |
-5% |
-$4,450,583 |
|
5 |
nan |
2022-06-01 16:30:00 |
2022-05-27 |
NVDA |
Dabiri John |
Dir |
S – Sale |
$185.59 |
-2,200 |
2,712 |
-45% |
-$408,298 |
|
6 |
nan |
2022-06-01 16:28:51 |
2022-05-27 |
NVDA |
Stevens Mark A |
Dir |
S – Sale |
$185.20 |
-278,000 |
5,980,803 |
-4% |
-$51,485,542 |
|
7 |
nan |
2022-03-29 19:26:42 |
2022-03-28 |
NVDA |
Coxe Tench |
Dir |
S – Sale |
$274.06 |
-100,000 |
4,285,524 |
-2% |
-$27,405,720 |
|
8 |
nan |
2022-03-21 18:16:31 |
2022-03-18 |
NVDA |
Perry Mark L |
Dir |
S – Sale |
$263.80 |
-16,716 |
171,524 |
-9% |
-$4,409,699 |
|
9 |
D |
2022-03-02 18:58:11 |
2022-03-01 |
NVDA |
Huang Jen Hsun |
Pres, CEO |
S – Sale+OE |
$237.13 |
-292,340 |
84,649,537 |
0% |
-$69,321,000 |
Source: Open Insider
Insider Activity
|
Date |
Shares Traded |
Shares Held |
Price |
Type |
Option |
Insider |
Trade |
|
2022-06-07 |
4,101.00 |
193,308.00 |
188.97 |
Sell |
No |
STEVENS MARK A |
-4101.0 |
|
2022-06-07 |
3,632.00 |
186,576.00 |
190.92 |
Sell |
No |
STEVENS MARK A |
-3632.0 |
|
2022-06-07 |
100.00 |
186,476.00 |
191.63 |
Sell |
No |
STEVENS MARK A |
-100.0 |
|
2022-06-07 |
3,100.00 |
190,208.00 |
189.98 |
Sell |
No |
HUANG JEN HSUN |
-3100.0 |
|
2022-06-12 |
56,600.00 |
2,653,743.00 |
159.0 |
Sell |
No |
Teter Tim |
-56600.0 |
|
2022-06-12 |
57,250.00 |
2,596,493.00 |
157.07 |
Sell |
No |
Puri Ajay K |
-57250.0 |
|
2022-06-13 |
113,800.00 |
2,482,693.00 |
158.1 |
Sell |
No |
Kress Colette |
-113800.0 |
|
2022-06-14 |
11,893.00 |
571,067.00 |
165.27 |
Sell |
No |
Shoquist Debora |
-11893.0 |
|
2022-06-14 |
15,835.00 |
5,173,691.00 |
165.27 |
Sell |
No |
Robertson Donald F Jr |
-15835.0 |
|
2022-06-14 |
7,709.00 |
139,912.00 |
165.27 |
Sell |
No |
HUANG JEN HSUN |
-7709.0 |
|
2022-06-14 |
2,608.00 |
64,972.00 |
165.27 |
Sell |
No |
HUANG JEN HSUN |
-2608.0 |
|
2022-06-14 |
10,813.00 |
345,864.00 |
165.27 |
Sell |
No |
Dabiri John |
-10813.0 |
|
2022-06-14 |
8,996.00 |
217,826.00 |
165.27 |
Sell |
No |
Shoquist Debora |
-8996.0 |
|
2022-08-31 |
945.00 |
3,205.00 |
142.06 |
Sell |
No |
Puri Ajay K |
-945.0 |
|
2022-09-05 |
1,200,000.00 |
6,373,829.00 |
3.43 |
Buy |
No |
Robertson Donald F Jr |
1200000.0 |
|
2022-09-20 |
15,838.00 |
6,357,991.00 |
132.61 |
Sell |
No |
Teter Tim |
-15838.0 |
|
2022-09-20 |
2,934.00 |
62,042.00 |
132.61 |
Sell |
No |
HUANG JEN HSUN |
-2934.0 |
|
2022-09-20 |
9,005.00 |
208,821.00 |
132.61 |
Sell |
No |
Kress Colette |
-9005.0 |
|
2022-09-20 |
11,900.00 |
559,271.00 |
132.61 |
Sell |
No |
STEVENS MARK A |
-11900.0 |
|
2022-09-20 |
10,820.00 |
335,044.00 |
132.61 |
Sell |
No |
STEVENS MARK A |
-10820.0 |
|
2022-09-20 |
7,713.00 |
110,884.00 |
132.61 |
Sell |
No |
STEVENS MARK A |
-7713.0 |
|
2022-10-10 |
229,500.00 |
6,587,491.00 |
3.16 |
Buy |
No |
Shoquist Debora |
229500.0 |
|
2022-10-10 |
53,269.00 |
2,429,424.00 |
115.8 |
Sell |
No |
Shoquist Debora |
-53269.0 |
|
2022-10-10 |
31,731.00 |
2,397,693.00 |
117.66 |
Sell |
No |
Shoquist Debora |
-31731.0 |
|
2022-10-12 |
87,500.00 |
2,310,193.00 |
119.65 |
Sell |
No |
Shoquist Debora |
-87500.0 |
Source: BusinessInsider
Recommendation
As forward guidance indicates upward stock price strength, it is surprising to see most market analysts with a sell rating for Nvidia. This may be a concern over the short term for day traders, but they have probably done reasonably well in the last month.
|
Interval |
RECOMMENDATION |
BUY |
SELL |
NEUTRAL |
|
One month |
SELL |
3 |
14 |
9 |
|
One week |
SELL |
2 |
14 |
10 |
|
One day |
SELL |
4 |
14 |
8 |
Source: Trading View
Conclusion
Sometimes, there can be contradicting stories within these reports and analyses, so it is wise to pause potential market entries over the short term. Despite short-term stock pricing concerns, Nvidia’s stock price makes it to a point where eventual market entries may occur next year. With fundamentals showing higher momentum over the next few years, this stock could become a long-term investment, but it would be wise to keep it on a hold status for now.
Be the first to comment