

Liudmila Chernetska
This article was published on Dividend Kings on Tuesday, December 13th.
—————————————————————————————
While the market is enjoying a nice rally due to inflation coming down faster than expected, it’s important to keep things in perspective.
Bureau Of Labor Statistics 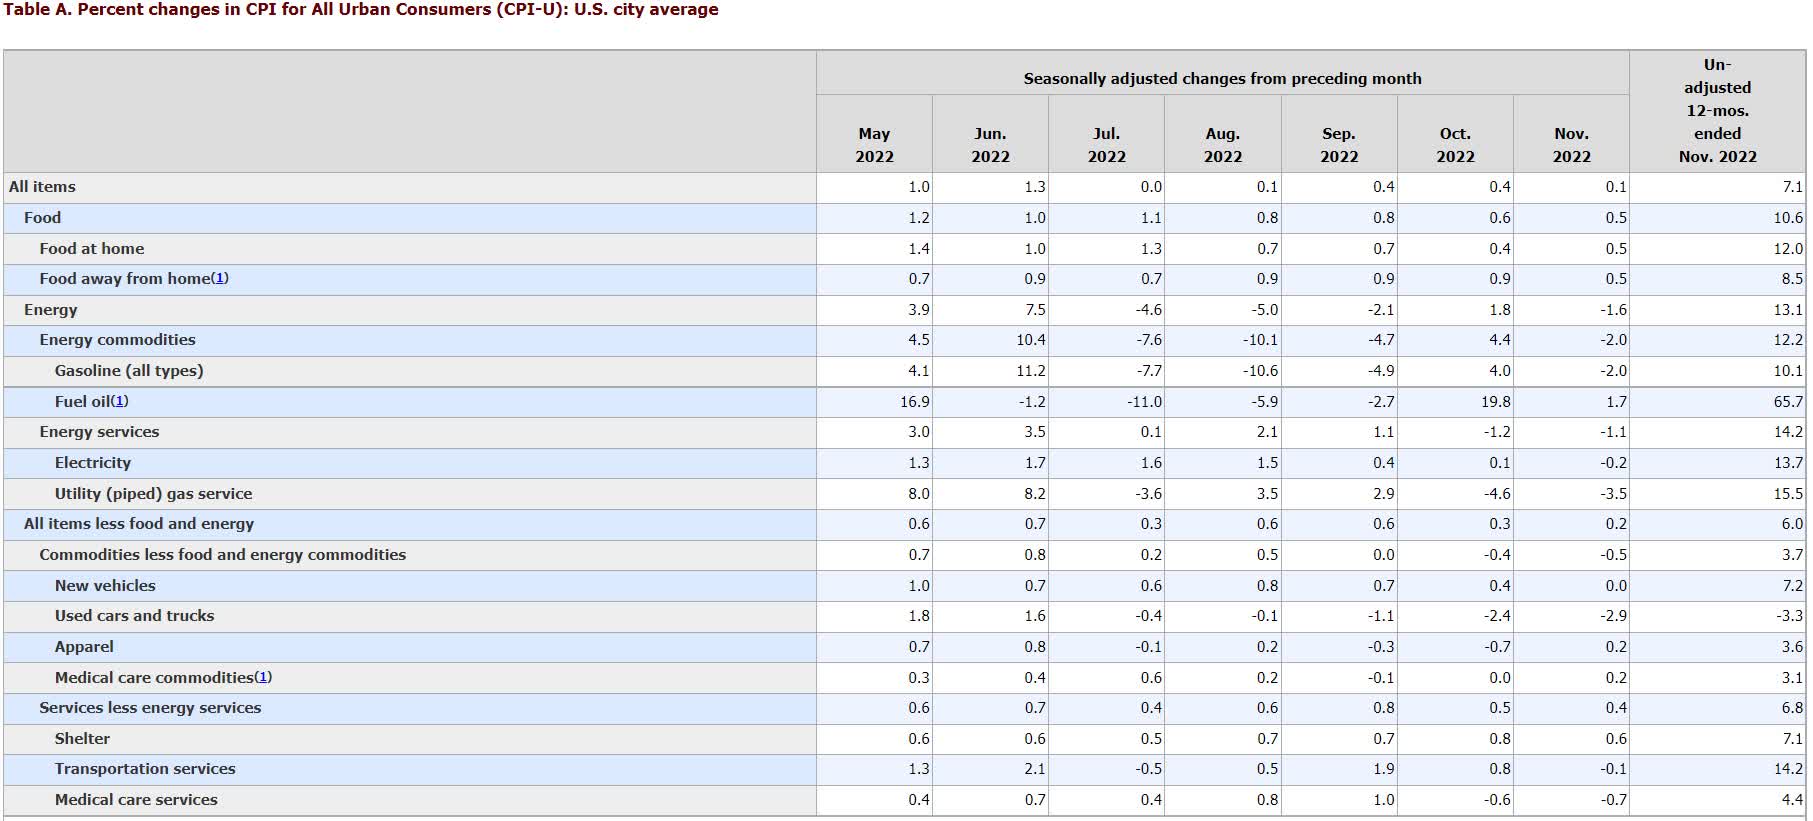
7.1% inflation is a lot lower than last month’s 7.7% but is nowhere close to allowing the Fed to stop hiking, much less start cutting rates.
CME Group
The bond market is now pricing in a terminal Fed rate of 4.75%. That’s still 1% higher than today.
And the Fed has been very clear that it doesn’t expect to cut rates until 2024, possibly not until October.
Meanwhile, the bond market is screaming recession risk.
Macrotrader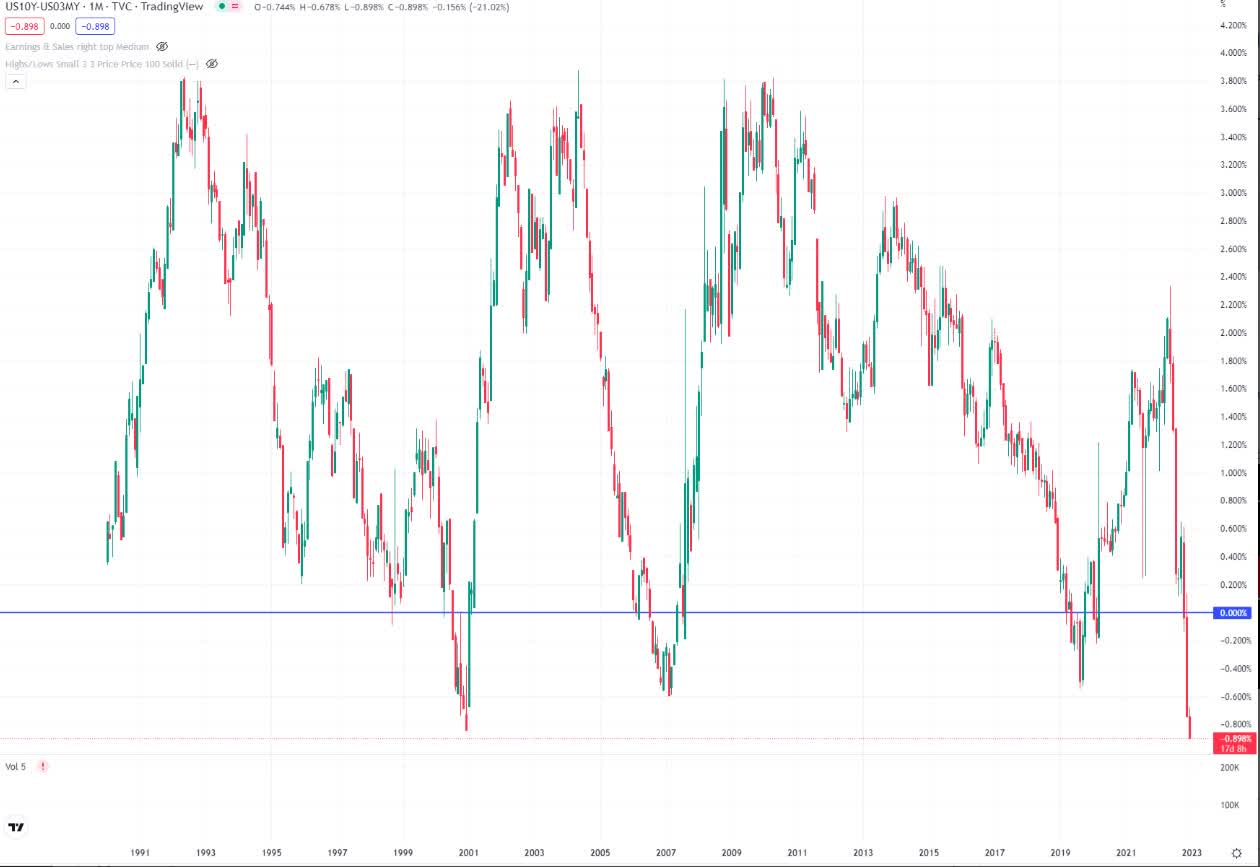
The 3m-10-yr yield curve is now the most inverted it has been in decades. According to the NY, Dallas, Chicago, and San Francisco Fed, this is the most accurate recession forecasting tool in history.
What exactly is the bond market telling us?
DK S&P Valuation Tool, NY Fed, CNBC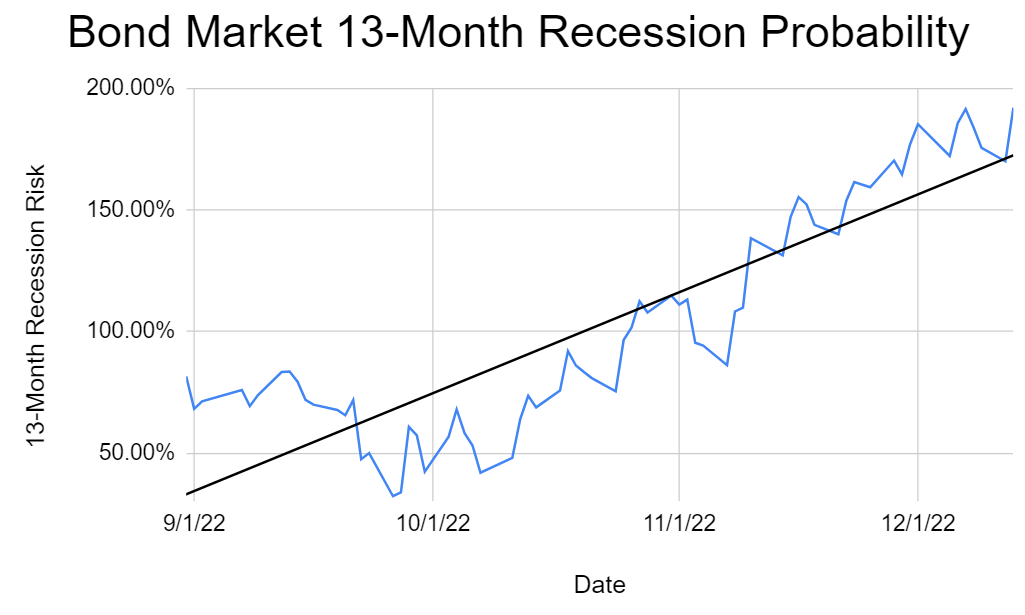
The bond market is estimating a 192% probability of a recession within 13 months. What does that mean? A 100% recession risk within 6.5 months.
And guess who agrees with the bond market?
David Rice 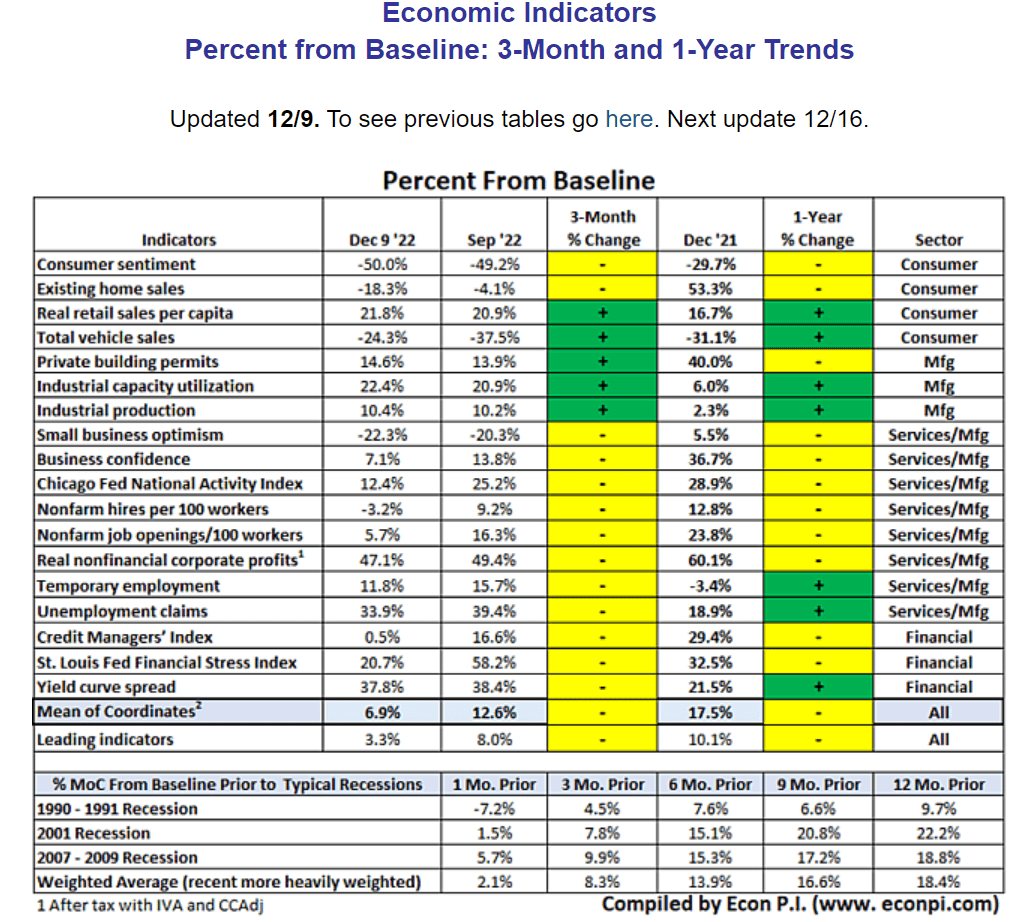
18 economic indicators, including nine leading indicators, point to a slowing economy and possible recession starting within two to four months.
- the bond market says 100% probability of a recession by June
- the economic data says a recession could begin in Q1.
What does that mean for the stock market? Nothing good in the short term.
S&P Consensus Growth Outlook
| Weekly Decline In S&P EPS Consensus | Last Week’s EPS Consensus | Year | EPS Consensus | YOY Growth |
| 0.00% | $206.27 | 2021 | $206.27 | 50.20% |
| -0.07% | $218.57 | 2022 | $218.42 | 5.89% |
| -0.06% | $230.84 | 2023 | $230.71 | 5.63% |
| 0.14% | $253.04 | 2024 | $253.39 | 9.83% |
| Recession-Adjusted Forward PE | Historical 2023 EPS (Including Recession) | 12-Month forward EPS | 12-Month Forward PE | Historical Overvaluation |
| 21.33 | $190.03 | $230.47 | 17.583 | 4.35% |
(Source: DK S&P Valuation Tool)
The FactSet consensus for 2023 is showing 6% EPS growth, which is almost ridiculously optimistic for a recession year, no matter how mild.
Adjust for the average and median recession earnings decline since WWII, and stocks go from trading at 17.6X earnings to 21.3X.
- from 4% historically overvalued to potentially 26% overvalued
- Morgan Stanley expects 195 S&P EPS next year.
S&P Correction Watch
| All-Time High | 4,819 |
| Current | $4,020.47 |
| Distance From High | 16.57% |
| Pullback Level | 4578.05 |
| Correction Level | 4337.10 |
| -15% Correction Level (Historically Average Correction Bottom) | 4096.15 |
| Bear Market Level (-20%) | 3855.20 |
| -25% Bear Market | 3614.25 |
| -30% Bear Market | 3373.30 |
| -35% Bear Market | 3132.35 |
| -40% Bear Market | 2891.40 |
| Distance To Pullback | -11.6% |
| Distance To Correction | -6.6% |
| Distance To 15% Correction | -1.9% |
| Distance To Bear Market | 4.11% |
| Distance To -25% Bear Market | 10.1% |
| Distance To -30% Bear Market | 16.1% |
| Distance To -35% Bear Market (Average Historical Recessionary Bear Market Low -36%) | 22.1% |
| Distance To -40% Bear Market | 28.1% |
| Decline To Historical Fair Value | 3.2% |
| Record Closes This Year | 1 |
| Most Record Closes Ever (1995) | 77 |
| On Track For Record Closes: | 1.0 |
(Source: DK S&P Valuation Tool)
The blue-chip consensus is for the S&P to bottom at 3,000 to 3,400 in the first half of next year. Today the market trades at 4,020, a 16% to 28% decline from the likely final bear market bottom.
According to Bloomberg, Morgan Stanley, the most accurate economic forecaster for 2022, thinks the bottom might arrive as soon as late January.
- corresponding to tech earnings week
- and January option expiration.
Of course, there are no certainties on Wall Street, just probability curves. But the point is that:
- inflation is still much too high
- and expected to remain elevated through 2025
- the Fed is likely to hike another 1% or even 1.25%
- and then keep rates that high for the rest of the year
- pushing the economy into a mild recession
- causing current 2023 earnings estimates to miss expectations significantly
- and resulting in a potentially painful market correction that could shock many investors.
Am I selling any of my $2 million portfolio? Nope, why would I? My family uses the dividend income to pay $30,000 per month in medical bills, and the dividends keep growing in all economic and market conditions.
Besides, we’re in a 28% bear market, and whenever or how deep the bear market finally bottoms is irrelevant to long-term investors.
Ben Carlson
The average bear market is about a 38% decline. But if you buy stocks as soon as they hit -25%, in order to not miss out on the bargains, your average gain is 22% within a year. That’s even though stocks average a 17% further decline within a few months.
More importantly, the average 10-year gain is 214%, a 3.1X return.
In other words, unless you think the world is about to end, anyone buying blue-chips in this bear market will be thrilled with the results within 5+ years.
- If you are convinced the world is ending, why are you reading investing articles on Seeking Alpha instead of spending time with your family?
But guess who can benefit from understanding what will happen to the stock market next? Anyone who has been patiently waiting for persistently overvalued blue-chips like Apple Inc. (NASDAQ:AAPL) to fall back to earth.
Let’s examine why Apple is still overvalued in this bear market. And most importantly, at what prices in the first half of 2023 would represent a potentially wonderful opportunity to buy one of the world’s best companies.
Apple’s One Of The World’s Best Companies…But
GuruFocus Premium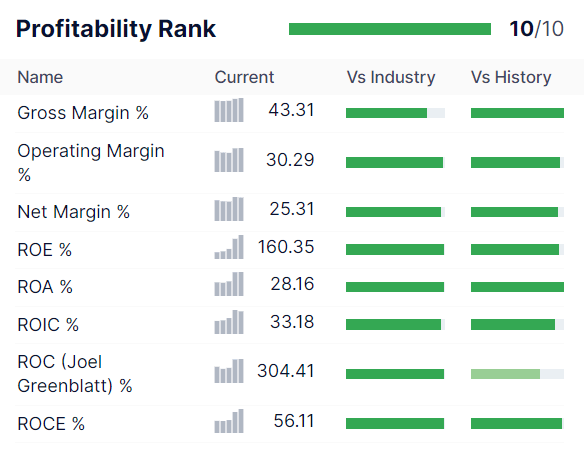
There is no question that Apple is one of the world’s best companies.
Its net margins of 25% are impressive, and its free cash flow margin of 28% is sensational.
Its 304% return on capital is 3X that of the dividend aristocrats and 18X that of the S&P 500.
Even more impressive is that Apple is expected to maintain those margins, courtesy of a fanatically loyal user base.
- 67% of iPhone users won’t even consider switching to Android.
Apple Consensus Margin Forecast
| Year | FCF Margin | EBITDA Margin | EBIT (Operating) Margin | Net Margin |
| 2021 | 25.4% | 32.9% | 29.8% | 25.9% |
| 2022 | 28.3% | 33.1% | 30.3% | 25.3% |
| 2023 | 24.9% | 32.1% | 29.1% | 24.2% |
| 2024 | 25.9% | 32.0% | 29.1% | 24.2% |
| 2025 | 27.1% | 32.0% | 28.9% | 24.1% |
| 2026 | 27.3% | 31.6% | 28.7% | 23.9% |
| 2027 | 26.8% | 31.0% | 28.2% | 23.8% |
| 2028 | 27.3% | 31.5% | 28.4% | 24.4% |
| Annualized Growth 2022-2028 | 1.01% | -0.60% | -0.69% | -0.86% |
(Source: FactSet Research Terminal)
Apple’s margins are expected to remain stable over time, even as it sells 212 million of the world’s most premium phones by 2025.
Apple Medium-Term Growth Consensus Forecast
| Year | Sales | Free Cash Flow | EBITDA | EBIT (Operating Income) | Net Income |
| 2021 | $365,817 | $92,953 | $120,233 | $108,949 | $94,680 |
| 2022 | $394,328 | $111,443 | $130,541 | $119,437 | $99,803 |
| 2023 | $405,531 | $101,014 | $130,344 | $118,170 | $98,089 |
| 2024 | $429,390 | $111,168 | $137,266 | $124,907 | $103,833 |
| 2025 | $449,020 | $121,823 | $143,580 | $129,905 | $108,267 |
| 2026 | $502,151 | $136,849 | $158,798 | $144,326 | $120,082 |
| 2027 | $565,588 | $151,397 | $175,329 | $159,733 | $134,645 |
| 2028 | $615,366 | $167,788 | $193,975 | $174,591 | $149,891 |
| Annualized Growth 2021-2028 | 7.71% | 8.80% | 7.07% | 6.97% | 6.78% |
| Cumulative 2022-2028 | $3,361,374 | $901,482 | $1,069,833 | $971,069 | $814,610 |
(Source: FactSet Research Terminal)
Apple’s top and bottom lines aren’t expected to grow that quickly in the coming years, thanks to the massive scale at which it operates. But given that Apple’s sales, cash flows, and profits are larger than most countries, that’s pretty impressive growth.
Apple Balance Sheet Consensus Forecast
| Year | Total Debt (Millions) | Cash | Net Debt (Millions) |
| 2021 | $124,719 | $34,940 | -$65,797 |
| 2022 | $120,069 | $23,646 | -$49,040 |
| 2023 | $120,051 | $65,574 | -$69,232 |
| 2024 | $120,047 | $78,820 | -$21,086 |
| 2025 | $119,981 | $155,050 | -$52,393 |
| 2026 | $110,087 | $430,325 | -$455,719 |
| 2027 | $110,087 | $564,339 | -$589,733 |
| 2028 | $110,087 | $714,151 | -$739,545 |
| Annualized Growth | -1.77% | 53.89% | 41.29% |
(Source: FactSet Research Terminal)
Apple’s AA+ credit rating balance sheet is expected to keep strengthening over time, with up to $740 billion in net cash (including services receivables) by 2028.
That’s despite spending $15 billion on dividends and pursuing the most generous capital return program in history.
Apple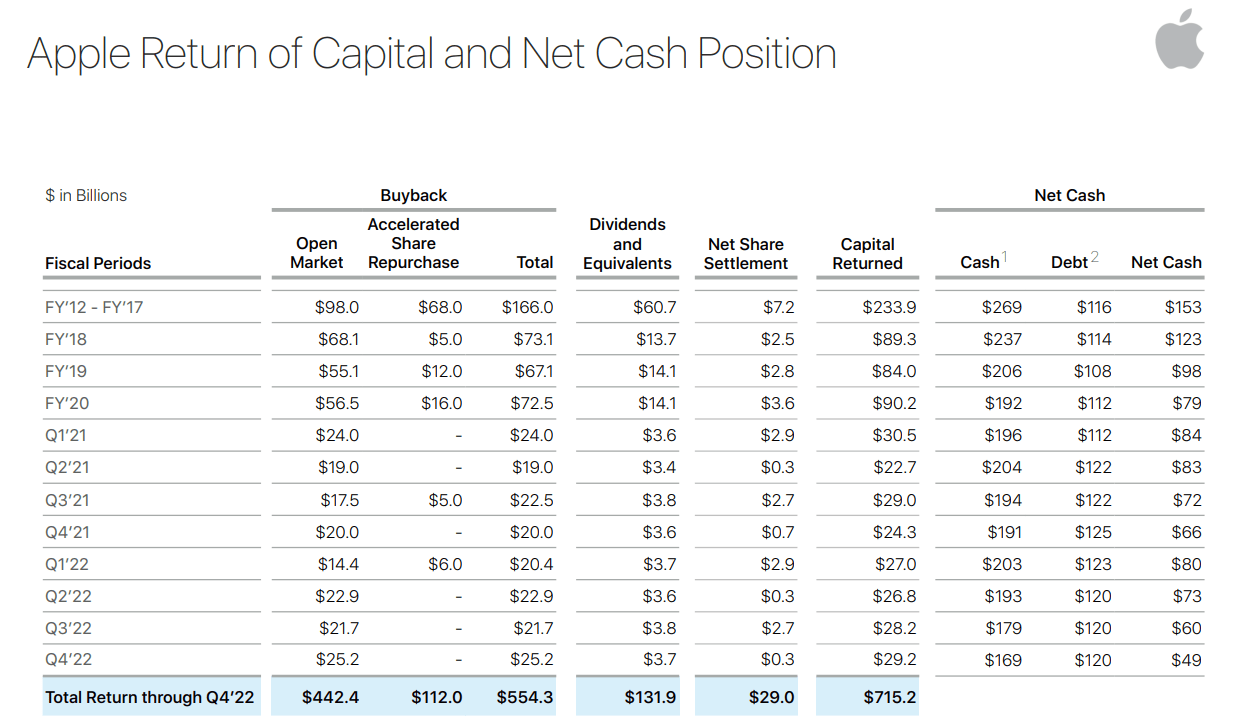
Apple has returned $715 billion to shareholders in the last decade, and its future buybacks are expected to be even more impressive.
Apple Buyback Consensus Forecast
| Year | Consensus Buybacks ($ Millions) | % Of Shares (At Current Valuations) | Market Cap |
| 2022 | $89,402 | 3.9% | $2,303,653 |
| 2023 | $79,108 | 3.4% | $2,303,653 |
| 2024 | $74,754 | 3.2% | $2,303,653 |
| Total 2023 through 2024 | $153,862 | 6.7% | $2,303,653 |
| Annualized Rate | 3.6% | Average Annual Buybacks | $76,931 |
| 1% Buyback Tax | $1,539 | Average Annual Buyback Tax | $769 |
(Source: FactSet Research Terminal)
Apple is expected to buy back an average of $77 billion per year worth of stock, 50% more than its 10-year average. That’s enough to repurchase 3.6% of shares yearly at current valuations.
(Source: FactSet Research Terminal)
Combine modest growth with aggressive buybacks, and that’s how you get 11% long-term growth expectations from all 43 analysts covering the company.
But this is where Apple’s valuation troubles come in.
…Apple’s Bubble Has Persisted For Years
FAST Graphs, FactSet
In the modern Tim Cook and fast-service growth era for the last seven years, Apple’s average P/E was 19.3X. Then the Pandemic hit, and $5 trillion in stimulus caused Apple’s earnings to boom by 71% in 2021. Euphoric tech investors claimed that more stable service revenue had made Apple an effective tech utility and thus worth the 31X earnings it hit at its Pandemic bubble peak.
Well, let’s examine that thesis for a minute. Amazon (AMZN), Microsoft (MSFT), and Alphabet (GOOGL) historically trade at 26X earnings or cash flow. But they have contractual cash flow from cloud computing or monthly subscriptions. They are true tech utilities.
FactSet Research Terminal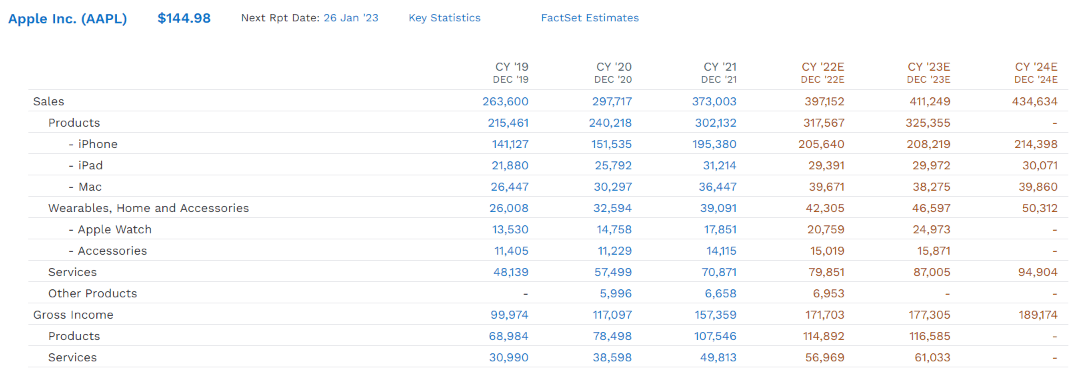
In 2019, pre-Pandemic, Apple’s sales came 82% from cyclical product sales.
18% came from services that aren’t contractual or based on subscriptions but merely a 15% to 30% cut of app store sales.
- Which many companies continue to challenge in court/
By 2024 Apple’s sales are expected to be 77% from products and 22% from services.
- service revenue growing 9% per year over the next two years
- about 2% faster than overall sales/
It’s going to be a long time before the majority of Apple’s sales come from RELATIVELY less cyclical services. The closest thing Apple has to a true subscription revenue stream is Apple TV Plus, which isn’t profitable and might never become profitable.
What does this mean for Apple’s valuation?
| Metric | Historical Fair Value Multiples (10-Years) | 2021 | 2022 | 2023 | 2024 |
12-Month Forward Fair Value |
|
| P/E | 19.33 | $110.95 | $118.69 | $122.94 | $139.18 | ||
| Average | $110.95 | $118.69 | $122.94 | $139.18 | $122.86 | ||
| Current Price | $144.83 | ||||||
|
Discount To Fair Value |
-30.53% | -22.03% | -17.81% | -4.06% | -17.89% | ||
|
Upside To Fair Value (Including Dividends) |
-23.39% | -18.05% | -15.12% | -3.90% | -14.54% | ||
| 2022 EPS | 2023 EPS | 2022 Weighted EPS | 2023 Weighted EPS | 12-Month Forward P/E | 12-Month Average Fair Value Forward P/E | Current Forward P/E |
Cash-Adjusted PE |
| $6.14 | $6.36 | $0.12 | $6.24 | $6.36 | 19.3 | 22.8 | 18.6 |
(Source: DK Research Terminal)
That Apple is likely about 18% overvalued, trading at 22.8X earnings. Even adjusting for cash, it’s trading at 18.6X earnings.
Ok, but that doesn’t sound too bad, right? 19X for a company of Apple’s wide moat dominance, profitability, and growth?
- 13-year median cash-adjusted earnings: 10.6X.
And I’m hardly the only one that thinks Apple is modestly overvalued.
|
Morningstar Fair Value Estimate |
| $130.00 (20.5 P/E) |
|
Discount To Fair Value |
| -11.41% |
|
Upside To Fair Value (Not Including Dividend) |
| -10.24% |
|
Fair Value + 12-Month Dividend |
| $130.92 |
|
Discount To Fair Value + 12-Month Dividend |
| -10.62% |
|
Upside To Fair Value + Dividend |
| -9.60% |
(Source: Morningstar)
Morningstar’s discounted cash flow model considers Apple’s steadily higher service sales and wide moat. And yet they think it’s worth 20.5X earnings, very similar to the seven-year market-determined fair value P/E.
So what does that potentially mean for anyone buying Apple today?
Apple 2025 Consensus Total Return Potential
(Source: FAST Graphs, FactSet Research)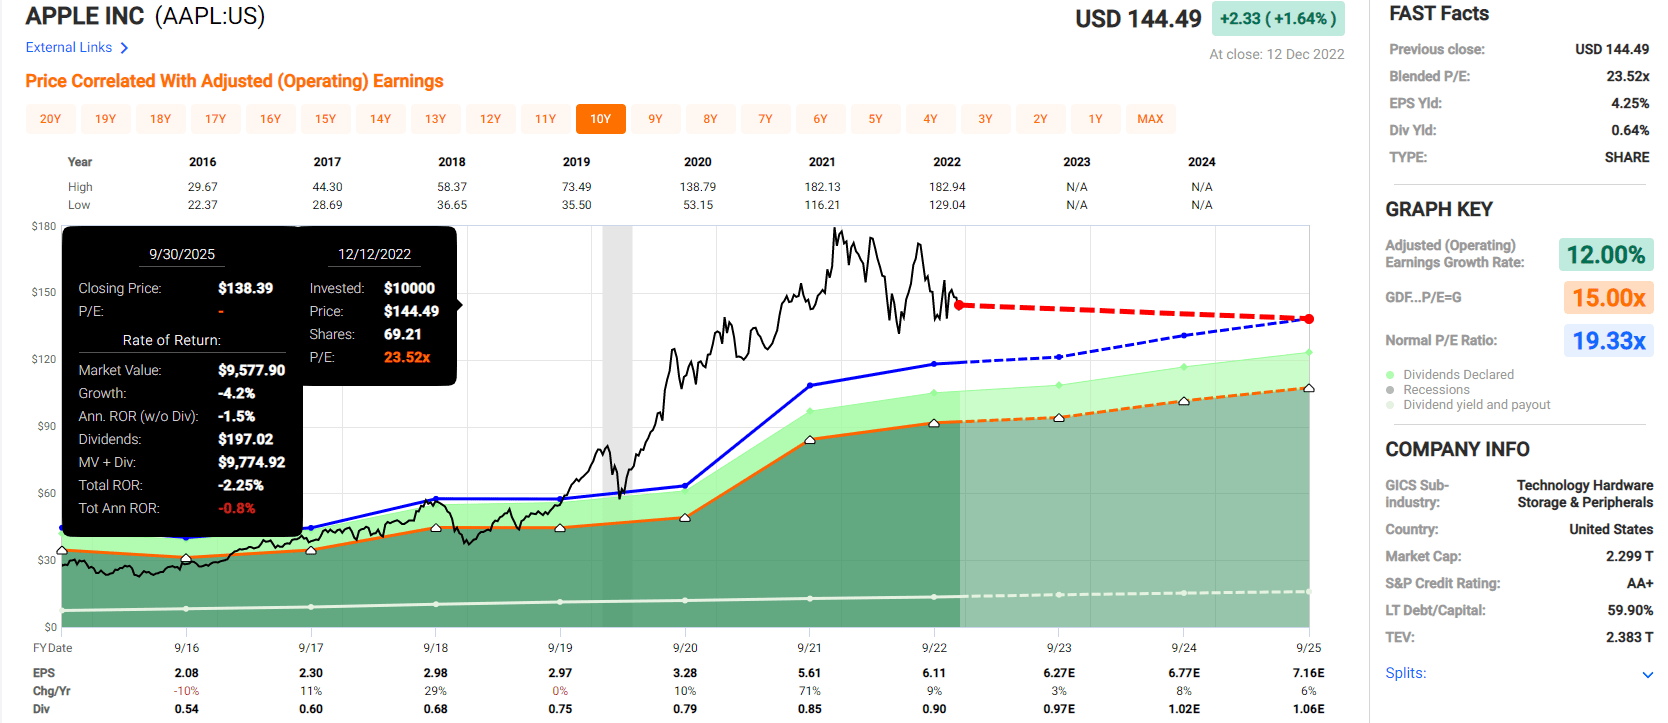
Apple isn’t expected to grow very quickly over the next few years, meaning that if you buy it today, you can expect to make no money through 2025, basically.
- your inflation-adjusted returns are likely to be negative.
Apple 2029 Consensus Total Return Potential
(Source: FAST Graphs, FactSet Research)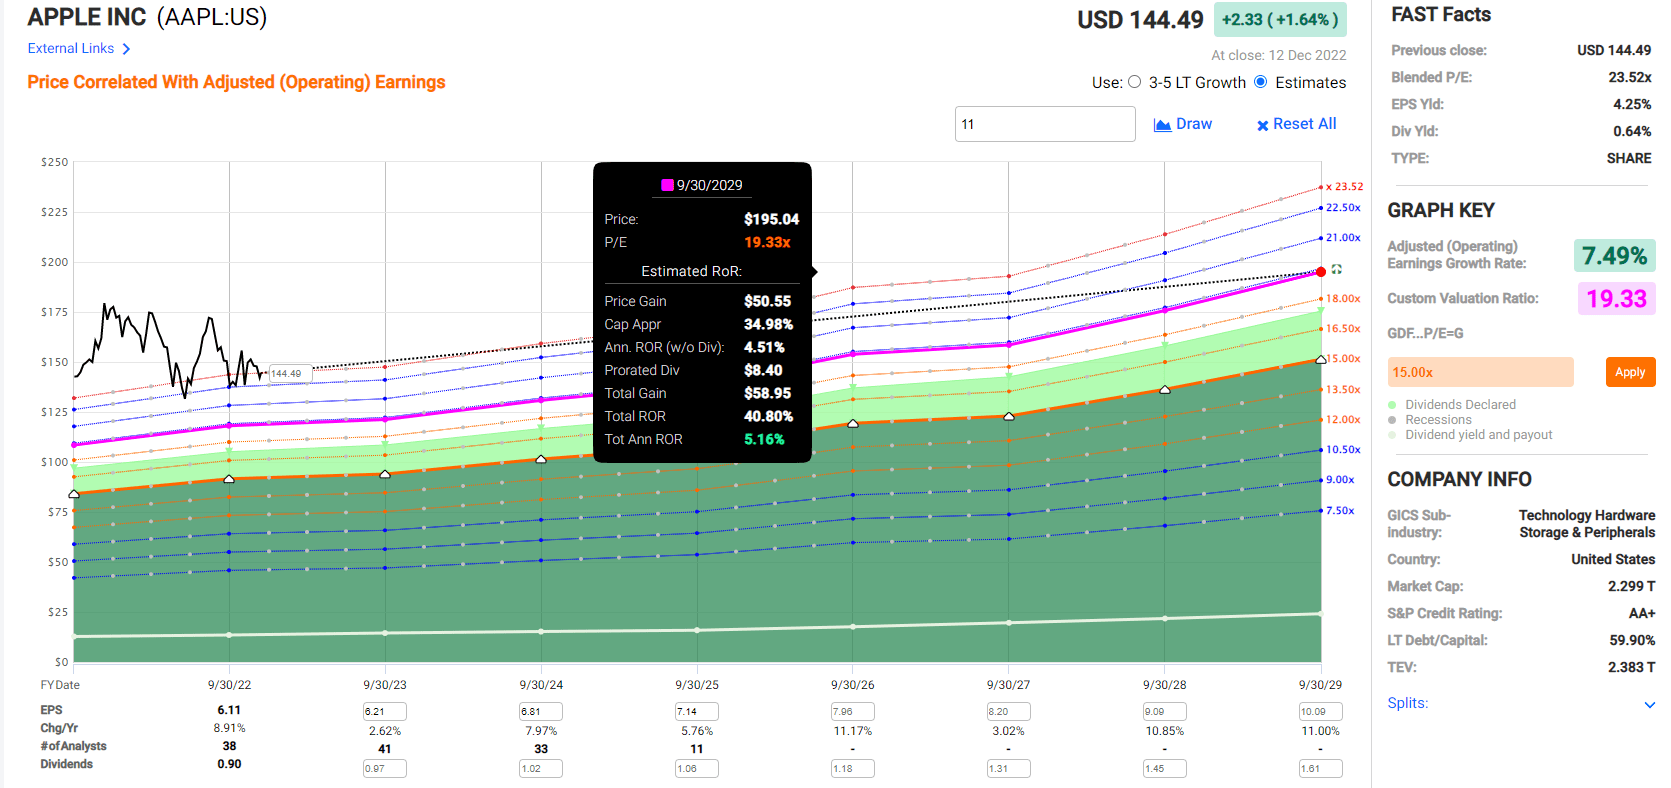
If Apple grows as expected over the next five years, about 7% to 8%, then from today’s valuation, you can expect around 40% total returns or 5% annually.
- about 2.5% inflation-adjusted returns.
What’s the five-year consensus total return range?
Basically, Apple today doesn’t represent a wonderful company at a fair price but a wonderful company at a premium price. This, in a bear market in which world-beater blue-chip bargains are plentiful.
Apple Investment Decision Score
Dividend Kings Automated Investment Decision Tool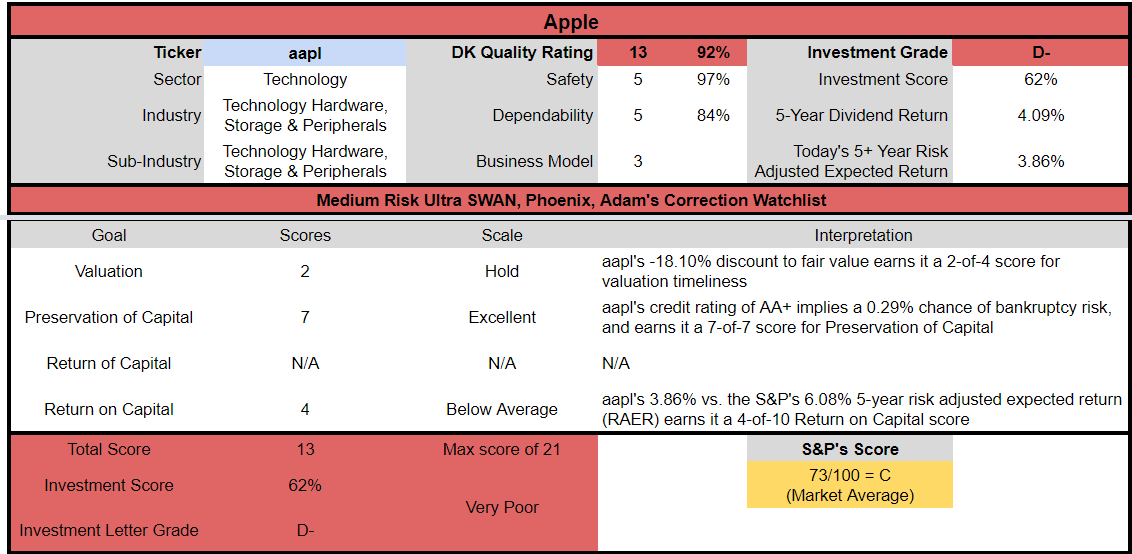
Apple is a potentially very poor investment right now, even if you are comfortable with Apple’s risk profile. Look at how it compares to the S&P 500.
- 18% discount to fair value vs. 3% premium S&P = 15% worse valuation
- 0.6% safe yield vs. 1.7% (1/3rd the yield and growing about as fast)
- approximately 11% long-term annual return potential vs. 10.2% CAGR S&P
- about half the risk-adjusted expected returns.
Compared to the S&P 500, Apple is not a great buy right now.
When It Could Be Time To Buy Apple In 2023
So if Apple isn’t a good buy now, or even a reasonable buy, when is a good time? That’s not the right question; the question is, what margin of safety does Apple sufficiently compensate you for its risk profile?
| Rating | Margin Of Safety For Medium Risk 13/13 Ultra SWAN (Sleep Well At Night) Quality Companies | 2022 Fair Value Price | 2023 Fair Value Price | 12-Month Forward Fair Value | Distance To Price |
| Potentially Reasonable Buy | 0% | $118.69 | $122.94 | $122.86 | -15.5% |
| Potentially Good Buy | 5% | $112.75 | $116.79 | $116.71 | -19.7% |
| Potentially Strong Buy | 15% | $100.88 | $104.50 | $104.43 | -28.2% |
| Potentially Very Strong Buy | 25% | $84.56 | $92.20 | $92.14 | -36.6% |
| Potentially Ultra-Value Buy | 35% | $77.15 | $79.91 | $79.86 | -45.1% |
| Currently | $145.37 | -22.48% | -18.25% | -18.32% | |
| Upside To Fair Value (Including Dividends) | -17.72% | -14.80% | -14.85% |
(Source: DK Research Terminal)
Currently, Apple needs to fall about 16% before it’s historically fairly valued, at which point it becomes a reasonable buy.
- the two-year consensus return potential rises to 9% per year
- the five-year return consensus total return potential rises to 9% per year.
Apple needs to fall about 20% before it’s 5% undervalued and a potentially good buy.
- the two-year consensus return potential rises to 12% per year
- the five-year return consensus total return potential rises to 10% per year.
Apple needs to fall about 28% before it’s 15% undervalued and a potentially strong buy.
- the two-year consensus return potential rises to 18% per year
- the five-year return consensus total return potential rises to 12% per year.
Apple needs to fall about 37% before it’s 25% undervalued and a potentially very strong buy.
- the two-year consensus return potential rises to 26% per year
- the five-year return consensus total return potential rises to 15% per year.
Apple needs to fall about 45% before it’s 35% undervalued and potentially an Ultra Value, table-pounding, back-up-the-truck Buffett-style “fat pitch” buy.
- the two-year consensus return potential rises to 35% per year
- the five-year return consensus total return potential rises to 18% per year.
Where will Apple actually fall to? No one knows. But in case you think that Apple falling 17% to $117, the potential good buy price is outlandish, consider its history.
Apple’s Historical Bear Markets
Ycharts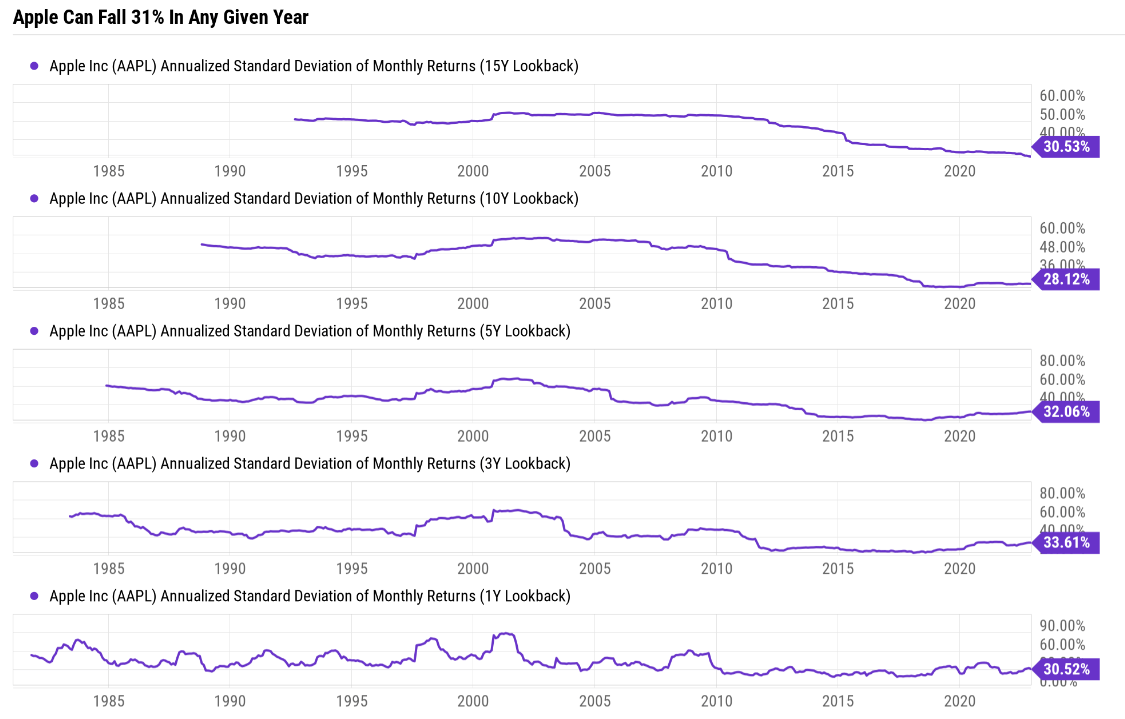
Apple can fall 31% in any given year, even when the thesis is intact.
Portfolio Visualizer Premium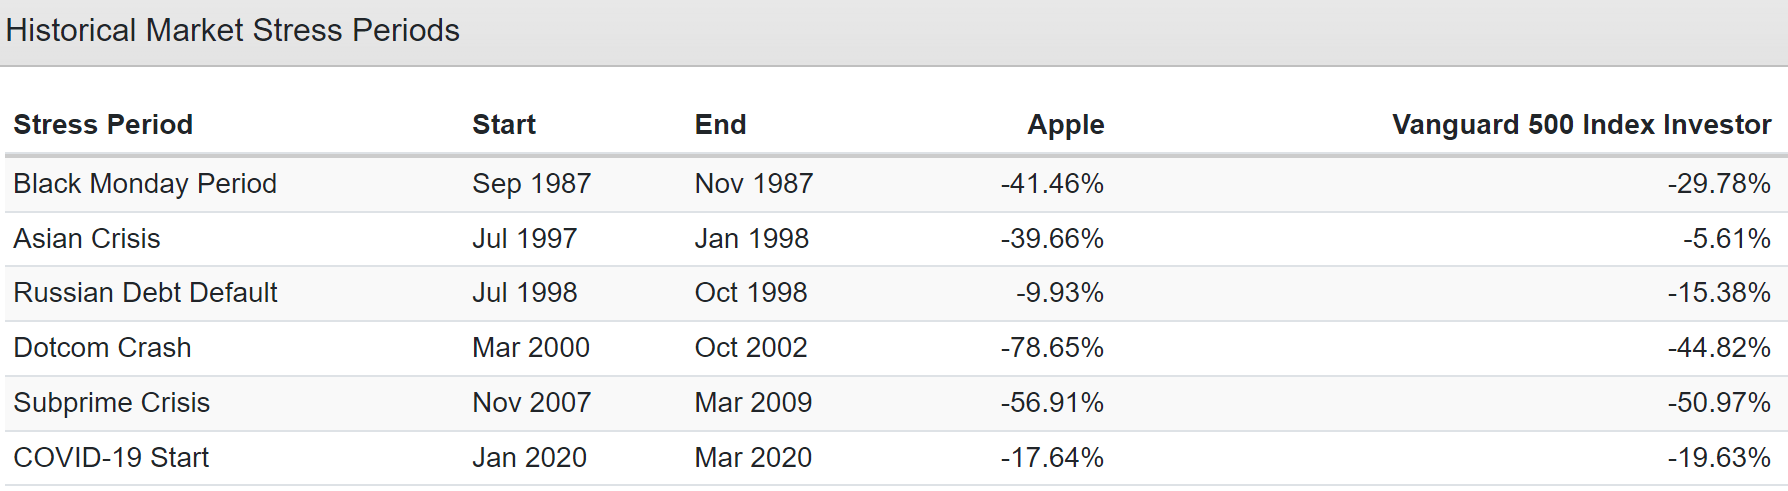
Apple isn’t a particularly defensive stock, tending to fall as much as the market or frequently much more.
Portfolio Visualizer Premium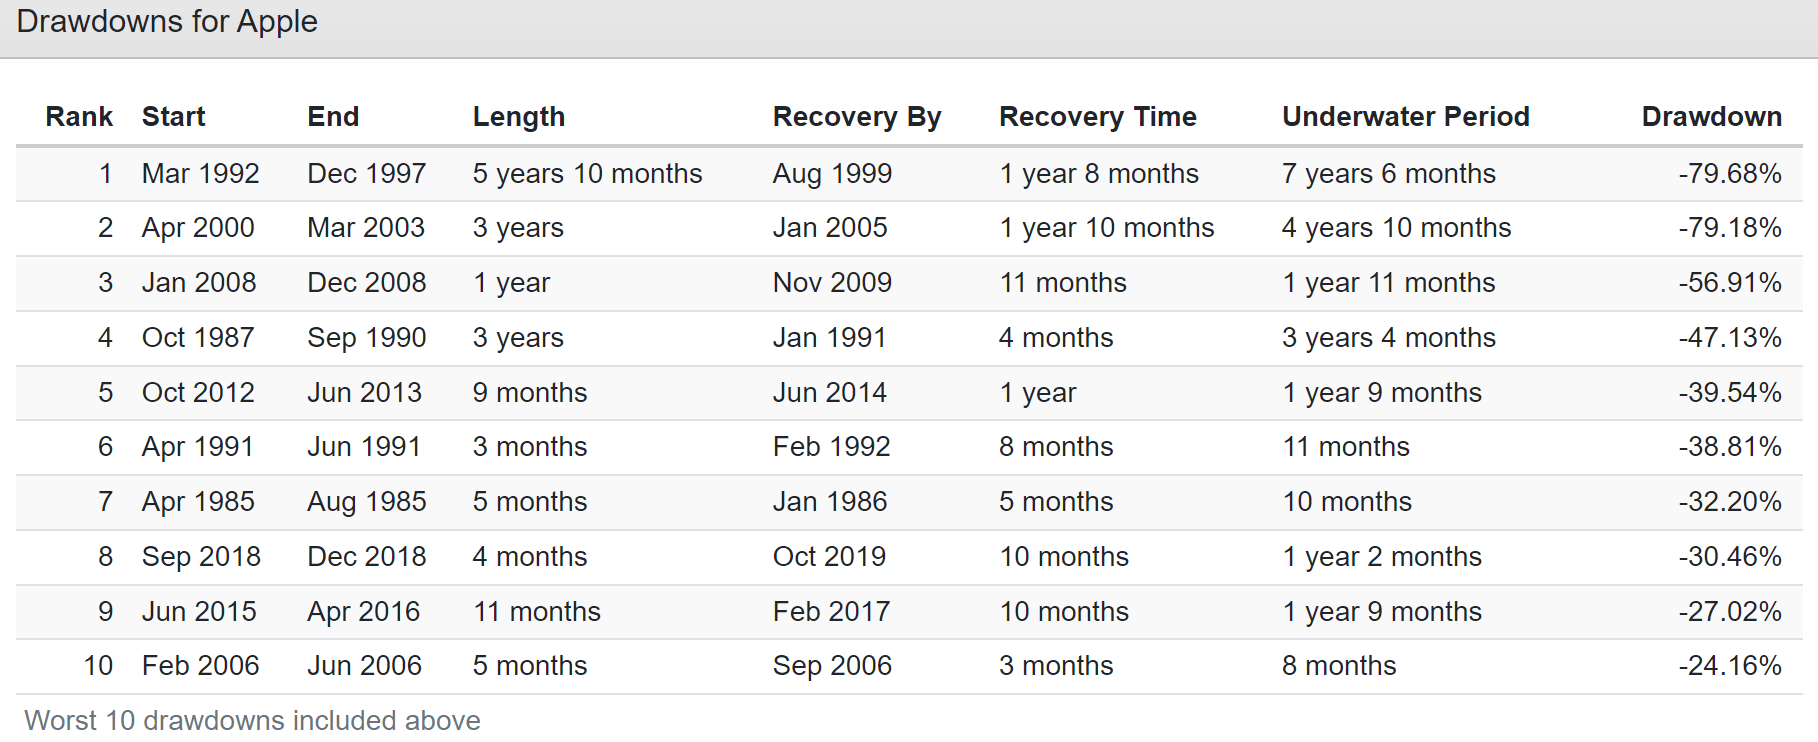
In the last decade, Apple has suffered two bear markets outside of the Pandemic.
Portfolio Visualizer Premium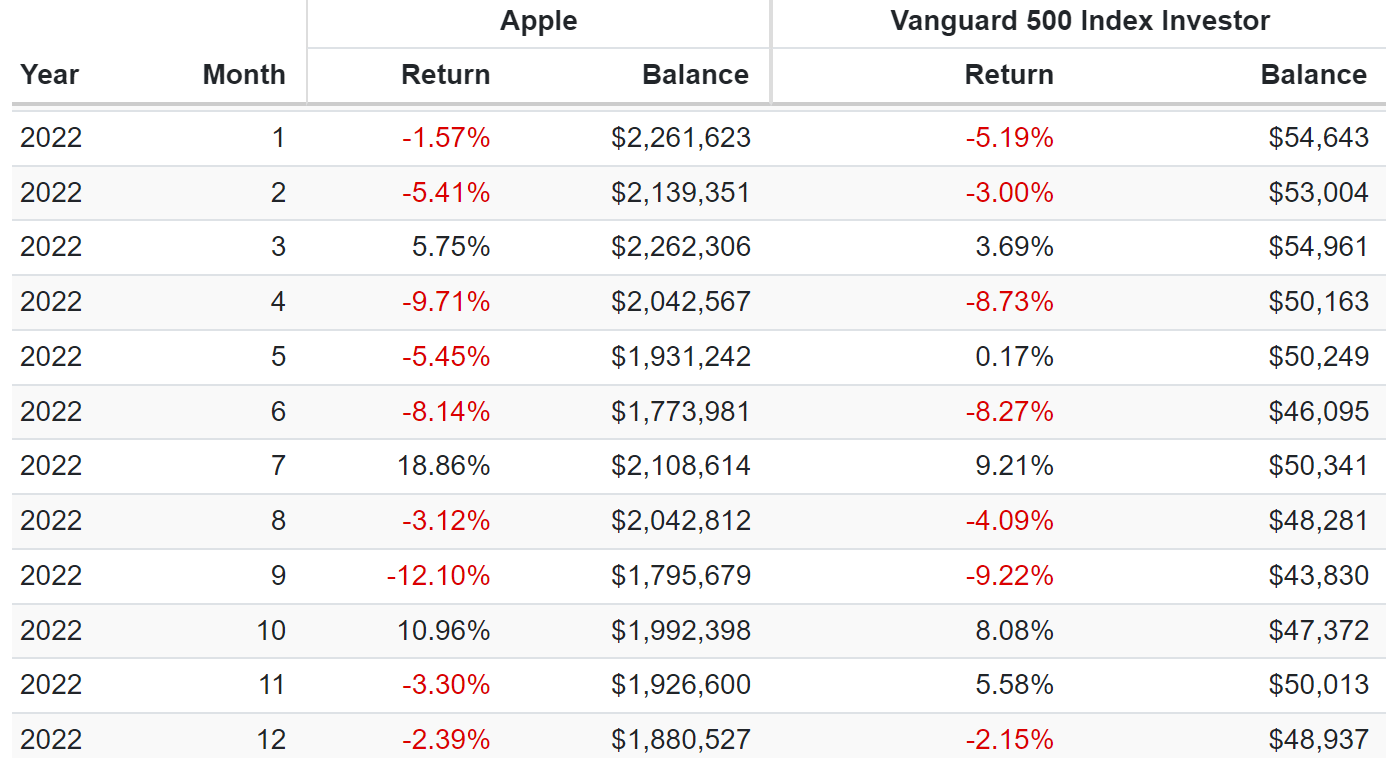
Apple has fallen double-digits in a single month twice during this bear market alone.
Portfolio Visualizer Premium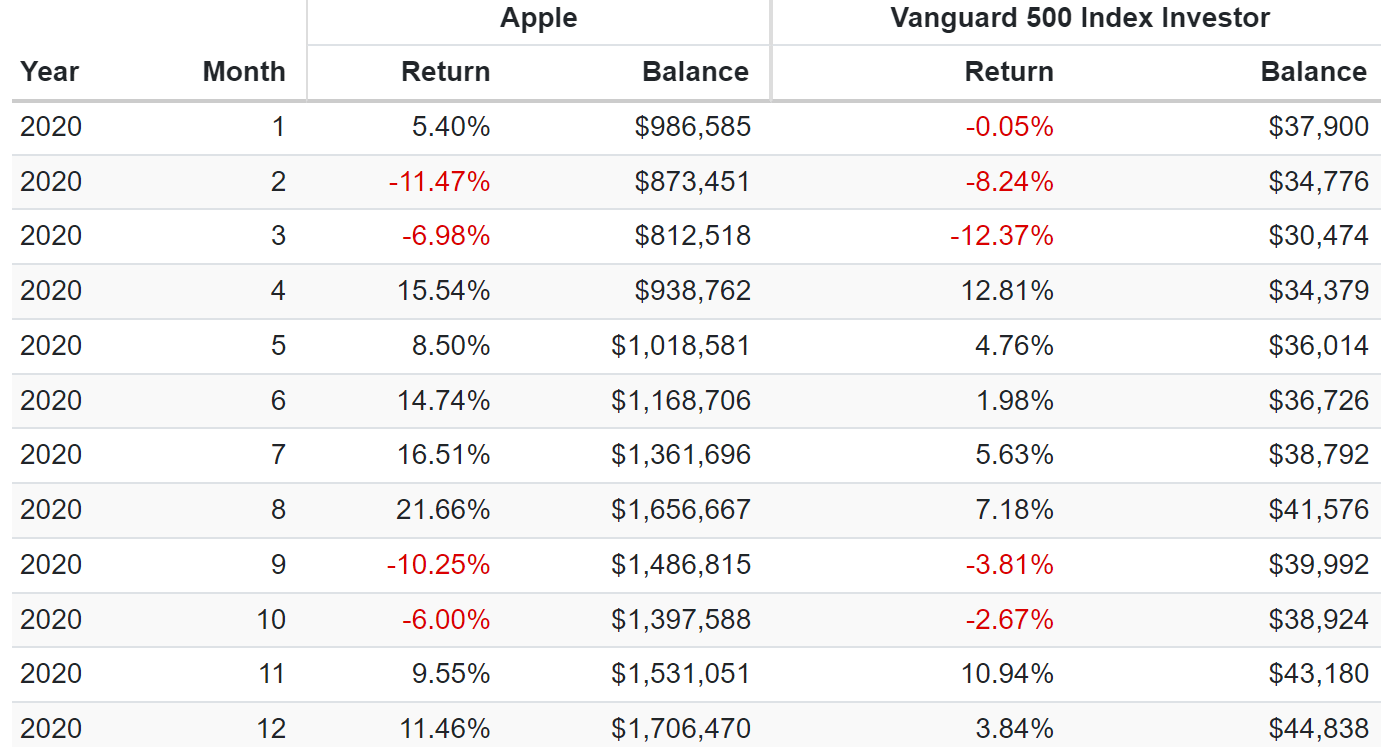
Apple can even fall double-digits in a month outside market corrections, as it did in September of 2020.
Portfolio Visualizer Premium
Remember the 2018 recession-scare bear market? Apple fell 30% in three months. And that was on fears of a recession. In 2023 we’re almost certainly headed for a mild recession.
Bottom Line: Apple Is A Wonderful Company At A Bad Price…But Be Ready To Start Buying At $117 Or Lower In 2023
Don’t get me wrong; I’m NOT making a price call on Apple. Stock prices are a crap shoot in the short term, and only in the long term are fundamentals-driven destiny. This is why I NEVER make price calls. Fair value estimates are NOT price targets; they are NOT predictions about where a stock will go in the short-term.
The point is that anyone telling you that Apple was a good buy at 30X earnings near the bubble’s peak was speculating, not analyzing fundamentals.
They might have dressed it up as fundamentals, telling you that growing services justify a sky-high multiple. That’s the same kind of bubble mentality that “justified” ARKK’s bubble returns.
We know how that worked out.
Ycharts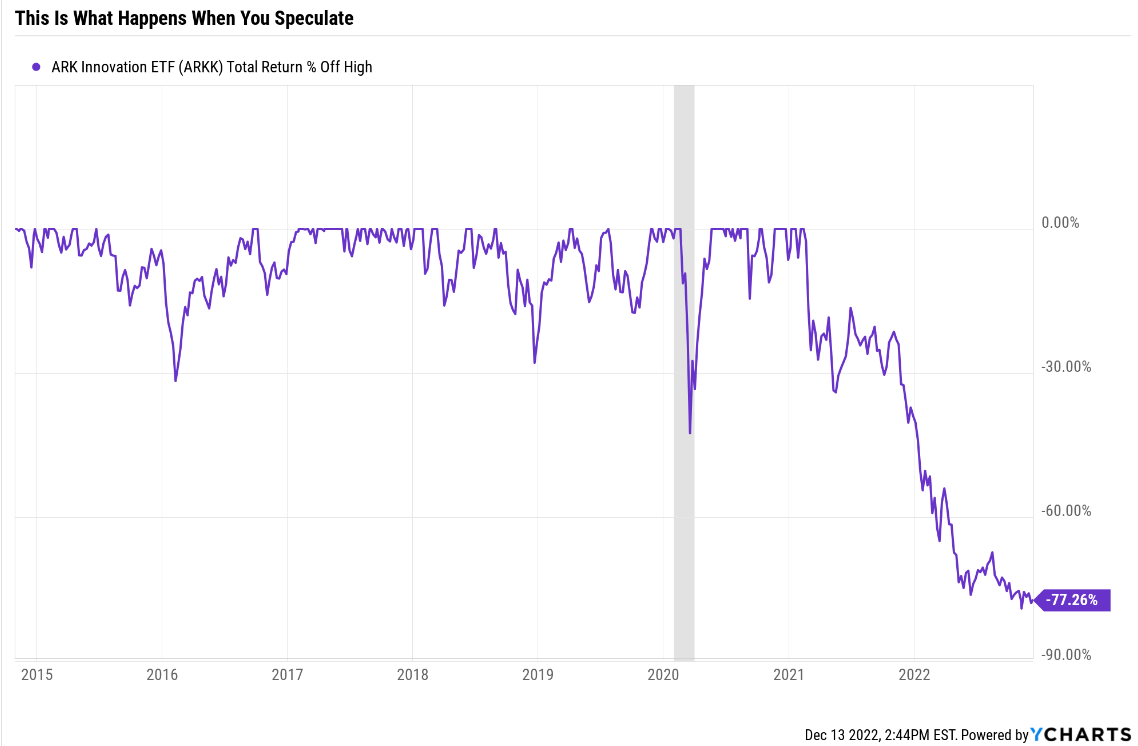
Could Apple be worth 25X earnings in the future? Sure. Has it ever been valued by the market at such lofty multiples outside of bubbles? No.
Anyone claiming that the new post-Pandemic bubble valuations are the “new normal” is speculating, not using market-determined fair values.
- which are based on what billions of investors have paid overtime outside of bubbles and bear markets
- not my opinion, but objective market-determined fact.
And given that Apple’s growth rates through 2028 have slowed to single digits, I don’t see any reason to recommend anyone speculate by knowingly overpaying for the company in the hope that maybe, one day, it will truly become a tech utility and be valued as such.
$123 is the current market-determined fair value for Apple. That’s the price at which you fully participate in the company’s future growth.
$117 is the current good buy price, at which you have a sufficient margin of safety to compensate you for Apple’s risk profile.
And $105 is the strong buy price, at which I’d say it’s time for Apple investors to really start buying aggressively.
Hope is never a good long-term investment strategy, and that’s especially true in a recessionary bear market.
What if Apple never falls to $123 in the coming months? What if the blue-chip consensus is wrong, Fidelity is right, and October was the market bottom?
Remember that patience is the ultimate investing virtue, and you don’t have to buy Apple in every market downturn. Buy even the world’s best blue-chips only at reasonable or attractive valuations, and success is assured over time within a diversified portfolio.
Be the first to comment