

Emils Vanags/iStock via Getty Images
Elastic N.V. (NYSE:ESTC) has likely developed some of the best real-time search technology, which has massive use cases across the board. The company offers their technology as a subscription service for cloud, on premise and hybrid applications. Customers can use the search technology to quickly find info on external websites, internal bases, consisting both structured and unstructured data.
That being said, Elastic has multiple difficulties as an investment, which is why we currently rate the company as a hold, contingent on them developing growth avenues that will expand what is currently priced-in in their valuation without relying on TAM expansion.
In order to establish our thesis, we took the market value of Elastic and reverse engineered it to derive the driving assumptions implied in today’s stock price. This is also known as reverse DCF and can be used to see what buy-side analysts are actually “pricing-in” for the stock.
Reverse DCF For Elastic
In a normal DCF, the key takeaway would be that Elastic is overvalued by some %, while in the reverse version we can diagnose that the key variable, which the market may be overly bullish on, is the revenue CAGR by some 10-15% per year. Alternatively, the market may be pricing in a larger than plausible profit margin given the current competitive environment and technology availability.
With the right setup, the reverse DCF is fairly easy to do. The key value drivers of a stock in any DCF are: growth rates, profitability and a discount rate that time weighs the returns to investors. There are many valuation approaches, all of which seek to estimate the mentioned parameters in one way or another. In our case, we use the free cash flows to the firm as a basis for our DCF. This means that we need to reverse engineer the revenue growth rates, convergence margin at the end of the forecast period (we use 10-year models), the discount rate and reinvestment rate. We will display our results for each parameter and the rationale behind them.
Valuation Model
Elastic is currently trading at $83 per share with a $7.9b market capitalization. Here are the basics of our (hopefully) plausible model on how the company needs to perform in order for this value to be justified:
- 5-year revenue CAGR of 35%, with a decay function converging on the risk-free rate of 3.2% for the rest of the period.
- Convergence EBIT margin at the end of the 10-year forecast period of 25%.
- Reinvestment rate of 107.1% (100% will do just fine).
- Discount rate of 9.2%.
Note that we are neutral on rates and use today’s market metrics along with fundamentals to arrive at the discount rate.
When we add all of these factors up, this is what we get for Elastic:
| Billions USD | Last TTM | In Year 10 |
| Revenue | $0.92 | $8.50 |
| Adj. EBIT | $-0.03 | $2.12 |
| Full FCFF | $-0.46 | $1.31 |
This is how that looks in practice:
Chart 1. Elastic’s Inverse Valuation Model (Author image using data from ThinkValue)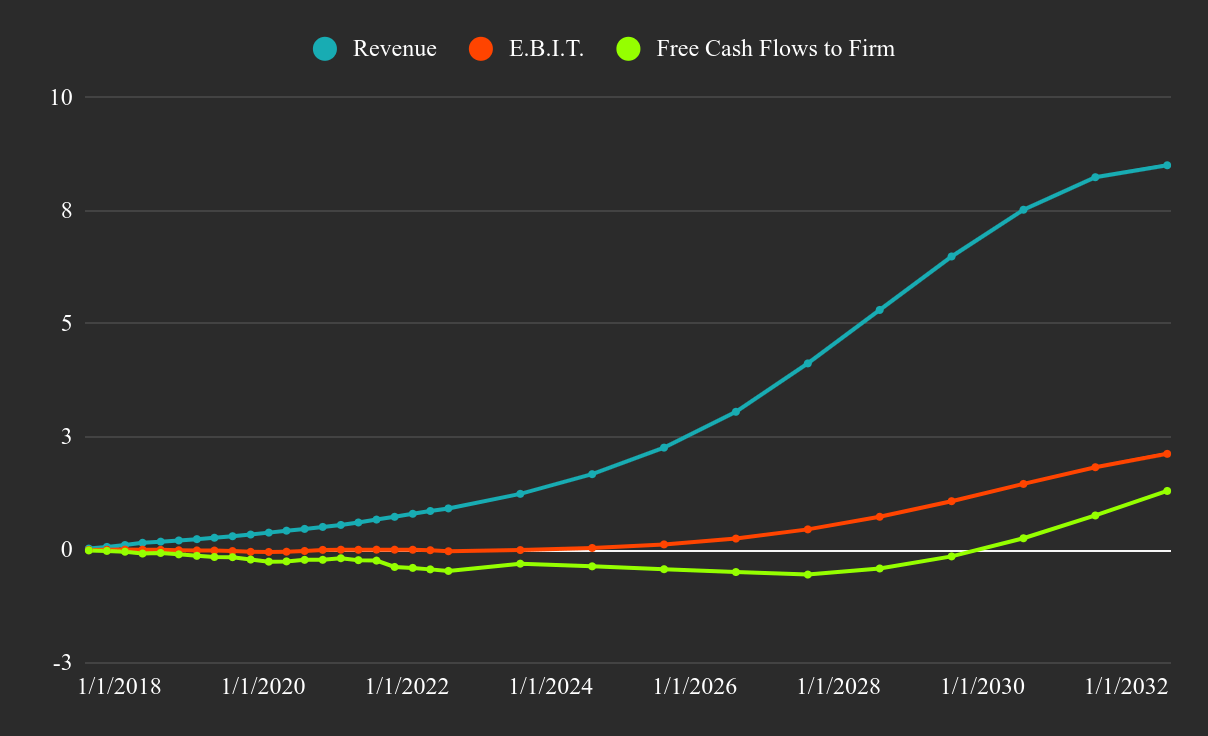
We can see that the company would need to grow revenues to $8.5b, and provide some $1.3b as free cash flows. It is also important to note that the company is not expected to become profitable while it is in its high-growth phase, which also assumes a fair bit of CapEx spending.
You can inspect the complete spreadsheet model here, or try a view only version here. Feel free to copy (File->Make a Copy), if you want to make your own valuation.
Investors may ask if this is a likely scenario, and in order to do that, we need to inspect a few areas.
Estimating Revenue Growth Capacity
There are three key points to review when estimating growth capacity: Total Addressable Market (TAM), likely market share, growth lifecycle.
Total Addressable Market
Elastic estimates their own TAM to be around $79b in 2021, and given their $919m in last 12 months of revenue, they currently hold 1.2% of the market share. This means that the company is still a minor player with plenty of room to grow.
Chart 2. Elastic’s Stated TAM (Investor Presentation)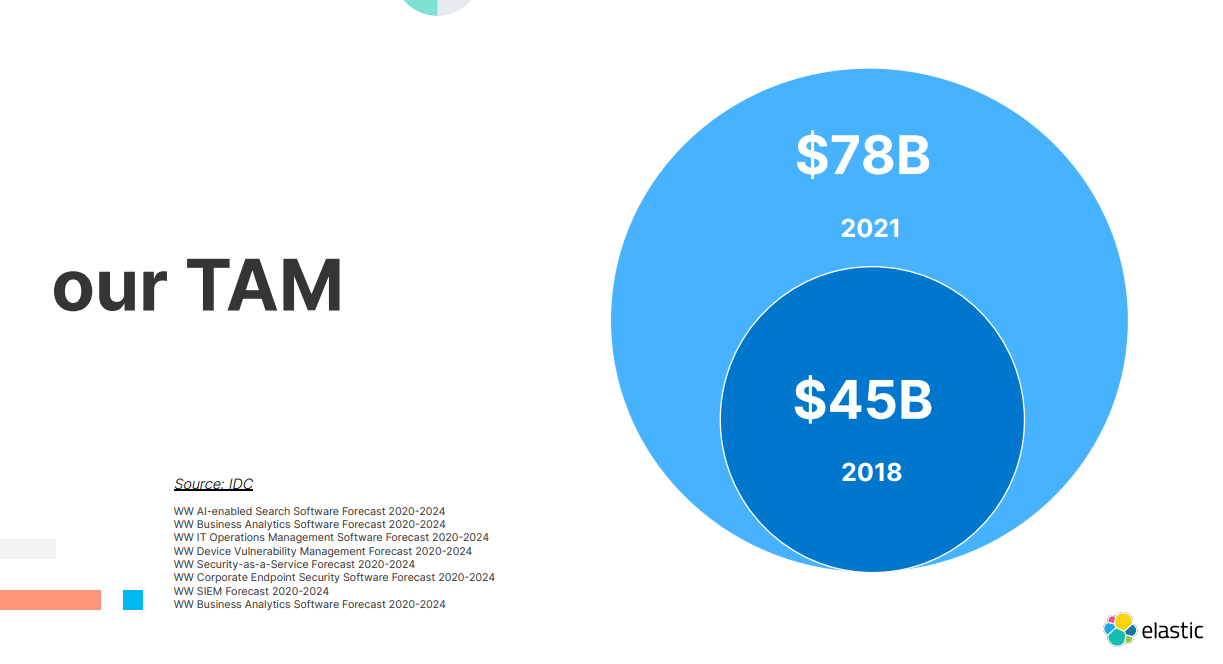
Client Onboarding
Typically, a company’s initial growth comes from their early adopters, after which they need to target clients with a good product to need fit, and finally they need to develop their sales-force to discover growth opportunities.
It is both reassuring and cautionary that Elastic has a great client wall in their investor presentation. This tells us that they have onboarded large enterprises, but it also signals that they have reached out to corporations and may have already booked a sizeable portion of the largest clients that fit their product.
Chart 3. Elastic’s Client Wall (Investor Presentation)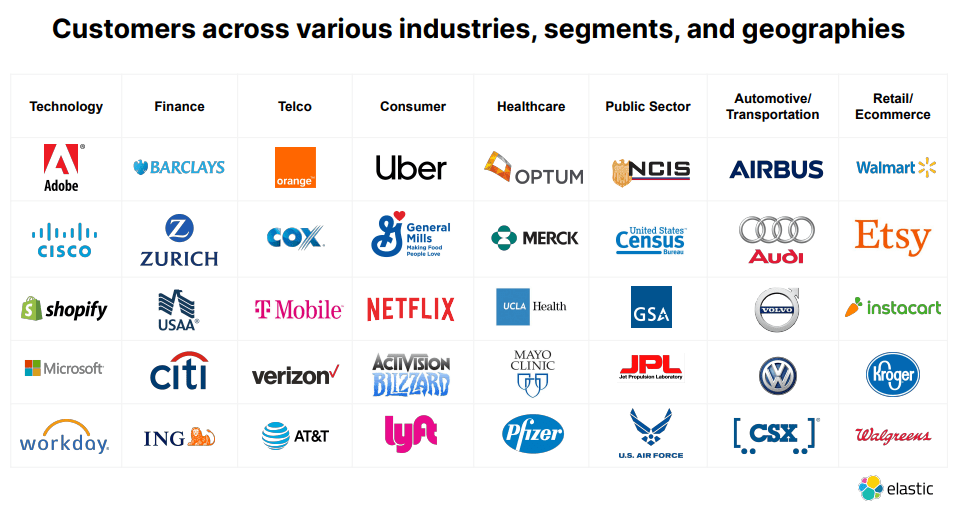
The company has more than 19,300 clients, of which 115+ are large clients contributing more than a million USD in annual contract value (ACV). Considering that more companies are moving their data to the cloud and adopting new cloud solutions, the demand for search will increase and Elastic will onboard new clients as well as expand the monetization on existing ones.
The Growth Lifecycle
The cloud adaptation trend is already underway, and unless the tech sees significant breakthroughs (which are possible) we can expect a continuation of rates to be the more likely scenario instead of abrupt jumps in client adaptation. When looking at Elastic’s historical growth rates, we tend to see what is classically expected from a young growth company – high growth rates that are stabilizing over time.
Chart 4. Elastics TTM Revenue Growth Rates (Author image using data from ThinkValue)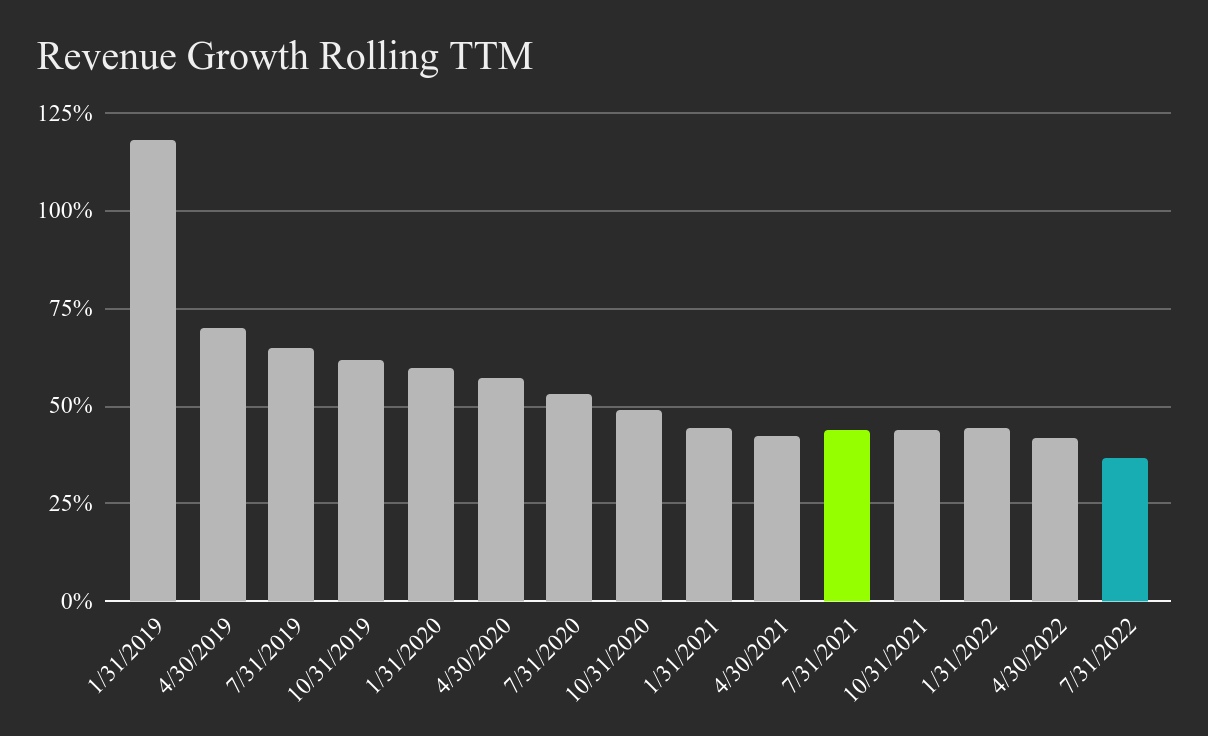
Elastic has grown revenues by 36.7% in the last 12 months, and the chart reveals that the business (as it stands today) is slowly decelerating growth. Considering that management is guiding for a FY2023 26% revenue growth, predicting higher growth rates becomes a bull case.
Next, we need to consider the potential market share of the company, which is where things get slightly complicated.
Market Share Capacity
The first thing we need is to project the TAM out to the end of our forecast period. This is fairly simple, as the current TAM is $79 billion, and we can assume a moderate industry CAGR of 10%, yielding the following: 79*1.1^10=$205b by 2032. This looks good, perhaps too good. In 2018, before they expanded their TAM, the company indicated (p.4) a combined $17 billion opportunity of Search, content analytics, and cognitive/AI software; and IT operations management. While the company cites some 70% revenues from “other services” in their segment breakdown, it is likely that search and observability are at the heart of their service. This is why we view the TAM estimate as plausible, but not yet within what the company can reasonably offer to clients, i.e., the serviceable market is the right metric here and it is likely lower.
A 2021 article indicated that Amazon (AMZN) was making more than $100 million from top Elasticsearch customers in 2018. Comparing this with Elastic’s 2018 revenue of $211 million, it seems that there is a 1:2 split between the market share for the competitors.
Elastic has many competitors, some of which are established and others are disrupting tech startups that cater to smaller clients with less developed but cheaper services. Gartner published a list of top Elastic competitors which includes: Microsoft (MSFT), Alphabet (GOOGL), IBM (IBM), Coveo (CVO:CA), Search365 ((MSFT partner)), OpenText (OTEX), etc. There is also a useful list of open source and freemium products available, which indicates that this industry is fast-paced with no clear winner (or survivors for that matter) in sight.
Given the competitive mix, and large cited TAM, it may be a stretch to assume a market share higher than 6% in the next decade. In conclusion, there seems to be a mismatch between the market opportunity and the expected growth rates needed to reach a stable market share. For this reason, we chose the 35% midpoint as a plausible growth trajectory in an expanding industry. This results in the company making $8.5b in year 10, roughly 9x from the last 12 months.
Next, we will take a closer look at profitability and try to assess where margins may fall in the future.
How Profitable Can Elastic Become?
In the previous section, we touched on the competition and technological development. For Elastic investors, it is well worth to get a refresher on its origin as an open-source Amazon partner. Aside from the easygoing undertone, a video from Jeff Delany (Fireship on YouTube) gives valuable insight on Elastic’s history and business approach.
To sum up the video, there is an open source version of Elasticsearch which Amazon and other competitors can legally fork and build upon. Jeff notes that an open source company still has ways to monetize, which is what Elastic is doing, but the technology is easily accessible to competitors and startups are constantly pitching similar services. This is the forked version of Elastic search that Jeff mentions in his video.
This has implications for Elastic’s ability to capture value. Competitors will have an easier road to developing similar services, and clients may start developing in-house solutions if the service gets too pricey. In order for the inverse valuation to work, Elastic must produce some $1.3 billion in free cash flows to the firm (net of acquisition CapEx and stock-based compensation) by year 10. This implies an EBIT margin of 25% which is roughly in line with the U.S. software industry margins, but may be an overreach given the discussed hurdles.
Just to get some perspective, here are Elastic’s current margins on a TTM basis:
Chart 5. Elastic’s Historical TTM Margins (Author image using data from ThinkValue)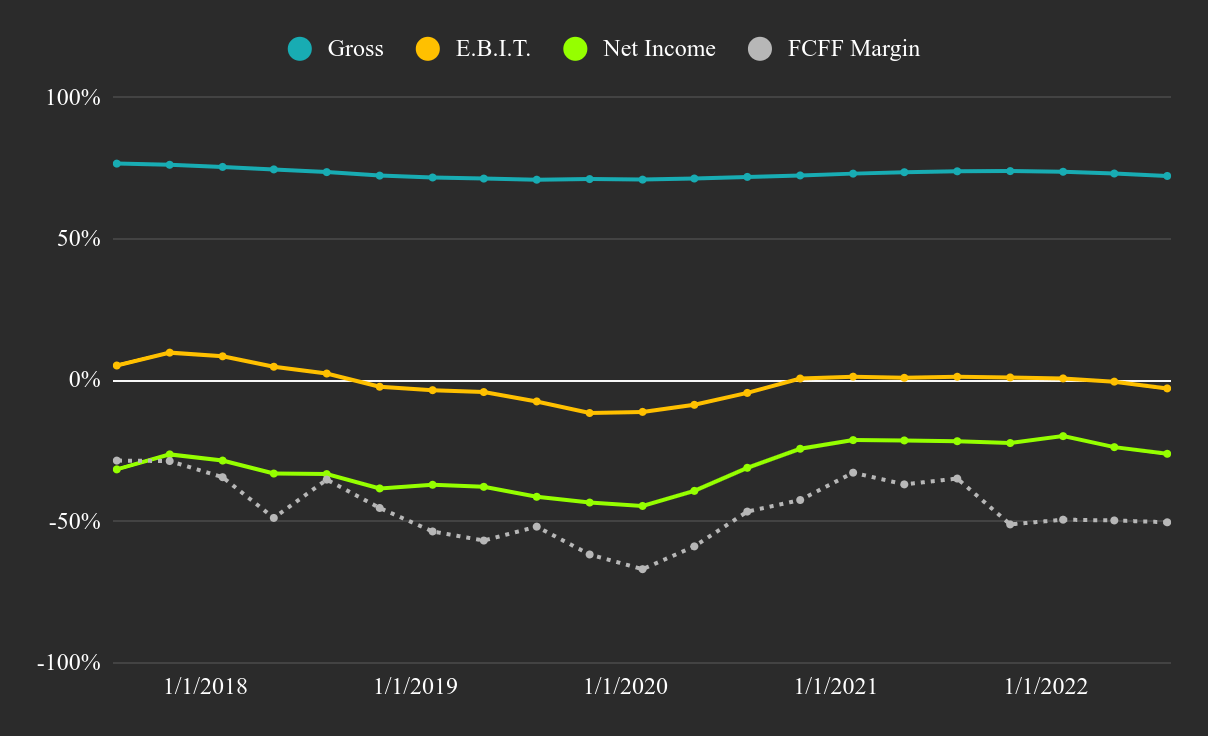
The company is at the beginning of their road to profitability, and that is completely understandable from their current stage. Most of the value is expected to come once the company reaches stable growth around years 9 – 10. This means that investors should be aware that profits won’t and shouldn’t come while the company is growing, and the company should reinvest as efficiently as possible to attain that growth.
How Much Will Elastic Need To Reinvest?
Reinvestment is simply the money spent in long-term growth and capital maintenance. The traditional term for this is CapEx, and software companies have been giving investors the slip when it comes to counting CapEx investments. In the standard sense, CapEx includes property and machinery purchases, however software companies tend to grow via development and acquisitions – which is why we include all of these items under the reinvestment umbrella, as well as when calculating FCFF.
There are two main fronts where Elastic will need to focus: keeping up with technology and scaling up the business. In practical terms, Elastic will need to be on the cutting edge of their tech, build a sales force that will pitch the service to clients that haven’t identified the need yet, and build a management team that can efficiently steer the company into profitability. Mistakes made here will show up after a few years and there are no easy fixes.
This is why we project the company to be unprofitable for the foreseeable future. Within our model, we estimate that the company will need to reinvest some $7.7b across 10 years, at a reinvestment efficacy rate of 107%. This rate is derived from the industry averages and current company performance, which we can see in the chart (sales to capital, right axis):
Chart 6. Elastic’s Top and Bottom Line Return Metrics (Author image using data from ThinkValue)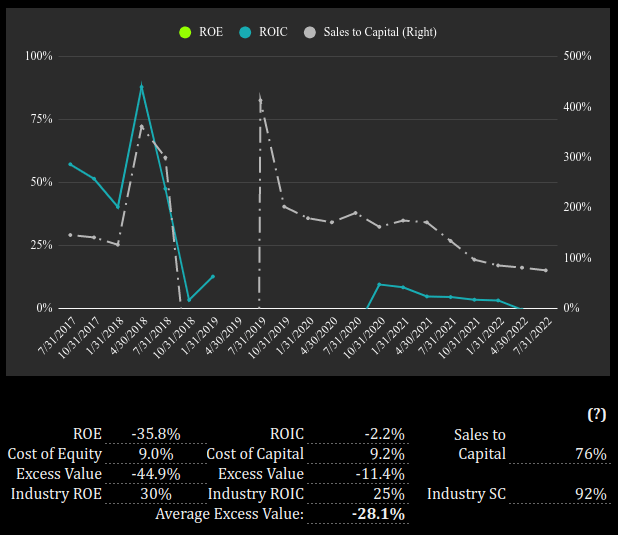
Note, there is no point focusing on the return values at the moment since the company is young, but at the end of the forecast period, we estimate a return on invested capital of 19%.
The Bottom Line
In order for Elastic to justify the current market value, Elastic needs to deliver a 35% revenue CAGR and a 25% EBIT margin at maturity. This seems hardly attainable as the company itself guides to 26% growth in FY2023, historical fundamentals indicate deceleration and the tech along with competitor mix indicate pressure on future margins.
In our view, the company needs to go horizontal and offer additional key services while scaling up – Judging by the mentioned revenue segmentation, this is what they are already doing, but we need to see if they can make the new services stick within their ecosystem.
The reverse DCF indicates that the market may be overly bullish on growth and profitability. Elastic will need to continuously exceed short term estimates in order to justify the expectations of buy-side investors. In other words, this is the kind of stock that can fall on an earnings beat.
The company still has opportunity to develop their adjacent growth prospects which is largely why we are rating it a hold.
Be the first to comment