

Vertigo3d/iStock via Getty Images
Investment Thesis
I am hesitant to subscribe to the pessimism permeating the market lately. Despite this year’s market headwinds, stocks remain one of the most efficient ways to build wealth over the long haul, and now more than ever, I’m finding compelling reasons to consider equities, especially value stocks, to my portfolio as 2022 draws to a close. Unlike some of my peers in the investment industry who seem to be writing off the market altogether, I remain optimistic but also mindful of the delicate economic backdrop that prevails at the moment.
My price projections for the S&P 500 (SP500) in 2023 year-end suggest an annualized return of 5%. The table below summarizes the target trajectory as we head into 2023, showing the index projected EPS and P/E multiples.
2023 Forecast (Author’s estimates, S&P Global, Wall Street consensus EPS estimates.)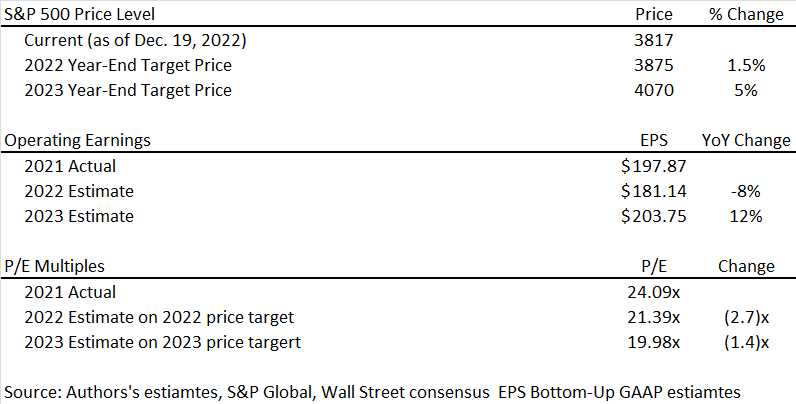
The projections above are grounded in the expectations of growing GAAP revenues, a slight decline in operating margins, and fewer outstanding shares. A second essential presumption is the absence of a downward business cycle. Macroeconomic disruptions will take shape in increased discount rates, exerting pressure on valuation multiples, particularly in the first half of 2023, ending the year at a 20x P/E. With that in mind, let’s take a closer look at some of the key factors behind our estimates and the primary drivers of the index performance.
Revenue vs. GDP
Unless we fall into a deep recession in 2023 (a scenario in which I discuss its prospects in a separate section), I have strong confidence in the EPS estimate above. Corporate revenue is typically reported in terms of current U.S. dollars. There is a strong correlation between nominal GDP and corporate sales, as shown in the graph below, and this relationship is not dependent on the stock market performance or real GDP, for that matter. Although we have experienced numerous market crashes in past decades, from the 2018 Crypto bear market (SP500 down 19.7% from its peak), the 2010 China Crash, and the 2011 European Debt crises to the most recent selloff in 2022, unless a bear market, is accompanied by a recession, corporate America delivers on earnings growth. This is one less variable to worry about as we navigate this market.
Revenue vs. Nominal GDP (FRED, S&P Global, and Author’s estimates)
Nominal GDP (FRED)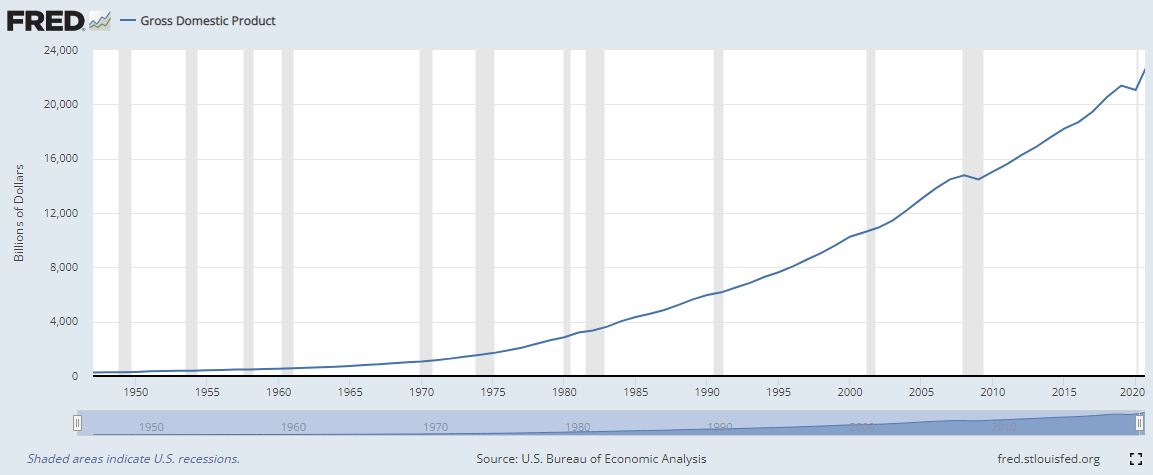
Corporate America’s resilience is mirrored in the recent GDP and sales figures in the first half of 2022. Despite real GDP declining and the stock market crashing, corporate sales per share in almost every industry have increased during the period. The table below shows corporate sales performance by industry in H1 2022, when the U.S. economy experienced negative real GDP growth and a broad market selloff.
| Sales/Share | Q2-22 | Q1-22 | Q2-21 | Q1-21 | H1/H2 % Change |
| Energy | $166.02 | $128.36 | $94.33 | $82.25 | 67% |
| Materials | $73.22 | $66.89 | $61.16 | $53.09 | 23% |
| Industrials | $110.10 | $98.28 | $92.50 | $84.74 | 18% |
| Consumer Disc. | $154.21 | $142.04 | $139.17 | $130.82 | 10% |
| Consumer Staples | $122.18 | $120.02 | $112.98 | $109.15 | 9% |
| Health Care | $218.15 | $213.74 | $198.01 | $187.80 | 12% |
| Financials | $54.56 | $60.18 | $62.98 | $60.54 | -7% |
| Technology | $104.83 | $107.22 | $97.55 | $95.67 | 10% |
| Communication | $17.64 | $17.44 | $17.01 | $16.13 | 6% |
| Utilities | $33.61 | $35.42 | $27.33 | $31.79 | 17% |
| Real Estate | $9.85 | $9.74 | $9.13 | $8.33 | 12% |
| S&P 500 | $431.39 | $413.73 | $384.51 | $364.05 | 13% |
Source: S&P Global
In Q3 2022, real and nominal GDP grew by 2.9% and 6.7%, accompanied by a 13% increase in SP500 sales per share, according to data compiled by SP Global. These are encouraging results that demonstrate the strength of the economy.
Q4 2022 GDP (nominal and real) will likely be softer as consumers pay more to heat their houses this winter, with fuel prices above last year’s averages. Businesses are also starting to feel the consumers’ pain, as mirrored by leading indicators such as PMIs. For this reason, I expect nominal GDP growth of 4% in Q4, compared to 6.7% in Q4.
*Flash PMI (S&P Global) *Flash PMI (S&P Global FF)

Based on the data we have for the three months ended September 2022 and the Q4 estimates above, FY 2022 Sales per share for the SP500 index for this year will be about $1732 per share, up 10.5% from FY 2021.
In 2023, we expect a more modest increase in revenue per share, estimated at a 7.5% increase bringing 2023 annual Sales per share to $1862, fueled by a 1.5% decrease in share count and 6% in sales. Our 2023 EPS implies a 10.9% margin, down from the 13.3% average in 2021 and the YTD average for 2022 of %11.36.
Companies laying off workers? So what?
I don’t see the economy falling into recession in 2023 for the following reasons. First, the jobs market is tight, and the Fed’s actions are, more than anything else, pushing the market to optimize capital allocation, including human capital. For example, these tech professionals made redundant by Meta Platforms (META) and Microsoft (MSFT) and others last month are being scooped by hospitals, community banks, factories, and even the Federal government, all desperate for talent to increase production, contributing to solving the supply constrain issues that led to this economic mess in the first place. Beside well-established companies such as META and MSFT, “growth-at-all-cost” companies are reassessing their business models after equity funding became expensive. For example, molecular diagnostic companies are laying off thousands of workers, including Invitae (NVTA), Sema4 (SMFR), and 10x Genomics (TXG). These redundant professionals quickly find work in pathology labs, hospitals, medical clinics, and even health insurance companies desperate to enhance service and lower turnaround times. At this point, rising capital costs will paradoxically increase productivity by shifting labor where it is most needed. This will ultimately contribute to healthier supply chains, increased outputs, and lower prices.
Labor Participation Rate (US Bureau of Labor Statistics)
Savings at multi-year low? So What?
Second, those sounding the alarm over consumer savings are misguided. Checkable deposits are at an all-time high. One reason could be retail investors exiting the market, boosting their checkable deposit balances. This robust balance is enough to carry consumers through current market disruptions, including high living costs and potential labor market softening in the coming quarters, bolstering our confidence that there will be no economic recession in 2023
Checkable Deposits and Currency Assets (FRED)
How I might Be Wrong
Economists believe that there is often a lag between monetary tightening and economic impact. If this is true, the worst of the Fed tightening is yet to come. We see many “growth companies” with no cash flows and no short or medium-term prospects still holding some dry powder, artificially boosting the economy, fueled by the money they accumulated during the era of free money. With equity funding now shut for these companies, they will likely wither away. We assume that this transition will be gradual. However, this might not be the case, and an economic crash is on the table. Second, our assumption also rests on lower total shares outstanding, impacting the Divisor used to calculate the SP500 level and its EPS and Sales per share figures. With the new share repurchase tax taking effect on January 2023, we could see fewer share buybacks from the index constituents. Moreover, during economic hardships, the S&P 500 companies historically raised cash and bought fewer shares to enhance their balance sheets. These factors could have a detrimental impact on our EPS, Revenue per share assumptions.
S&P 500 Total Shares Outstanding ((Yardeni))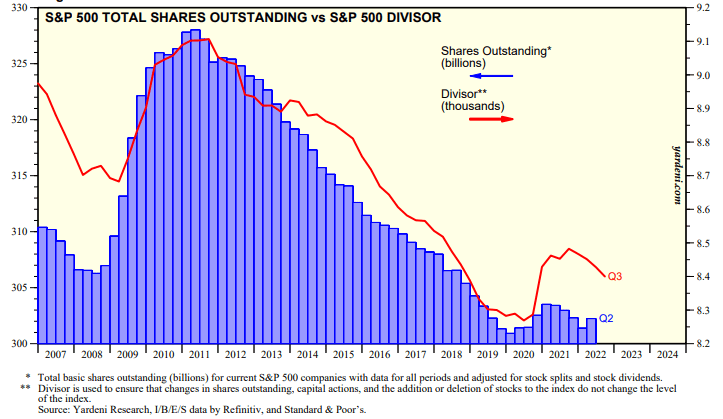
Finally, there are many statistical signs of a recession looming. Every economic recession in the past has been preceded by either monetary tightening, fuel shock, or an inverted yield curve. At the time of this writing, we have all three. Thus, from a statistical perspective, there is an argument for a recession.
Summary
Economic activity declined in the nine months that ended September, and according to Q4 forecasts, the economy will end the year with lower real GDP. The question is, how does that impact corporate revenue and EPS figures underlying valuation multiples? Well, these numbers are reported in current U.S. dollars, and historically, they are more correlated with Nominal GDP, which has been rising. We expect a continued rise in nominal GDP, underpinning our revenue and EPS estimates for 2023.
The Fed’s monetary tightening is, more than anything else, driving the market into higher productivity, which would ultimately lower inflation without sacrificing economic activity. Companies are optimizing their capital, including human capital, and redundant workers quickly find jobs where they are most needed. The recent layoffs in the tech industry are good news for the hundreds of businesses in desperate need of IT professionals to increase automation and productivity. The same goes for the layoffs in the Molecular diagnostic industry, with redundant biologists quickly finding employment in pathology labs, hospitals, and other healthcare provider networks, helping decrease turnaround times and the pressure on the healthcare system. These dynamics will ultimately lower the price of goods and services in the economy.
Another line of defense against a recession is consumer savings. Loose monetary policy in the past years allowed households to amass unprecedented wealth. This, combined with what I believe is a broad exiting of the market by retail investors, has increased cash in checkable accounts to unprecedented levels. This creates a comfortable buffer for the Fed as it navigates the economy.
- Editor’s Note: This article was submitted as part of Seeking Alpha’s 2023 Market Prediction contest. Do you have a conviction view for the S&P 500 next year? If so, click here to find out more and submit your article today!
Be the first to comment