

USD/JPY Analysis:
- USD/JPY continues upward trajectory but signs of fatigue are appearing
- Publicly traded Bank of Japan sees largest share price surge since 2005
- IG Client Sentiment supports the bullish run despite traders remaining slightly net-long
BoJ Surging Share Price and Positive Japanese Unemployment Data
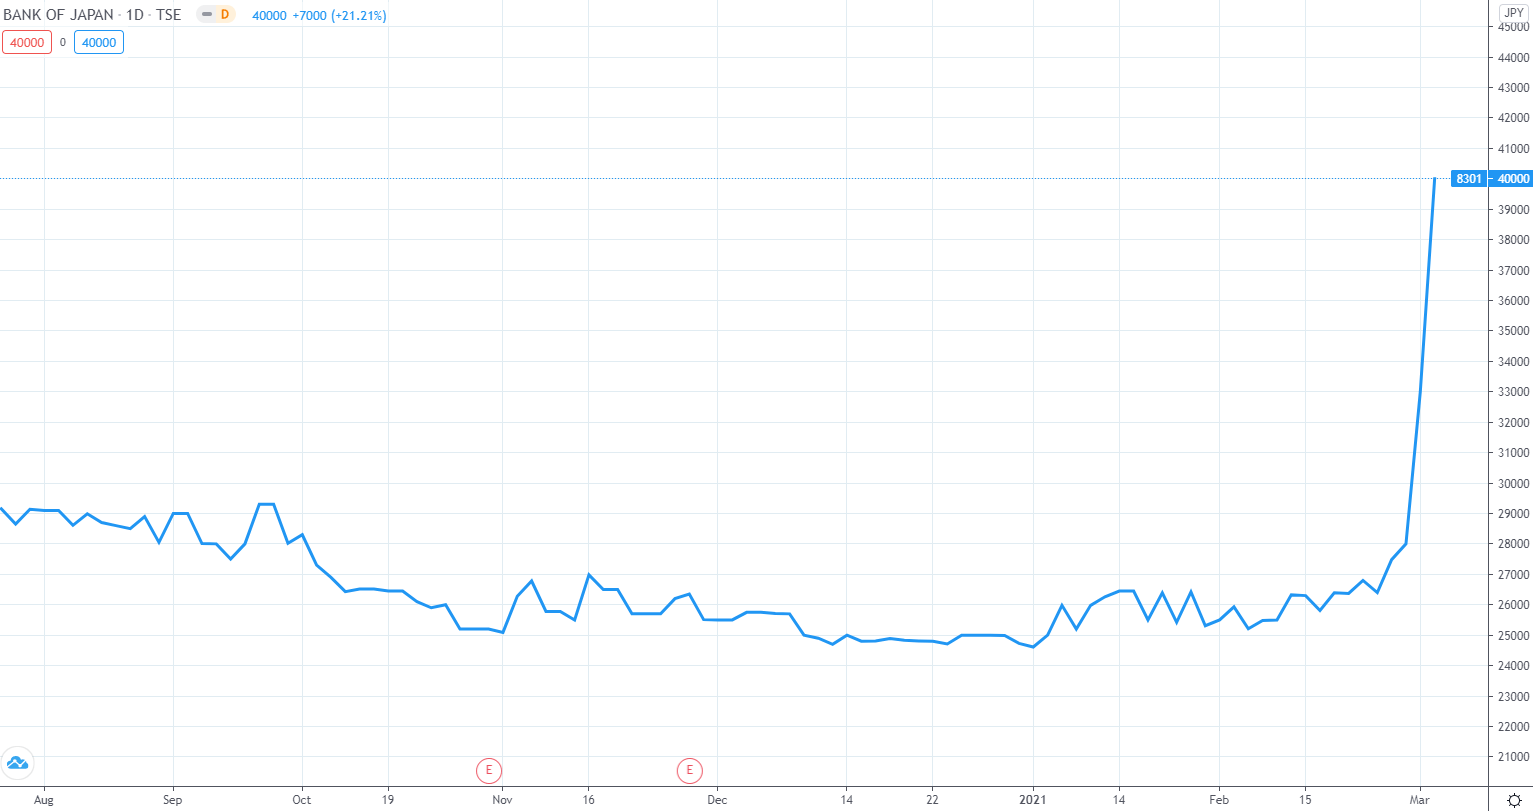
The Bank of Japan, which is one of only a few central banks that are publicly traded, experienced a massive 18% rise on Monday and at the time of writing has posted a 21.21% increase for Tuesday. Outside of the recent retail driven price spikes this would seem extremely unusual as the share offers very little fundamentally to warrant such a sudden increase. Nevertheless, this may be viewed positively for the Japanese Yen as the central bank continues efforts to stimulate the local economy.
Bank of Japan Share Price
Source: Tradingview
Boost your stock market knowledge with our articles on the types of stocks available, how equities impact the economy, and getting started with stock trading – Stock Market Education section
Earlier today, Japanese unemployment data came out at 2.9%, beating expectations of 3% which bodes well for the local labor market. Notable risk events for the rest of the week include a number of speeches from Fed officials, US jobless claims and finally non-farm payrolls on Friday.
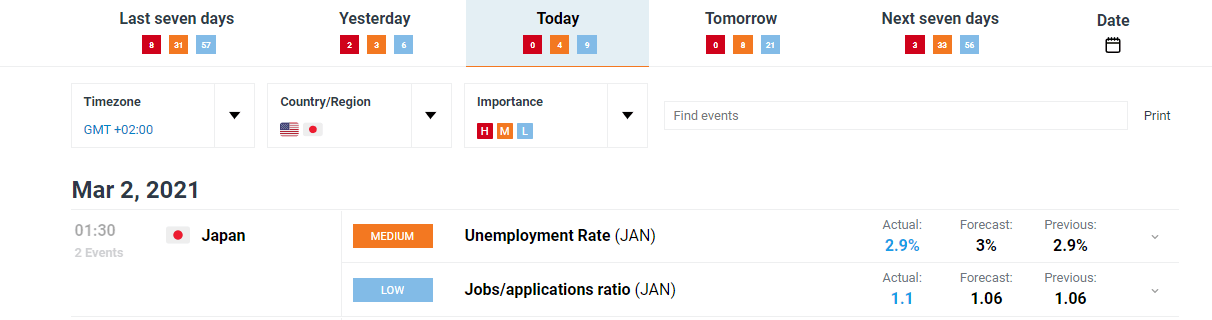
For all market-moving data releases and events see the DailyFX Economic Calendar
USD/JPY Key Technical Levels
The current state of the USD/JPY pair is something to behold for technical analysis enthusiasts. After trading below the long-term descending trendline for H2 2020, frequently testing the trendline throughout, the pair reversed sharply and now trades within a rising channel.
USD/JPY has continued to oscillate between the upper and lower bounds of the bullish pattern and now approaches the upper bound, which acts as resistance. This area however, may pose a challenge to bulls as it falls within a crucial zone of resistance. The resistance zone comprises of the proximity of price to the resistance trendline, the 107.00 psychological number as well as acting as a previous level of support throughout August 2020.
A break above the zone of resistance would bring 107.50 and 107.80 into focus as the nearest levels of resistance with the July 2020 high still some distance away for now. However, the appearance of negative divergence on the RSI suggests the possibility of a return to the lower bound of the channel/support.
A move lower would see 106.20 and 105.80 as the nearest levels of support. Bulls may anticipate a retracement down to the 105.80 level and possible bounce off of support (red rectangle) if the market is set to continue trading within the rising channel.
USD/JPY Daily Chart
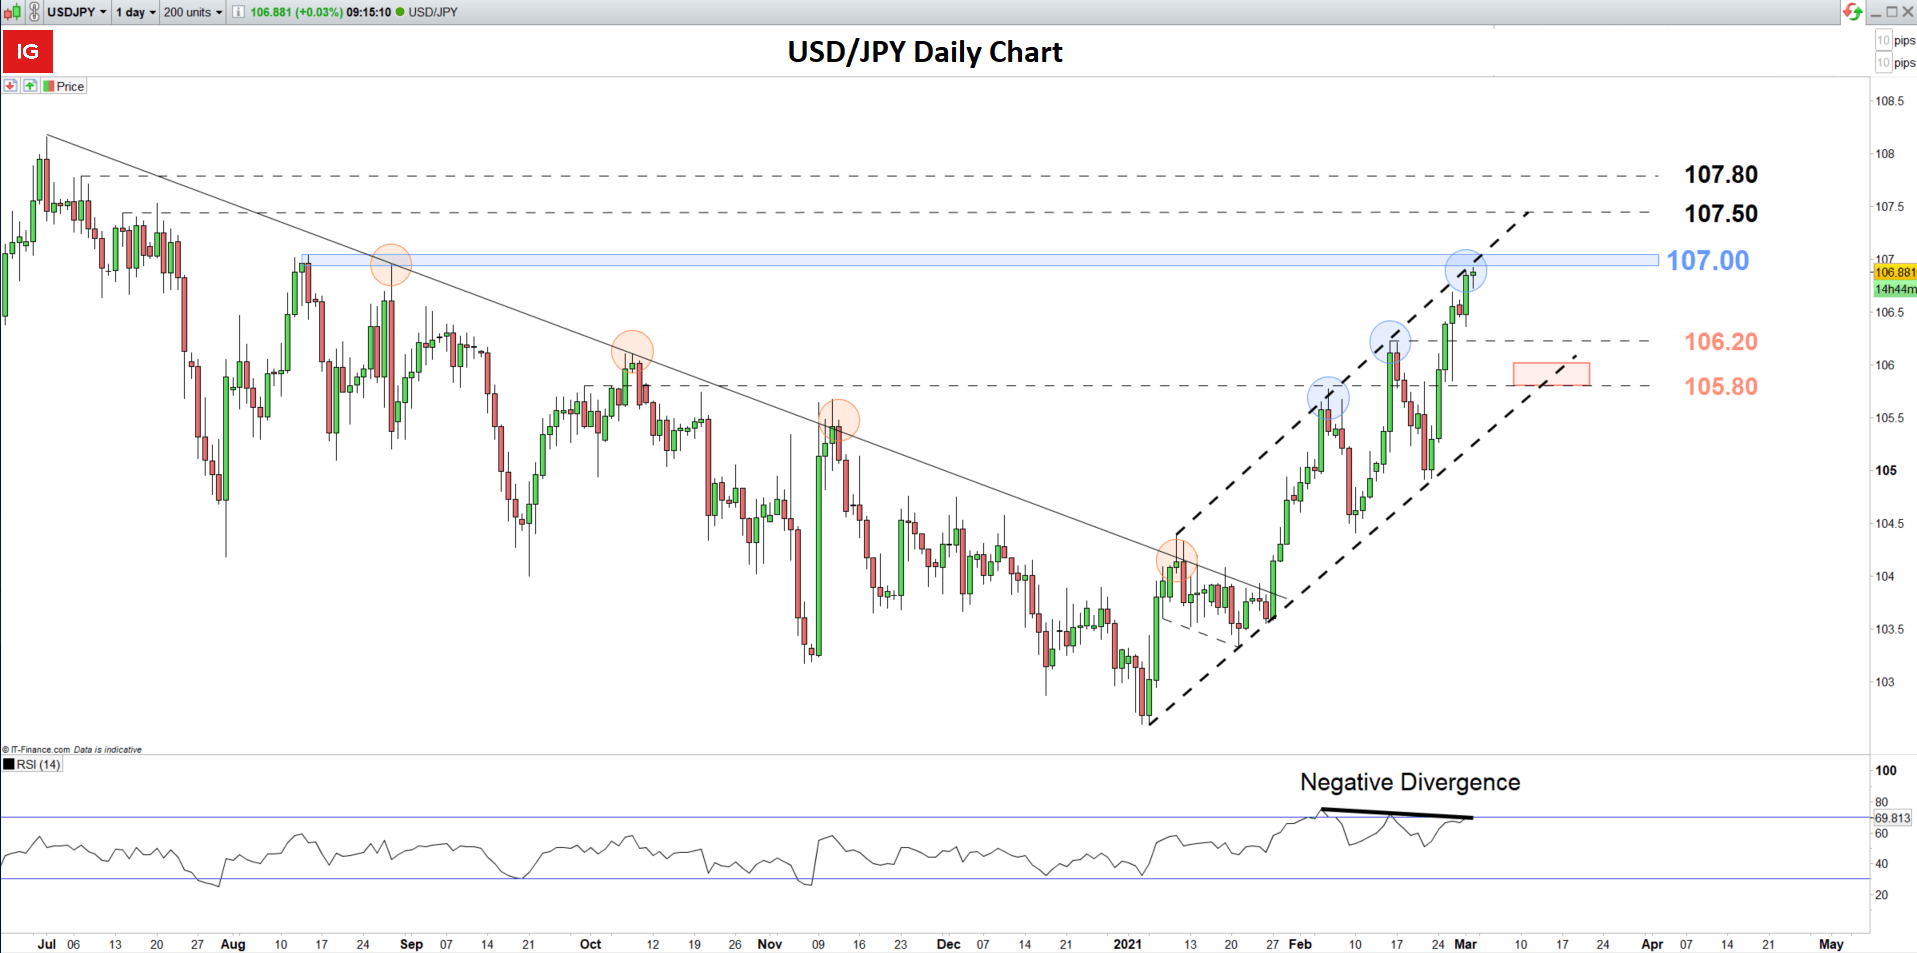
Chart prepared by Richard Snow, IG
The 4-hour chart provides a more granular look at what is unfolding on the daily chart and once more highlights the appearance of the negative divergence, witnessed by the higher highs in price (blue circles) while the RSI produces lower highs.
USD/JPY 4-Hour Chart
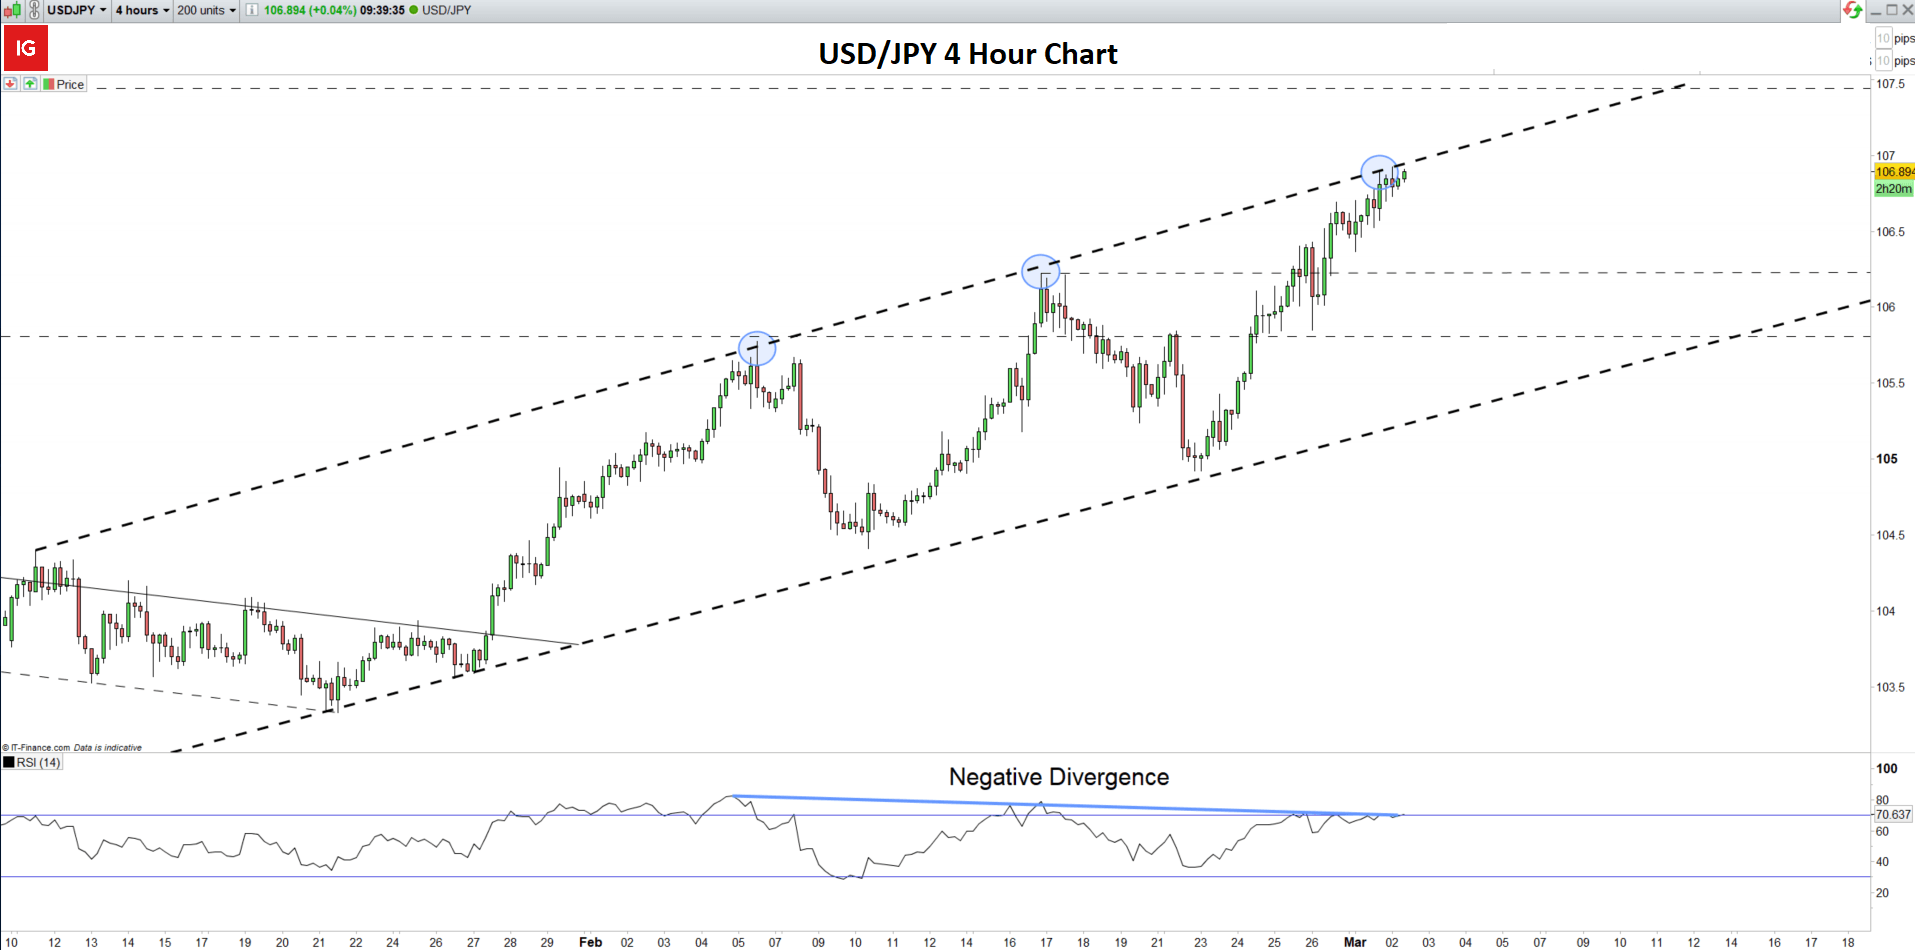
Chart prepared by Richard Snow, IG

Recommended by Richard Snow
See what our analysts forecast for the Yen this quarter
Client Sentiment Hints at Bullish Continuation Despite 51% Net-Long Reading

Recommended by Richard Snow
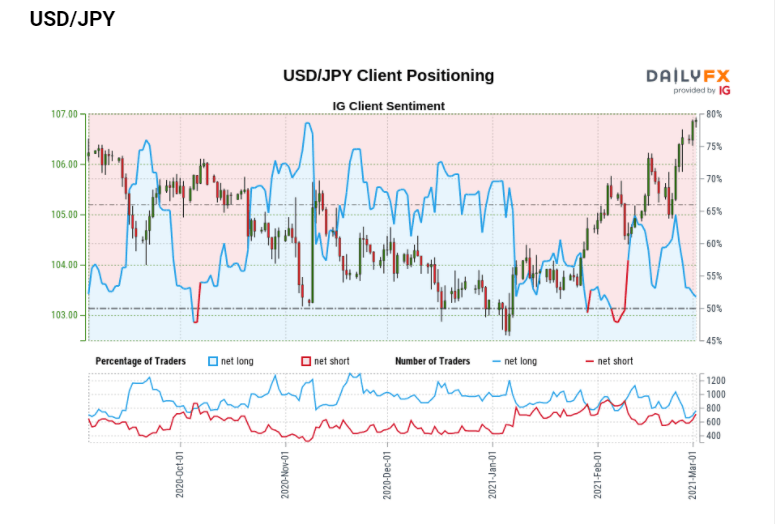
- USD/JPY: Retail trader data shows 51.15% of traders are net-long with the ratio of traders long to short at 1.05 to 1.
- We typically take a contrarian view to crowd sentiment but sentiment is not skewed drastically in either direction and is very close to a 50/50 split. Therefore, it may not be prudent to apply the usual contrarian approach to this market in its current state
| Change in | Longs | Shorts | OI |
| Daily | -7% | 21% | 6% |
| Weekly | -27% | 48% | 1% |
- The number of traders net-long is 9.10% higher than yesterday and 27.53% lower from last week, while the number of traders net-short is 9.73% higher than yesterday and 21.77% higher from last week.
- Yet traders are less net-long than yesterday and compared with last week. Recent changes in sentiment (increases in net-short positioning) warn that the current USD/JPY price trend may continue despite the fact traders remain net-long.
— Written by Richard Snow for DailyFX.com
Contact and follow Richard on Twitter: @RichardSnowFX
Be the first to comment