

georgeclerk
Timber real estate investment trusts (“REITs”) have slightly outperformed the REIT average thus far this year. According to Hoya Capital Income Builder, Timber REITs have returned (-9.91)% thus far in 2022, compared to (-13.80)% for Equity REITs as a whole. Timber REITs have so far posted the ninth-best performance of the 19 REIT sectors.
Hoya Capital Income Builder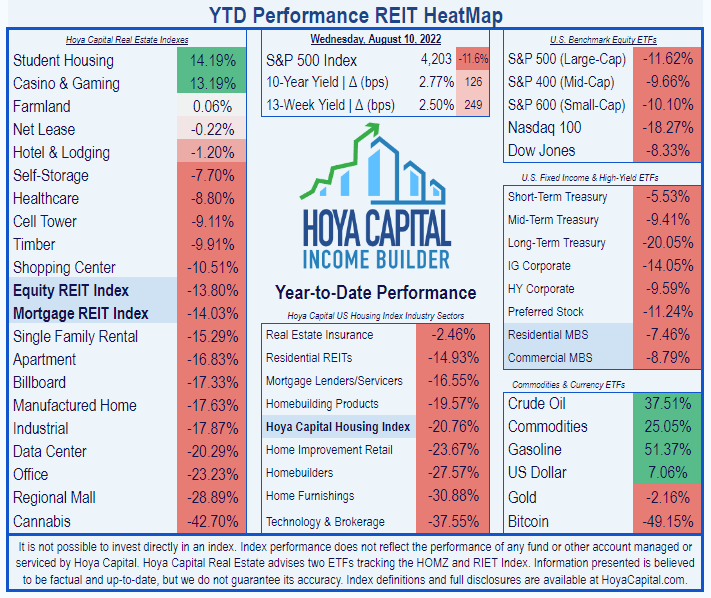
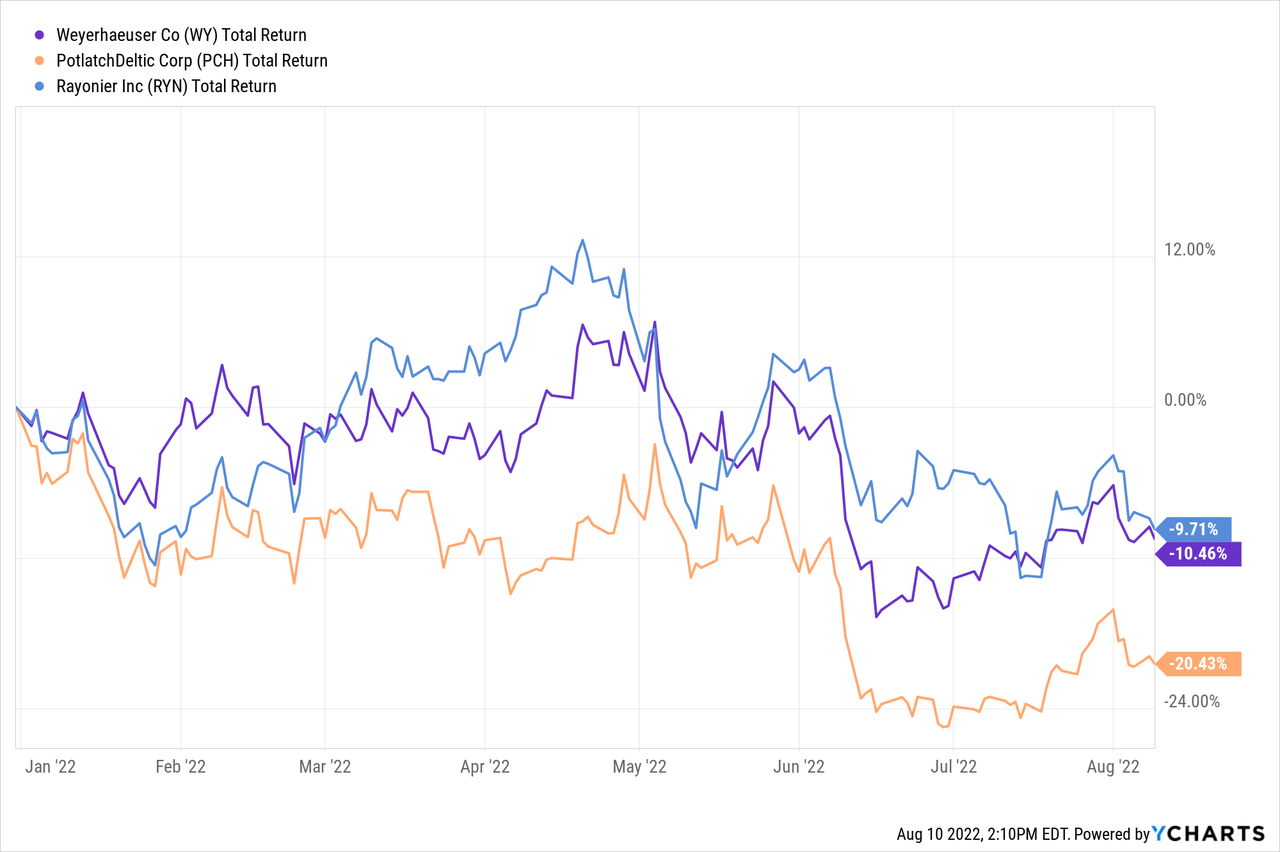
As you can see from the chart below, Weyerhaeuser Company (NYSE:WY) trails the Timber REIT sector average by just a hair, at (-10.46)%, and much-smaller competitor Rayonier (RYN), which has returned (-9.71)%, but both are significantly outperforming mid-cap competitor Potlatch Deltic (PCH). Tiny CatchMark Timber (CTT) is so small I chose not to include it in the chart.
Lumber prices have fallen for the past 5 months, thanks to two factors:
- Very high lumber prices earlier this year sidelined a lot of home builders, and
- Rising interest rates led to a cooling of housing demand.
Lumber prices reached a low around $470 per board foot in early August.
However, lumber prices spiked 18% earlier this week, to $565 per board foot, and lumber futures rose later in the week, as a top Canadian producer cut supply. Still, lumber sells for less than half its peak selling price in March, when it was above $1400.
Lumber Prices TTM (tradingeconomics.com)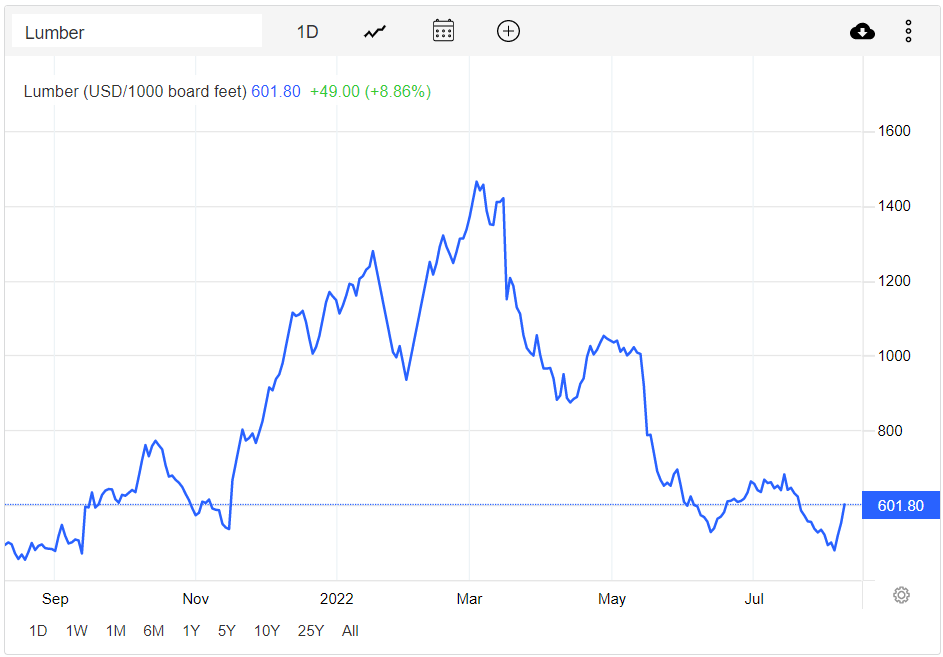
Some analysts expect lumber prices to settle back to pre-pandemic levels by the end of 2023, however, which spells trouble for Timber REITs. As the chart below shows, for the three years prior to the COVID outbreak, lumber prices hovered between $250 and $500 per board foot, with only an occasional spike to around $600.
5 Year Lumber Price Chart (tradingeconomics.com)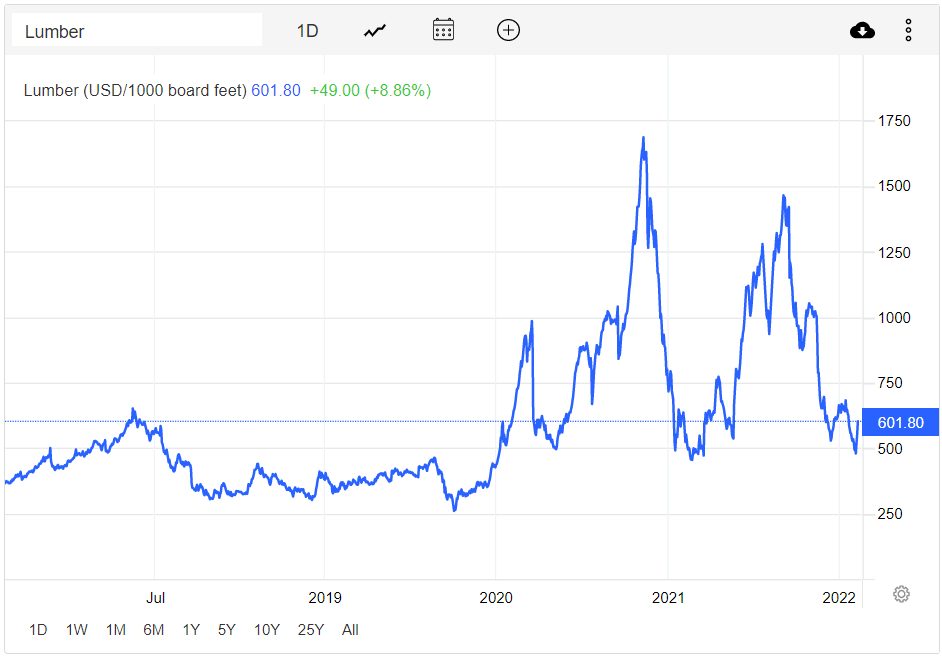
In the midst of this volatility, this article examines growth, balance sheet, dividend, and valuation metrics for woodland behemoth Weyerhaeuser.
Meet the company
Weyerhaeuser
Weyerhaeuser (WY) is by far the largest and most well-rounded of the Timber REITs, and makes up 75% of the Timber REIT sector all by itself, with a market cap of $26.7 billion.
One of the earliest pioneers of sustainable forestry, WY owns more than 11 million acres of timberlands in the United States, primarily in the West (2.6 million acres in Oregon and Washington), the South (6.9 million acres, stretching from Virginia to Texas), and the Northeast (1.2 million acres). WY also collaboratively manages 14 million more acres of publicly owned land in Canada (in British Columbia, Alberta, Saskatchewan, and Ontario) under long-term licenses.
Geographic Distribution of WY Assets (Company investor presentation)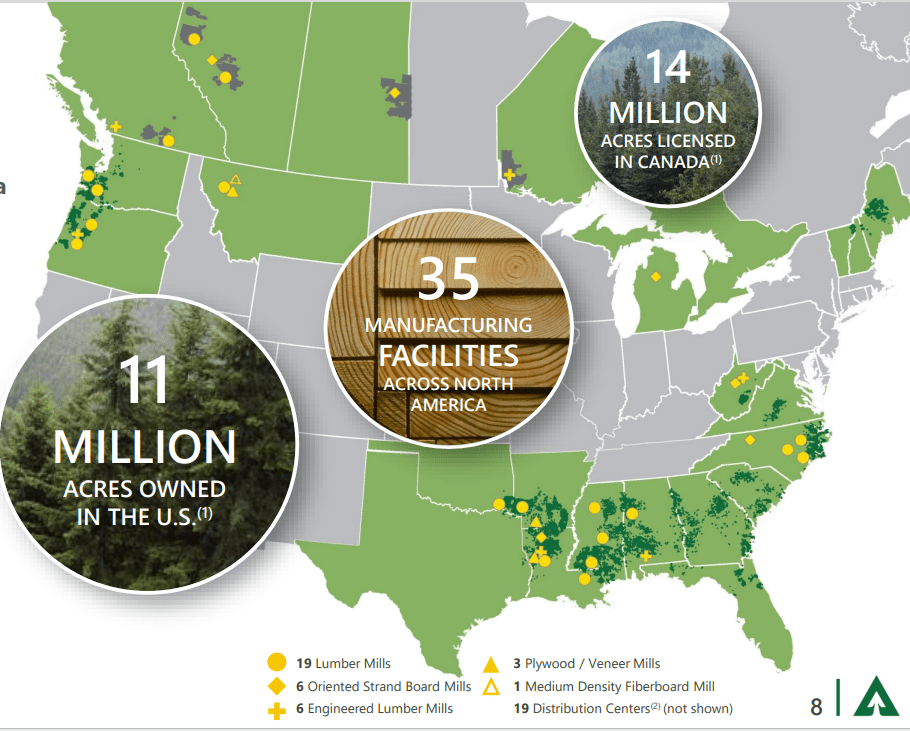
WY operates through 3 divisions, which they call “segments”:
- Wood Products (by far the largest with $863 million in EBITDA in Q2 2022), which takes the raw lumber and turns it into engineered lumber, OSB (oriented strand board), plywood, and MDF (medium density fiberboard) panels, and provides distribution to building and supply dealers in homebuilding and remodeling markets.
- Timberlands ($219 million Q2 EBITDA), which grows trees in the U.S. and Canada, and sells logs and seedlings to third-party domestic customers, Weyerhaeuser mills, and export customers (mostly in Japan).
- Real Estate, Energy, and Natural Resources ($107 million Q2 EBITDA), which invests in land for its resale value and seeks highest and best use, plus invests in renewable energy, including wind and solar, natural gas, and carbon capture. The company expects to see rapid growth in this smallest segment, reaching $300 million in EBITDA this year.
Most lumber demand is for use in new residential construction (34%) and repair and remodeling (39%), with 22% for industrial use.
Company investor presentation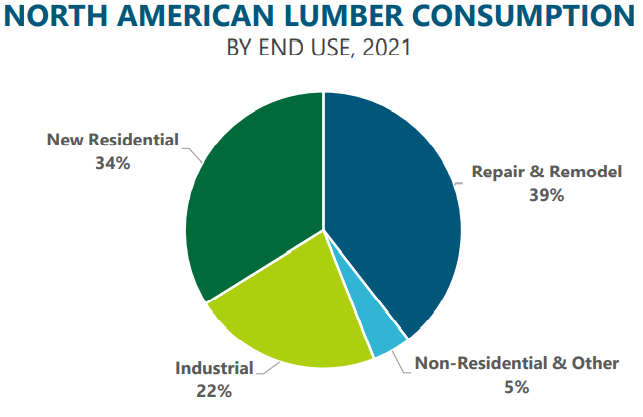
Thus, new housing starts are one key to WY’s income, and those have continued growing at a healthy clip, as shown in the chart below.
Company investor presentation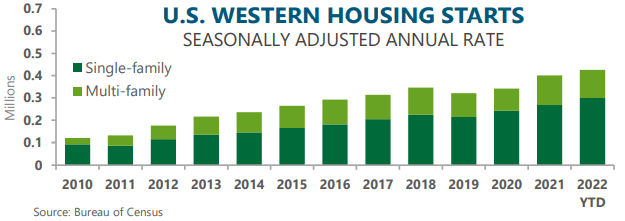
The thing that sets Weyerhaeuser apart is its long and consistent history of sustainable forestry. This company is a leader in combatting global warming, making the world safer for both ourselves and our children. WY is now pioneering the profitable removal and storage of carbon from the atmosphere, removing nearly 5 times more carbon than it emits.
Company investor presentation
Though an old-school company, WY is tapping into the power of integrated data platforms with a system they call OPX 2.0, aiming to capitalize on opportunities that generate longer-term value, avoid cost increases, produce workflow efficiency, and synergize operations across segments. The company hopes to realize $175 – $200 million of operating expense margin improvements over the next 3 years, using this platform.
Quarterly results
Weyerhaeuser reported Q2 2022 results on July 29. Here are the highlights:
- Net sales of $2.97 billion, down 5.4% YoY (year over year), and down 4.5% from Q1.
- G&A expense $102 million, up 7.4% YoY and up 10.9% from Q1.
- NOI (net operating income) of $1.05 billion, down 26.7% YoY and down 22.1% from Q1.
- Adjusted EBITDA of $1.205 billion, down 23.4% YoY and down 19.5% from Q1.
- Earnings per share of $1.06, up 2.9% from Q1, but down 22.6% YoY.
- 3.7 million shares bought back.
- Net cash from operations of $1.15 billion, down 12.4% YoY, but up 19.7% from Q1.
Compared to the first half of 2021,
- Net sales are up 7.7% at $6.09 billion.
- Gross margin, operating income, and adjust EBITDA are essentially flat.
- Net earnings are down 8.8% at $1.56 billion.
- Earnings per share are down 8.3%, at $2.09.
- Net cash from operations is up 4.8%, at $2.10 billion.
Here is what the picture looks like, segment by segment:
| Segment | Q2 2022 | Q2 YoY | vs Q1 | H1 2022 | H1 YoY |
| Wood Products | |||||
| Net Operating Income | $863 M | (-36)% | (-27)% | $2045 M | (-6)% |
| Adjusted EBITDA | $912 M | (-34)% | (-26)% | $2145 M | (-6)% |
| Timberlands | |||||
| Net Operating Income | $153 M | +35% | (-16)% | $335 M | +52% |
| Adjusted EBITDA | $219 M | +22% | (-11)% | $466 | +32% |
| Real Estate & ENR | |||||
| Net Operating Income | $65 M | +3% | (-20)% | $146 M | +13% |
| Adjusted EBITDA | $107 M | +18% | (-8)% | $223 M | +19% |
Source: Company 10-Q for Q2 2022
The Wood Products segment, which is the company’s largest, accounting for 72% of EBITDA, was hit hardest, falling badly year-over-year and quarter-over-quarter, in both NOI and Adjusted EBITDA. This is partly because Q2 2021 was a blow-out quarter. Comparables were tough.
Adjusted EBITDA for Wood Products Segment (Company investor presentation)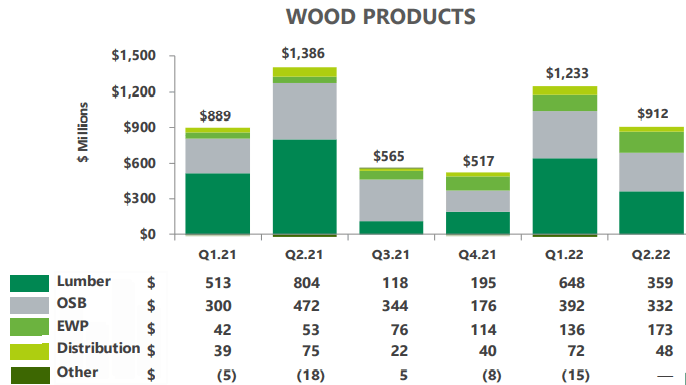
The numbers clearly point to sales realizations as the area of greatest drop-off, driven by the decline in lumber prices.
Company investor presentation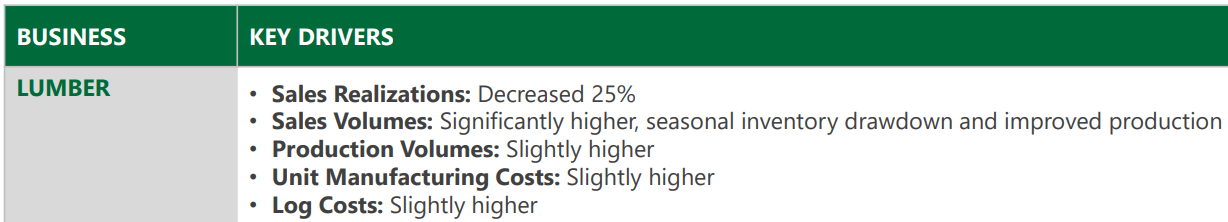
Company investor presentation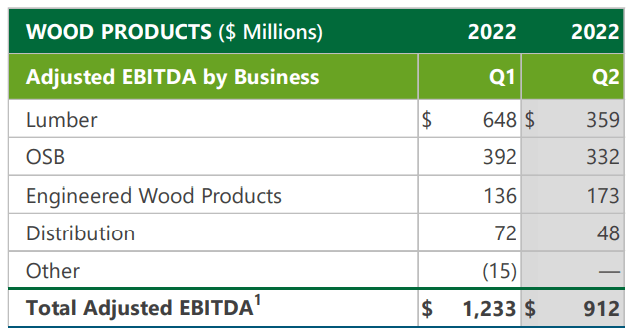
A drop of just $10/mbf translates to about $50 million of EBITDA in lumber alone, and another $30 million in OSB.
Company investor presentation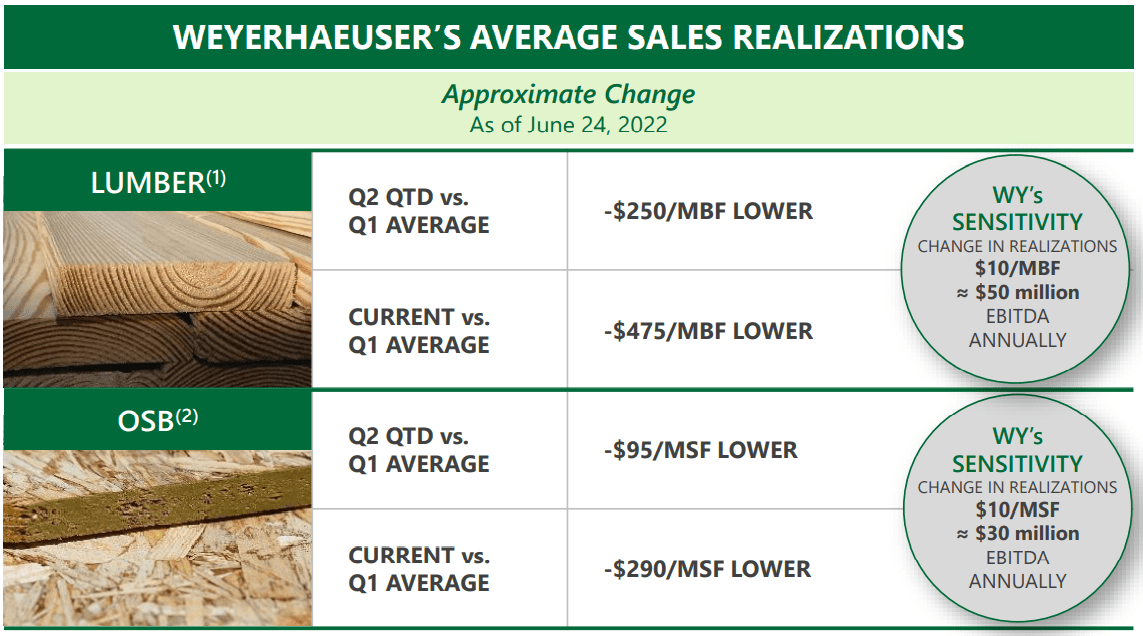
The other two segments were down from the first quarter of 2022, but up by double digits year-over-year. However, since those two smaller segments combine for only 27% of EBITDA, their YoY performance was not able to make up for the decline in Wood Products.
Adjusted EBITDA for Timberlands Segment (Company investor presentation)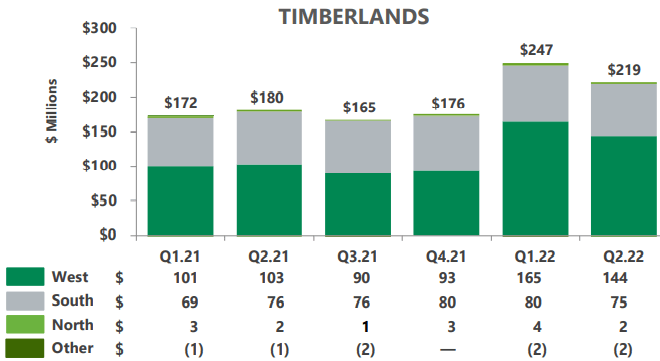
Adjusted EBITDA for Real Estate and ENR Segment (Company investor presentation)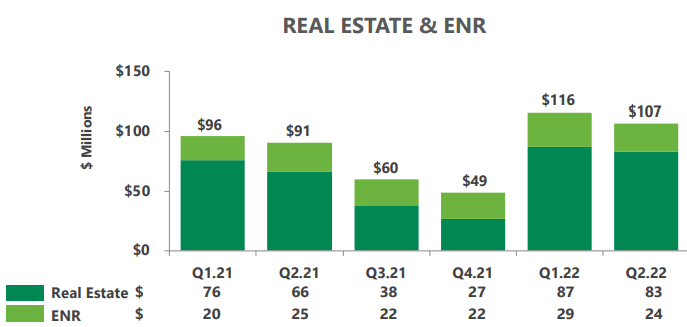
The company is expecting Wood Products to perform about the same in Q3 as in Q2, while the Timberlands and Real Estate segments decline.
Company investor presentation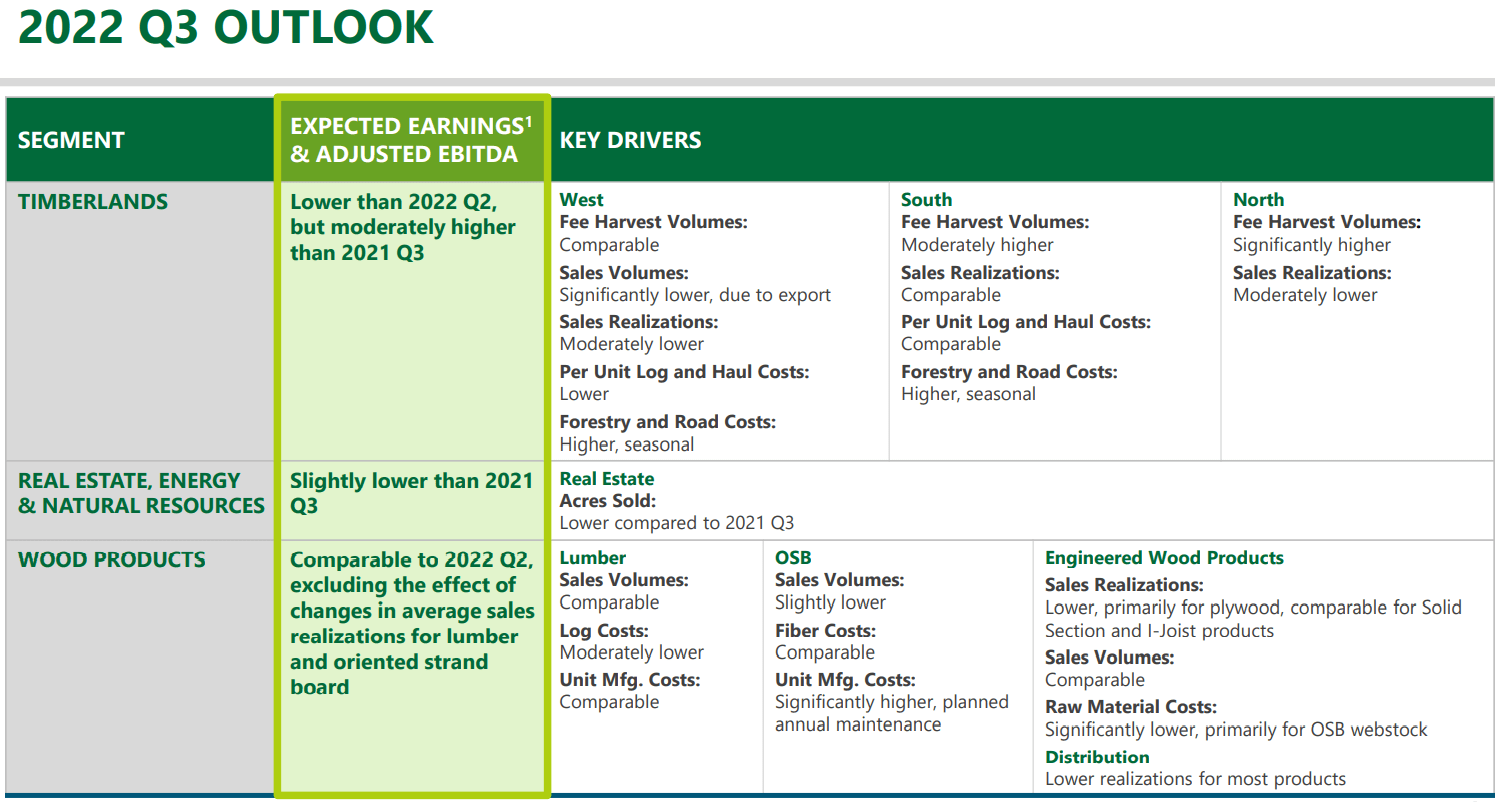
Growth metrics
Here are the 3-year growth figures for NOI (net operating income), TCFO (total cash from operations), and EPS (earnings per share). Weyerhaeuser, like other Timber REITs, does not report FFO.
| Metric | 2019 | 2020 | 2021 | 2022* |
| NOI (millions) | $184 | $1549 | $3643 | $4782 |
| NOI Growth % | — | 742.5 | 135.2 | 31.3 |
| EPS | $(-0.10) | $1.07 | $3.47 | $4.18 |
| EPS growth % | — | NA | 224.3 | 20.5 |
| TCFO (millions) | $966 | $1529 | $3159 | $4200 |
| TCFO Growth % | — | 58.3 | 106.6 | 33.0 |
*Estimated, based on H1 2022 results
Source: TD Ameritrade, CompaniesMarketCap.com, and author calculations.
The growth rates shown above may be a bit misleading, since 2019 was a particularly bad year, so the comparables are pretty easy. Still, unless my projections are badly off the mark, the company will probably post double-digit gains in all three categories this year, despite the disappointing Q2 results.
Meanwhile, here is how the stock price has done over the past 3 twelve-month periods, compared to the REIT average as represented by the Vanguard Real Estate ETF (VNQ).
| Metric | 2019 | 2020 | 2021 | 2022 | 3-yr CAGR |
| WY share price Aug. 10 | $24.74 | $28.81 | $34.61 | $36.08 | — |
| WY share price Gain % | — | 16.5 | 20.1 | 4.2 | 13.40% |
| VNQ share price Aug. 10 | $90.85 | $82.52 | $105.33 | $100.24 | — |
| VNQ share price Gain % | — | (-9.2) | 27.6 | (-4.8) | 3.33% |
Source: MarketWatch.com and author calculations
WY flourished during the pandemic, but lagged a little in red-hot 2021. Still, over the past 3 years, WY has paid its investors a VNQ-spanking 13.40% annual share price gain.
Balance sheet metrics
Weyerhaeuser has an exceptional balance sheet, bond rated, with steely liquidity, and extremely low debt relative to assets and earnings.
| Company | Liquidity Ratio | Debt Ratio | Debt/EBITDA | Bond Rating |
| WY | 2.49 | 15% | 0.8 | BBB |
Source: Hoya Capital Income Builder, TD Ameritrade, and author calculations
WY had $1.73 billion in cash and equivalents as of June 30, against $5.05 billion in debt. Though it faces no debt maturities this year or in 2024, in 2023 maturities spike to a massive $978 million. A little refinancing may be in order, but it’s nothing this massive EBITDA machine can’t handle.
WY Debt Maturity Schedule (Company investor presentation)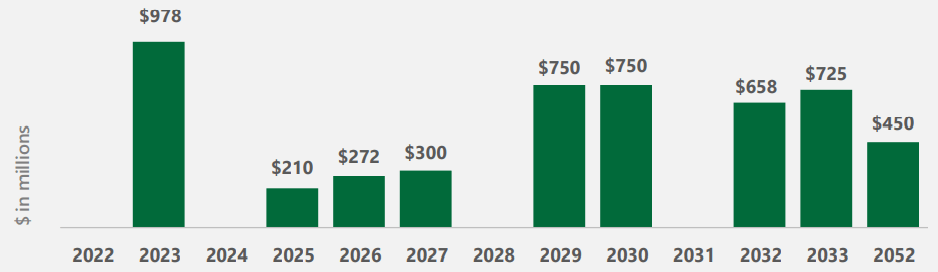
Dividend metrics
Weyerhaeuser is generally a low-yielding investment, like all Timber REITs, but paid a special dividend of $1.45 per share in February and another of $0.50 last October. Thus, the actual Yield investors experienced over the past 12 months was a tasty 7.4%. It was the first time since 2010 that the company has paid special dividends.
WY suspended its dividend for the second and third quarters of 2020, due to COVID. Weyerhaeuser targets 5% annual dividend growth, but has lagged that standard over the past three years.
| Company | Div. Yield | 3-yr Div. Growth | Div. Score | Payout | Div. Safety |
| WY | 2.00% | 2.8% | 2.17 | 20% | A+ |
Source: Hoya Capital Income Builder, TD Ameritrade, Seeking Alpha Premium
Dividend Score projects the Yield three years from now, on shares bought today, assuming the Dividend Growth rate remains unchanged.
The way I see it, the Dividend Safety score of A+ is a badge of shame. It means the company could be taking considerably more risk, in order to put money in investors’ pockets, as opposed to keeping the money for further investment and capex needs (which admittedly are high for this company). WY management expects capex to run $440 million this year, unchanged from 2021.
By contrast, the ideal Dividend Safety Score is C-, or even D+, as far as I’m concerned.
Too Safe Safe Ideal Too Risky
| A+ | A | A- | B+ | B | B- | C+ | C | C- | D+ | D | D- | F |
Valuation metrics
WY is selling at a ridiculously cheap 9.0x FFO, and a 14.1% discount to NAV, so supposedly, it is a bargain. However, due to its low dividend, WY is a growth play, and when it comes to total return, cheap REITs tend to stay cheap.
| Company | Div. Score | Price/FFO ’22 | Premium to NAV |
| WY | 2.17 | 9.0 | (-14.1) |
Source: Hoya Capital Income Builder, TD Ameritrade, and author calculations
What could go wrong?
Extreme weather, especially forest fires, pose a constant threat to the company’s inventory.
Continued declines in lumber prices will likely have a serious effect on sales revenue.
Investor’s bottom line
Weyerhaeuser is a big, stable, financially sound powerhouse, and a poster child for environmental responsibility. Its stability makes great ballast for the long-term investor, and is a solid Hold in that respect. However, if your investing horizon is 2 years or less, it might be a good idea to trim your position (not liquidate), in hopes of buying back in at lower prices a year or two down the road. That is because the company expects Q3 to be worse than Q2 (which was disappointing to begin with), and because lumber prices are expected to continue sinking back to the old normal. I rate this great company a mild Sell.
This puts me out of step with Wall Street analysts and the Seeking Alpha Quant ratings, which both say Buy. The average analyst price target for WY is $41.40, implying just 14.7% upside on a 2% yield. I think there are lots of investments that can do better.
Seeking Alpha Premium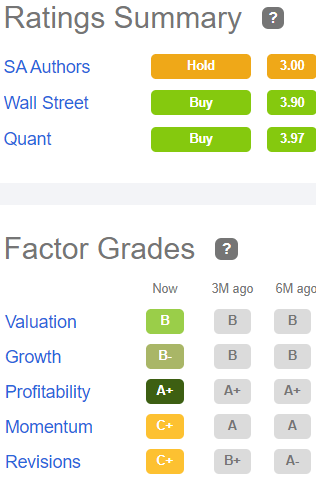
The Street has a Buy on WY, but TipRanks and Ford Equity Research recommend a Hold. Only Zacks agrees with me that it is time to Sell some shares. Your move.
Be the first to comment