


courtneyk
Earnings of Western Alliance Bancorporation (NYSE:WAL) will most probably continue to surge in the next few quarters due to remarkable loan growth. Further, slight margin expansion will support revenues. On the other hand, higher provisioning will restrict earnings growth. Overall, I am expecting Western Alliance Bancorporation to report earnings of $10.0 per share for 2022, up 15% year-over-year. Compared to my last report on the company, I haven’t changed my earnings estimate much. For 2023, I’m expecting earnings to grow by a further 17% to $11.7 per share. The year-end target price suggests a high upside from the current market price. Therefore, I’m maintaining a buy rating on Western Alliance Bancorporation.
Loan Growth Likely to Decelerate After a Phenomenal Second Quarter
Western Alliance Bancorporation reported outstanding loan growth of 18.2% in the second quarter of 2022, or 72.8% annualized. What is most impressive is the fact that this growth was mostly organic, with only a small part attributable to accounting measures. Western Alliance shifted $1.9 billion (4% of loans) from held-for-sale to held-for-investment loans. Within the organic loan growth, the commercial and industrial segment, C&I, was the biggest driver of loan growth.
The second quarter’s loan growth can obviously not be sustained as it’s an anomaly. Further, interest rates are likely to peak later this year before declining next year. Such an interest rate outlook will encourage borrowers to put off some of their less urgent borrowing plans until next year.
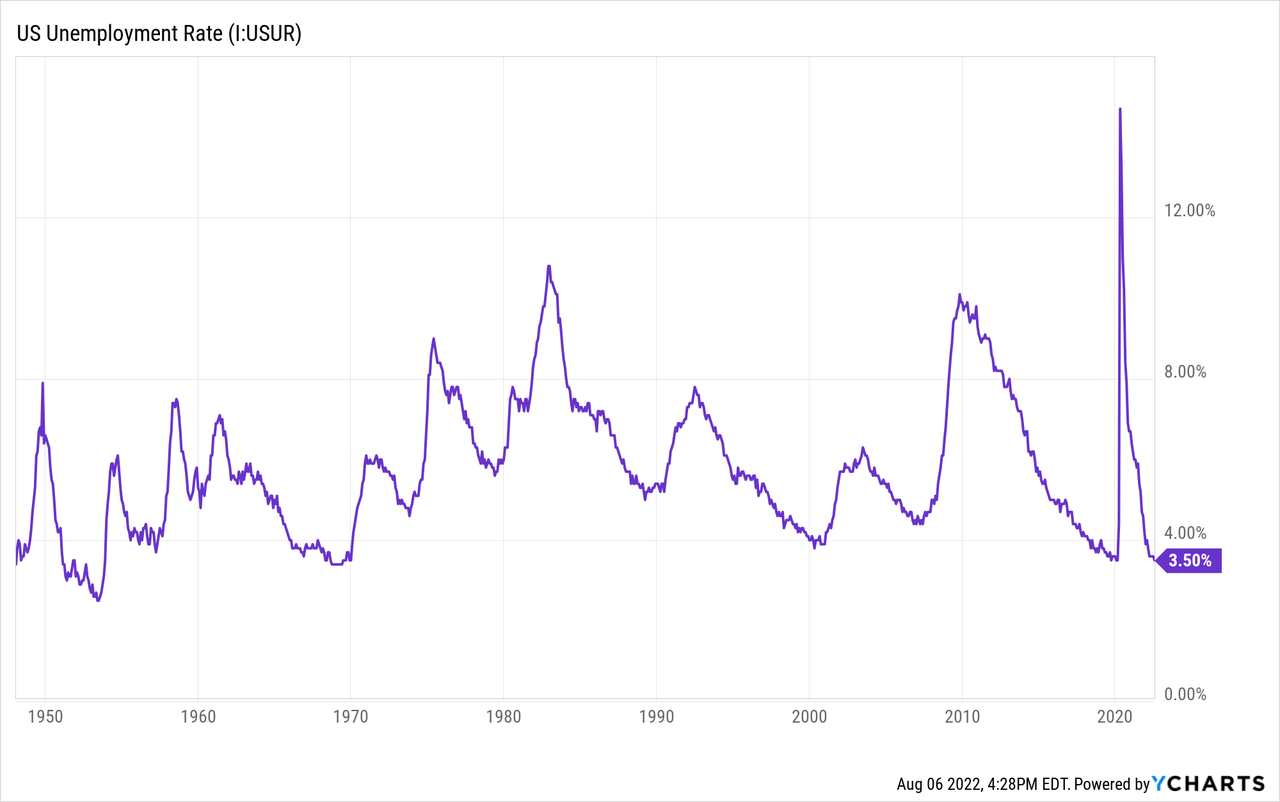
On the other hand, strong job markets will support loan growth. Western Alliance is a nationwide lender; therefore, the national unemployment rate is a suitable indicator of credit demand for the company. The job market is near full employment and at record lows, as shown below.
The management mentioned in the conference call that it expects loans and deposits to grow in excess of $2 billion per quarter. Part of the management’s confidence is attributable to robust loan pipelines.
Considering the factors given above and the management’s guidance, I’m expecting the loan book to increase by 36% in 2022. In my last report on Western Alliance, I estimated loan growth of 21% for this year. I’ve revised upwards my loan growth estimate for the year mostly because of the portfolio’s phenomenal performance during the second quarter of 2022. For 2023, I’m expecting loan growth to return to a more normal level. Meanwhile, I’m expecting other balance sheet items to grow mostly in line with loans. The following table shows my balance sheet estimates.
| FY18 | FY19 | FY20 | FY21 | FY22E | FY23E | |||||
| Financial Position | ||||||||||
| Net Loans | 17,558 | 20,934 | 26,774 | 38,823 | 52,870 | 61,850 | ||||
| Growth of Net Loans | 17.4% | 19.2% | 27.9% | 45.0% | 36.2% | 17.0% | ||||
| Other Earning Assets | 4,087 | 4,307 | 8,009 | 13,526 | 13,524 | 13,935 | ||||
| Deposits | 19,177 | 22,796 | 31,931 | 47,612 | 57,816 | 66,345 | ||||
| Borrowings and Sub-Debt | 874 | 410 | 554 | 2,414 | 6,004 | 6,248 | ||||
| Common equity | 2,614 | 3,017 | 3,414 | 4,668 | 5,169 | 6,275 | ||||
| Book Value Per Share ($) | 24.8 | 29.3 | 34.0 | 44.7 | 48.0 | 58.3 | ||||
| Tangible BVPS ($) | 22.0 | 26.4 | 31.0 | 38.6 | 41.5 | 51.8 | ||||
|
Source: SEC Filings, Earnings Releases, Author’s Estimates (In USD million unless otherwise specified) |
||||||||||
Margin Moderately Rate Sensitive Thanks to Sticky Deposit Costs
The proportion of non-interest-bearing deposits in total deposits dipped in the second quarter. Nevertheless, non-interest-bearing deposits still constitute a large part of the deposit book. According to details given in the 10-Q filing, non-interest-bearing deposits made up 44.2% of total deposits at the end of June 2022, compared to 45.1% at the end of March 2022, and 44.8% at the end of December 2021. These deposits will make the average deposit cost upwards sticky in a rising-rate environment.
The anticipated strong loan growth discussed above will likely further support the margin. The results of the management’s interest-rate sensitivity analysis given in the earnings presentation showed that a 100-basis points hike in interest rates could boost the net interest income by 5.3% over twelve months.
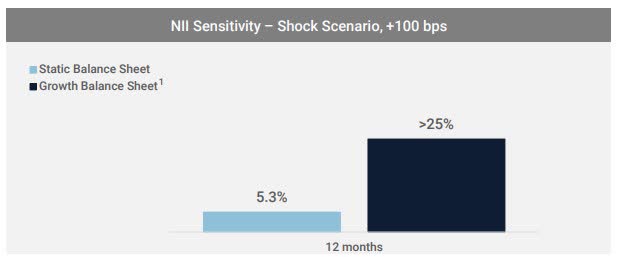
Western Alliance Bancorporation’s 2Q 2022 Presentation
Considering these factors, I’m expecting the margin to increase by 18 basis points in the second half of 2022 before stabilizing next year.
Loan Additions to Drive Provisioning
Western Alliance reported an unusually large net provision expense for the second quarter of 2022, mostly because of the extraordinary loan additions during that quarter. Portfolio additions will most probably continue to be the leading source of provisioning for the next few quarters. In addition, the heightened interest rates, and the resultant increase in borrowing costs for variable-rate loans will worsen the portfolio’s asset quality. Moreover, the possibility of a recession will demand further provisioning.
On the plus side, around 27% of the loan portfolio is credit protected, including government guarantees, as mentioned in the earnings presentation. Overall, I’m expecting the net provision expense to make up around 0.24% of total loans (annualized) in the second half of 2022 and 0.13% of total loans in 2023. In comparison, the net provision expense averaged 0.11% of total loans from 2017 to 2019.
In my last report on Western Alliance Bancorporation, I estimated a net provision expense of $30 million for 2022. In comparison, I’m now expecting a net provision expense of $97 million. I’ve revised upwards my provisioning estimate because of stronger loan growth than previously expected. Further, a greater-than-expected deterioration in the economic outlook has pushed up my estimate.
Earnings to Grow by 15%
The remarkable loan growth and slight margin expansion will play a pivotal role in boosting earnings this year and the next. On the other hand, higher provisioning expenses will likely drag earnings growth. Overall, I’m expecting Western Alliance to report earnings of $10.0 per share for 2022, up 15% year-over-year. For 2023, I’m expecting the company to report earnings of $11.74 per share, up by 17% year-over-year. The following table shows my income statement estimates.
| FY18 | FY19 | FY20 | FY21 | FY22E | FY23E | |||||
| Income Statement | ||||||||||
| Net interest income | 916 | 1,040 | 1,167 | 1,549 | 2,173 | 2,567 | ||||
| Provision for loan losses | 23 | 19 | 124 | (21) | 97 | 80 | ||||
| Non-interest income | 43 | 65 | 71 | 404 | 391 | 385 | ||||
| Non-interest expense | 426 | 483 | 492 | 851 | 1,109 | 1,275 | ||||
| Net income – Common Sh. | 436 | 499 | 507 | 896 | 1,077 | 1,265 | ||||
| EPS – Diluted ($) | 4.14 | 4.84 | 5.04 | 8.67 | 10.00 | 11.74 | ||||
|
Source: SEC Filings, Earnings Releases, Author’s Estimates (In USD million unless otherwise specified) |
||||||||||
In my last report on Western Alliance, I estimated earnings of $9.92 per share for 2022. I haven’t changed my earnings estimate much because the upward revision in loan growth estimate cancels out the upward revisions of operating and provisioning expenses.
Actual earnings may differ materially from estimates because of the risks and uncertainties related to inflation, and consequently the timing and magnitude of interest rate hikes. Further, a stronger or longer-than-anticipated recession can increase the provisioning for expected loan losses beyond my estimates.
Maintaining a Buy Rating Due to a High Upside
Given the earnings outlook, I’m expecting Western Alliance to increase its dividend per share by $0.02 to $0.38 in the third quarter of 2023. The earnings and dividend estimates suggest a payout ratio of 13% for 2023, which is in line with the 2020-2021 average of 15%. The dividend expectation for 2023 implies a dividend yield of 1.9%.
I’m using the historical price-to-tangible book (“P/TB”) and price-to-earnings (“P/E”) multiples to value Western Alliance. The stock has traded at an average P/TB ratio of 2.05 in the past, as shown below.
| FY18 | FY19 | FY20 | FY21 | Average | ||
| T. Book Value per Share ($) | 22.0 | 26.4 | 31.0 | 38.6 | ||
| Average Market Price ($) | 56.1 | 46.2 | 41.7 | 98.1 | ||
| Historical P/TB | 2.55x | 1.75x | 1.34x | 2.54x | 2.05x | |
| Source: Company Financials, Yahoo Finance, Author’s Estimates | ||||||
Multiplying the average P/TB multiple with the forecast tangible book value per share of $41.5 gives a target price of $85.1 for the end of 2022. This price target implies a 10.2% upside from the August 5 closing price. The following table shows the sensitivity of the target price to the P/TB ratio.
| P/TB Multiple | 1.85x | 1.95x | 2.05x | 2.15x | 2.25x |
| TBVPS – Dec 2022 ($) | 41.5 | 41.5 | 41.5 | 41.5 | 41.5 |
| Target Price ($) | 76.8 | 80.9 | 85.1 | 89.2 | 93.4 |
| Market Price ($) | 77.2 | 77.2 | 77.2 | 77.2 | 77.2 |
| Upside/(Downside) | (0.5)% | 4.9% | 10.2% | 15.6% | 21.0% |
| Source: Author’s Estimates |
The stock has traded at an average P/E ratio of around 10.7x in the past, as shown below.
| FY18 | FY19 | FY20 | FY21 | Average | ||
| Earnings per Share ($) | 4.14 | 4.84 | 5.04 | 8.67 | ||
| Average Market Price ($) | 56.1 | 46.2 | 41.7 | 98.1 | ||
| Historical P/E | 13.6x | 9.6x | 8.3x | 11.3x | 10.7x | |
| Source: Company Financials, Yahoo Finance, Author’s Estimates | ||||||
Multiplying the average P/E multiple with the forecast earnings per share of $10.0 gives a target price of $106.7 for the end of 2022. This price target implies a 38% upside from the August 5 closing price. The following table shows the sensitivity of the target price to the P/E ratio.
| P/E Multiple | 8.7x | 9.7x | 10.7x | 11.7x | 12.7x |
| EPS 2022 ($) | 10.00 | 10.00 | 10.00 | 10.00 | 10.00 |
| Target Price ($) | 86.7 | 96.7 | 106.7 | 116.7 | 126.7 |
| Market Price ($) | 77.2 | 77.2 | 77.2 | 77.2 | 77.2 |
| Upside/(Downside) | 12.3% | 25.3% | 38.2% | 51.2% | 64.1% |
| Source: Author’s Estimates |
Equally weighting the target prices from the two valuation methods gives a combined target price of $95.9, which implies a 24% upside from the current market price. Adding the forward dividend yield gives a total expected return of 26%. Hence, I’m maintaining a buy rating on Western Alliance Bancorporation.
Be the first to comment