

bodnarchuk/iStock via Getty Images
Introduction
The Canadian-based Wesdome Gold Mines Ltd. (OTCPK: WDOFF) is a small gold producer focused on Canadian assets. The company is producing gold from three mines now.
However, the Eagle River and the Kiena complex are two crucial mines considered high-quality asset bases with solid growth potential, fully funded by the company. Both mines are located in Canada.
WDOFF: Eagle River and Kiena Complex presentation (Wesdome Gold)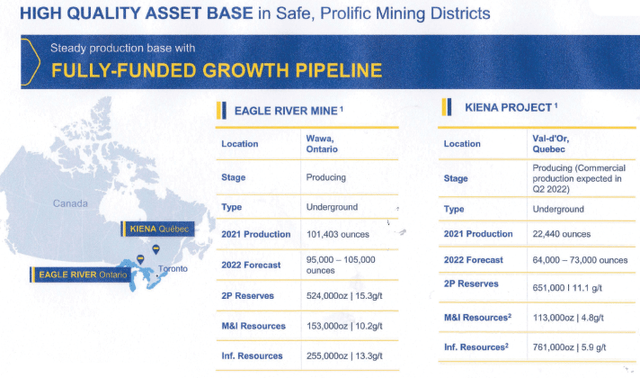
Eagle River is an underground mine expected to produce 95K to 105K Au Oz in 2022 (Mineral Reserves 524K Au Oz at 15.3 G/T).
Kiena Complex is expected to produce commercially in 2Q22 with a production expected to be 64K to 73K Au Oz (Mineral Reserves 651K Au Oz at 11.1 G/T).
1 – 1Q22 Production results snapshot
Wesdome Gold Mines released its first-quarter production results on April 4, 2022. The company posted $53.37 million in revenue for the first quarter of 2022, up 45.9% compared to the same quarter a year ago.
Note: The complete earnings results will be indicated later.
Gold production this quarter was 25,611 Au Oz, and the company sold 28,000 Au Oz. Gold price realized this quarter was $1,907 per ounce.
Wesdome indicated in its last presentation on April 22 that Kiena mine commercial production is set to be during the 2Q22. The mine is between Canadian Malartic (Agnico Eagle and Yamana Gold) mine and Lamaque Mine (Eldorado Gold).
WDOFF: The Kiena Complex project (Wesdome Gold)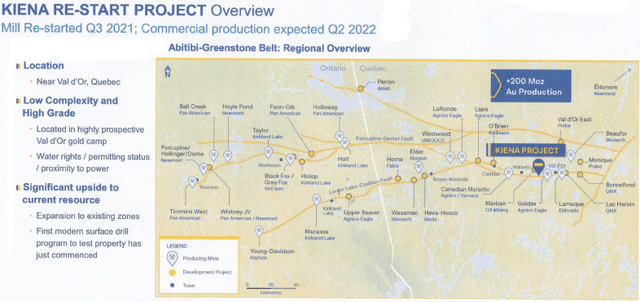
WDOFF: PFS Kiena Presentation (Wesdome Gold)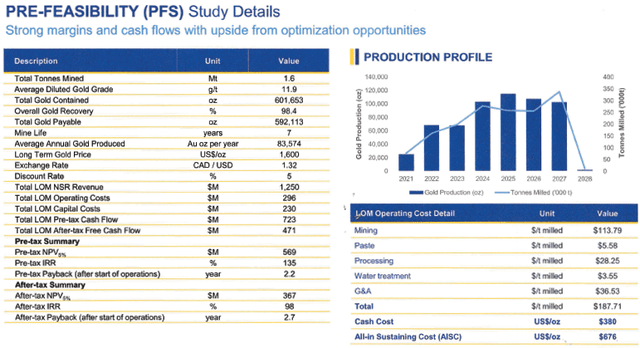
2 – Investment Thesis
Wesdome Gold is a good mid-tier gold producer with a clear potential for an acquisition/merger.
The Kiena Complex in Québec is a prime property that could fit perfectly Agnico Eagle, Yamana, or Eldorado Gold. I believe Agnico Eagle, with its Goldex mine nearby, is the most likely contender.
Thus, I recommend accumulating the miner on any weakness while trading a good part of your position to take advantage of the gold volatility. A dual strategy with a long-term core position that you grow by the short-term gain from your trading LIFO is the best solution here, in my opinion.
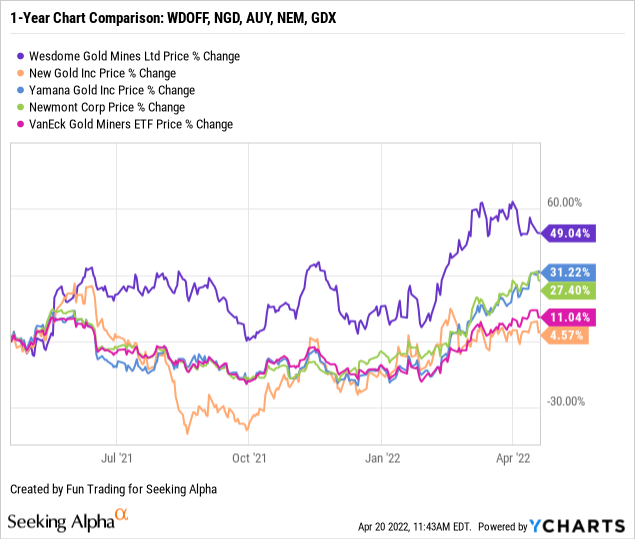
3 – Stock Performance
The stock has underperformed VanEck Vectors (NYSEARCA: GDX). The situation has been accelerating since December.
Wesdome Gold Mines Ltd. 1Q22 Preliminary Balance Sheet And 1Q22 Gold Production: The Raw Numbers
Note: Warning: The company data are in Can$. All numbers are converted into US$. I use a 0.8014x conversion rate.
| WDOFF | 1Q21 | 2Q21 | 3Q21 | 4Q21 | 1Q22 |
| Total Revenues $ million | 36.58 | 52.28 | 53.31 | 66.80 | 53.37 |
| Quarterly Earnings $ million | 5.65 | 71.86 | 12.11 | 16.43 | – |
| EBITDA $ million | 14.85 | 106.81 | 22.44 | 31.23 | – |
| EPS (diluted) $ per share | 0.04 | 0.51 | 0.09 | 0.12 | – |
| Operating Cash Flow $ million | 20.63 | 21.99 | 26.75 | 37.63 | – |
| CapEx in $ million | 19.35 | 27.92 | 32.44 | 37.37 | – |
| Free Cash Flow in $ million | 1.28 | -5.93 | -5.69 | 0.26 | – |
| Total Cash in $ million | 50.83 | 55.48 | 54.83 | 44.35 | – |
| Total LT Debt in $ million | 0 | 0 | 0 | 0 | – |
| Shares Outstanding (diluted) | 142.6 | 142.6 | 143.07 | 143.19 | – |
| Gold Production | 1Q21 | 2Q21 | 3Q21 | 4Q21 | 1Q22 |
| Quarterly Production K Oz | 22,564 | 30,375 | 29,344 | 41,559 | 25,611 |
| Gold sold K Oz | 22,457 | 28,500 | 30,000 | 37,544 | 28,000 |
| Gold Price in $/Oz | 1,756 | 1,823 | 1,774 | 1,777 | 1,907 |
| AISC in $/Oz | 1,182 | 1,009 | 1,180 | 1,103 | – |
| Mine | 1Q21 | 2Q21 | 3Q21 | 4Q21 | 1Q22 |
| Eagle River | 21,395 | 29,836 | 23,621 | 24,267 | 19,334 |
| Ore grade G/T | 12.8 | 15.1 | 13.4 | 13.7 | 11.6 |
| Mishi | 1169 | 539 | 212 | 363 | 1,165 |
| Ore grade G/T | 2.5 | 2.4 | 2.3 | 2.1 | 3.6 |
| Kiena | 1,793 | 0 | 3,000 | 13,207 | 5,112 |
| Ore grade G/T | – | 0 | 7.8 | 14.1 | 7.7 |
Source: Wesdome filings.
Balance Sheet And Production Discussion
1 – First quarter of 2022, revenues were $53.37 million.
WDOFF: Chart Quarterly Revenues history (Fun Trading)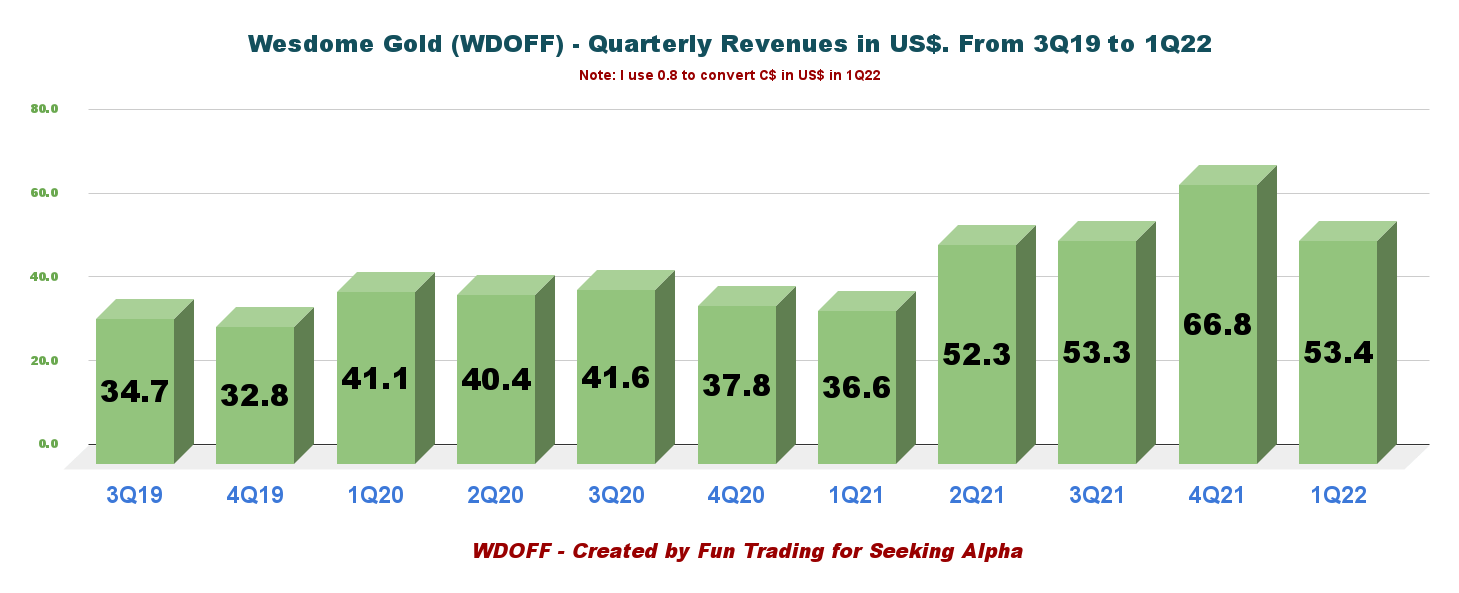
The first quarter’s revenue was $53.37 million compared to $36.58 million in 1Q21. Gold production was weak due to some technical issues at the Kiena complex and staff absence due to the COVID-19 omicron.
2 – Quarterly production analysis
Wesdome Gold produced 25,611 Au Oz in the first quarter of 2021, up 14% yearly (please see charts below). Production was in line with expectations and represents the low quarterly production for 2022.
WDOFF: Chart Quarterly Gold production history (Fun Trading)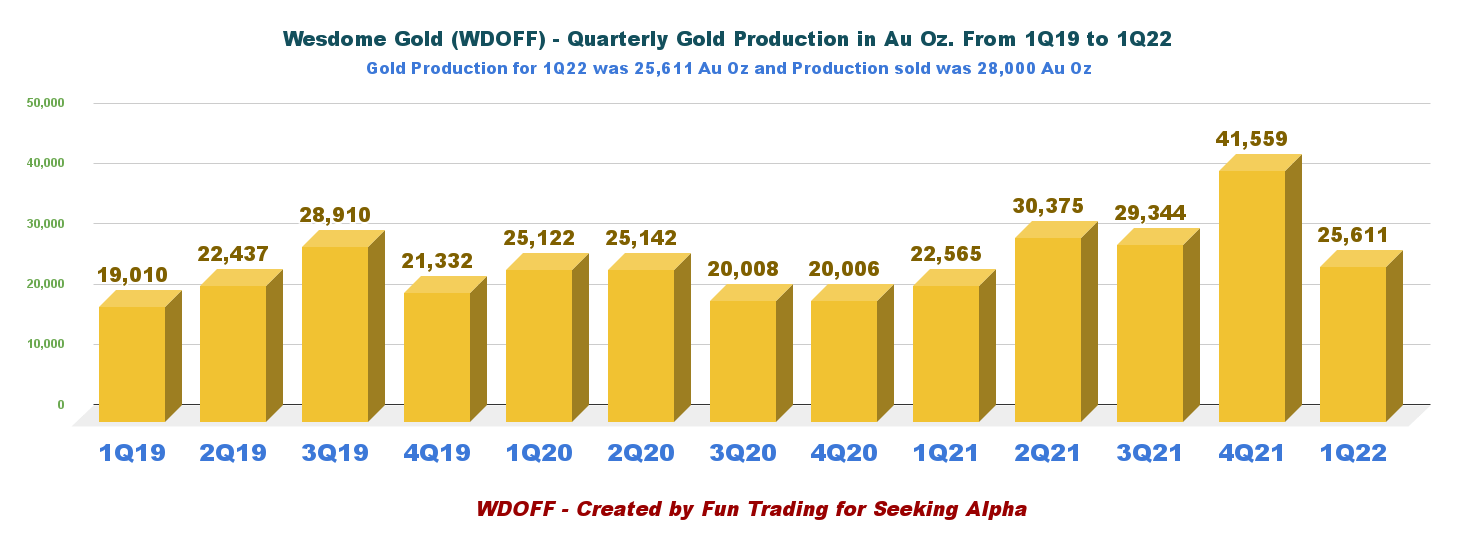
Duncan Middlemiss, President, and CEO, said in the press release:
We made significant investments in the business during the quarter to set us up for a stronger second half at both assets.
At Eagle, we will have additional ore available from the Falcon Zone, which is expected to boost both volume and grade.
At Kiena, the ramp-up has been impacted by unscheduled downtime related to the underground crusher. As well, some equipment delays and staff absences in the beginning of the year due to the outbreak of the Omicron variant impacted development, hence the lower grade in Q1. These challenges have largely been rectified, and commercial production is on track for mid year.
Production came from three mines:
WDOFF: Chart Quarterly Production per mine history (Fun Trading)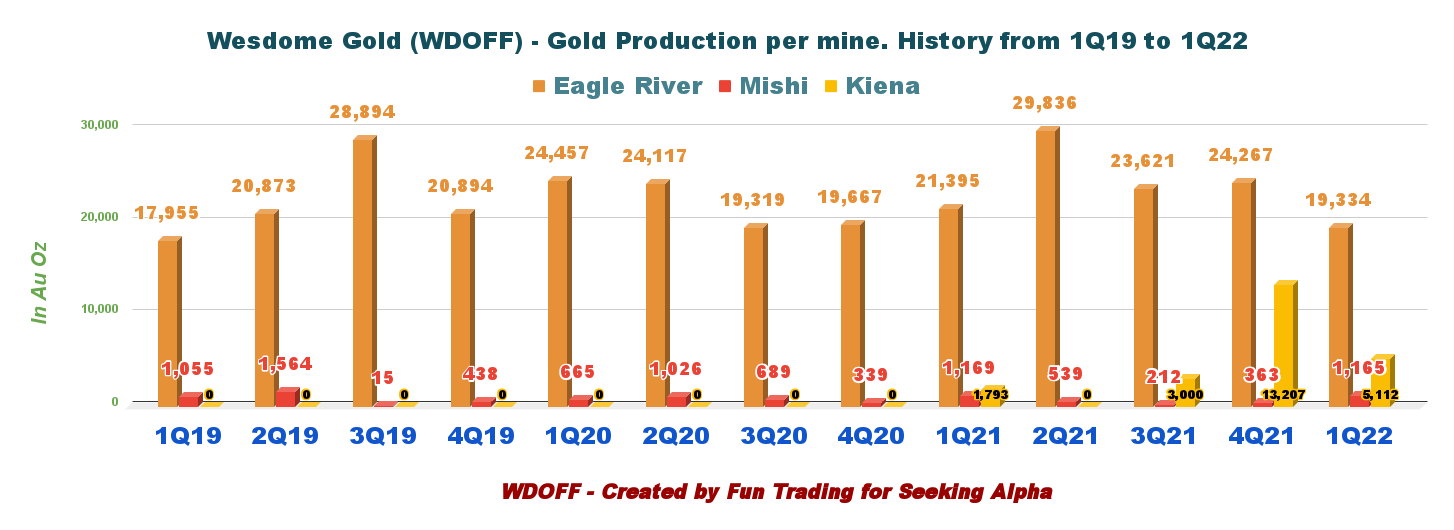
1Q22 production at Eagle River decreased by 9.6% from 1Q21 to 19,334 ounces of gold. Head grade at Eagle River in 1Q22 averaged 11.6 g/t and was below average. The company processed 53,217 Tonnes in 1Q22.
The high-grade 303 E Zone Falcon Zones discovered in 2018 are expected to expand reserves and resources.
The Mishi pit was mined out as per plan in 4Q20, and only stockpiled ore was processed in 1Q22. The contribution from Mishi in 1Q22 was 1,165 Au Oz.
Finally, Kiena’s pre-commercial production for 1Q22 was 5,112 Au Oz. As I said earlier, the company expects commercial production this quarter.
3 – The company indicated Guidance for 2022
Consolidated Production Guidance for 2022 is 160K Oz-180K Oz with AISC between $1,015 and $1,125 per ounce.
WDOFF: 2022 Guidance Presentation (Wesdome Gold)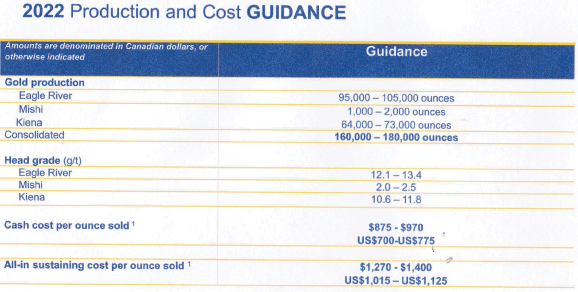
4 – Mineral Reserves
WDOFF: Mineral reserves per mine (Wesdome Gold)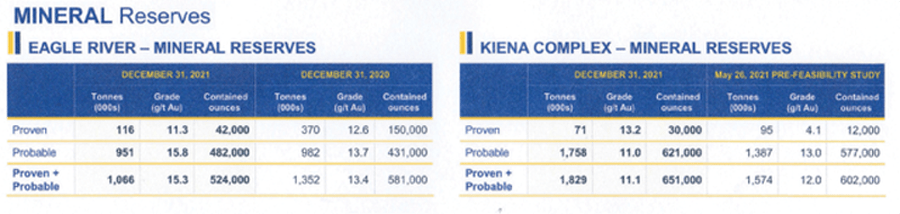
Consolidated mineral reserves are 1,175K Oz. Mineral resources are 266K Oz.
Technical analysis and commentary
WDOFF: TA Chart short term (Fun Trading)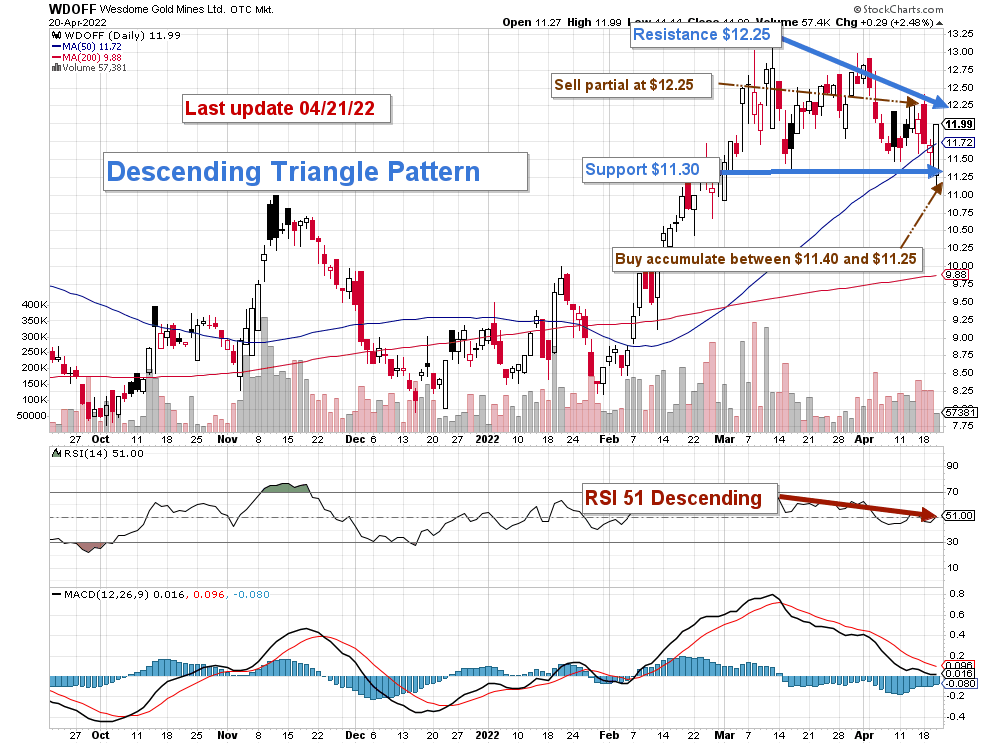
WDOFF forms a descending triangle pattern with resistance at $12.25 and support at $11.30. The trading strategy now is to sell about 30% of your position above $12.25 and accumulate below $11.30 with a potential low at $10 in case of sharp retracement.
The second half of 2022 will see a substantial increase in gold production, with Kiena producing commercially, which could boost the stock to $13.50.
Watch gold like a hawk.
Warning: The TA chart must be updated frequently to be relevant. It is what I am doing in my stock tracker. The chart above has a possible validity of about a week. Remember, the TA chart is a tool only to help you adopt the right strategy. It is not a way to foresee the future. No one and nothing can.
Author’s note: If you find value in this article and would like to encourage such continued efforts, please click the “Like” button below as a vote of support. Thanks!
Be the first to comment