

Jacqueline Nix
The ongoing up-rate cycle and the resultant margin expansion will be the chief earnings driver for WesBanco, Inc. (NASDAQ:WSBC) through the end of 2023. Further, the bottom line will receive some support from loan growth. Overall, I’m expecting WesBanco to report earnings of $2.96 per share for 2022 and $3.23 per share for 2023. Compared to my last report on the company, I’ve raised my earnings estimates for both years partly because I’ve revised upwards the margin estimates. The December 2023 target price suggests a moderate downside from the current market price. Based on the total expected return, I’m maintaining a hold rating on WesBanco, Inc.
Further Margin Expansion Likely
The margin’s rate of expansion accelerated in the third quarter of 2022. The margin increased by 30 basis points during the quarter, as opposed to 8 basis points in the second quarter of the year. The expansion was attributable to both the rising rate environment as well as an asset mix improvement. WesBanco was able to successfully move its excess cash into higher-yielding assets, thus improving the asset mix. There is limited room for further asset mix improvement as cash is now almost back to a normal level.
SEC Filings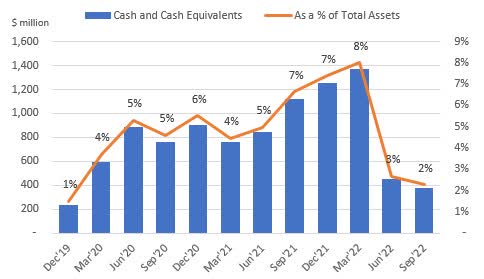
Nevertheless, the margin will most probably continue to expand due to the ongoing up-rate cycle. Around 65% of the total loan portfolio is based on variable rates, as mentioned in the earnings presentation. Therefore, the average earning asset yield is quite responsive to changes in interest rates. Comparatively, adjustable-rate deposits make up a lower proportion of total deposits. These deposits, namely interest-bearing demand, money market, and savings accounts made up 57.4% of total deposits at the end of September 2022. Due to the combination of loan and deposit mixes, the margin is quite rate-sensitive. The results of the management’s interest-rate sensitivity analysis given in the 10-Q filing showed that a 200-basis points hike in interest rates could boost the net interest income by 6.5% over twelve months.
3Q 2022 10-Q Filing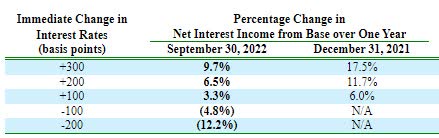
Considering these factors, I’m expecting the margin to grow by 10 basis points in the last quarter of 2022 and a further 10 basis points in 2023. Compared to my last report on the company, I’ve increased my margin estimate because of the third quarter’s performance. Further, I’m now expecting a tighter monetary policy than I previously anticipated.
Loan Growth Likely to Improve from the Third Quarter’s Level
Loan growth slowed down to 0.7% in the third quarter, following 4.9% growth in the second quarter of this year. The subdued growth was partly attributable to heightened payoffs in the commercial real estate (“CRE”) portfolio, as mentioned in the conference call. The management expects these payoffs to normalize in the fourth quarter. As a result, I’m expecting loan growth to improve from the third quarter’s level.
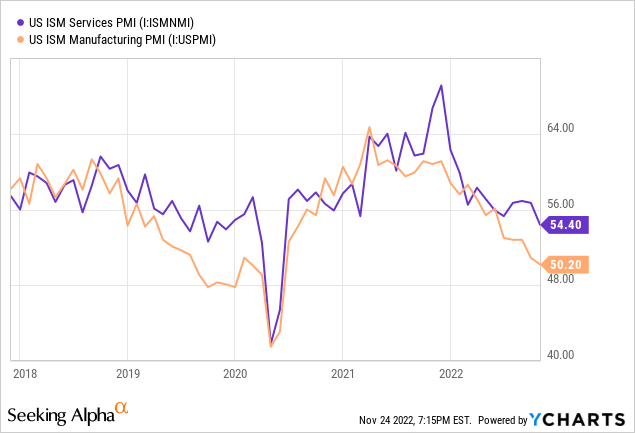
WesBanco’s loan portfolio is well diversified geographically. Further, the portfolio is heavy on commercial loans, including CRE and commercial and industrial (“C&I”) loans. As a result, I believe the Purchasing Managers Index is a good gauge of credit demand. As shown below, the indices are still in expansionary territory (above 50), which is good news for WesBanco’s product demand.
Further, the US leading economic index is an apt indicator of future product demand. The index continues to remain on a downtrend, as shown below.
The Conference Board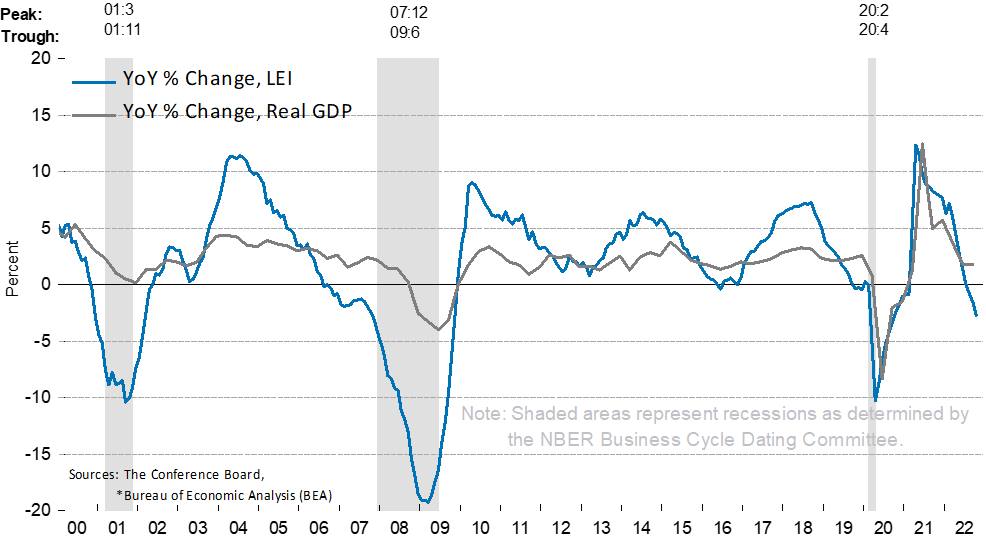
Considering these factors, I’m expecting the loan portfolio to grow by 1% in the last quarter of 2022, leading to full-year loan growth of 6.8%. For 2023, I’m expecting the portfolio to grow by 4%. Meanwhile, I’m expecting deposits to grow in line with loans. However, the growth of securities and equity book value will trail loan growth because higher interest rates will decrease the market value of securities, leading to unrealized mark-to-market losses that will flow into the equity book value account. The following table shows my balance sheet estimates.
| Financial Position | FY18 | FY19 | FY20 | FY21 | FY22E | FY23E |
| Net Loans | 7,607 | 10,216 | 10,603 | 9,612 | 10,265 | 10,681 |
| Growth of Net Loans | 20.8% | 34.3% | 3.8% | (9.4)% | 6.8% | 4.1% |
| Other Earning Assets | 3,200 | 3,353 | 3,612 | 5,151 | 4,130 | 4,255 |
| Deposits | 8,832 | 11,004 | 12,429 | 13,566 | 13,579 | 14,130 |
| Borrowings and Sub-Debt | 1,535 | 1,898 | 983 | 459 | 468 | 478 |
| Common equity | 1,979 | 2,594 | 2,612 | 2,549 | 2,177 | 2,186 |
| Book Value Per Share ($) | 40.4 | 46.1 | 38.8 | 40.3 | 36.5 | 36.6 |
| Tangible BVPS ($) | 21.6 | 25.7 | 21.5 | 22.1 | 17.3 | 17.4 |
| Source: SEC Filings, Earnings Releases, Author’s Estimates(In USD million unless otherwise specified) | ||||||
Normalized Provisioning Likely for the Quarters Ahead
WesBanco surprised me yet again by reporting a net provision reversal in the third quarter of 2022. The credit quality of the loan portfolio has continued to improve over the recent quarters. Non-performing loans have dipped to 0.32% of total loans by the end of September 2022 from 0.41% at the end of December 2021. Therefore, the reserve releases are not a problem. The credit risk is still well covered, with allowances making up 1.11% of total loans.
However, due to the threats of a recession, it will be advisable to keep provisioning beefed up in the next few quarters. Considering these factors, I’m expecting the net provision expense to revert to the historical average. I’m expecting the net provision expense to make up 0.15% of total loans in 2023, which is close to the average for the last five years. Compared to my last report on WesBanco, I’ve reduced my provisioning estimate for both 2022 and 2023 following the third quarter’s better-than-expected performance.
Expecting Earnings to Grow by 9% Next Year
The anticipated margin expansion and loan growth discussed above will likely be the key drivers of earnings through the end of 2023. Overall, I’m expecting WesBanco to report earnings of $2.96 per share for 2022 and $3.23 per share for 2023. The following table shows my income statement estimates.
| Income Statement | FY18 | FY19 | FY20 | FY21 | FY22E | FY23E |
| Net interest income | 347 | 400 | 479 | 458 | 472 | 527 |
| Provision for loan losses | 8 | 11 | 108 | (64) | (1) | 16 |
| Non-interest income | 100 | 117 | 128 | 133 | 119 | 120 |
| Non-interest expense | 265 | 312 | 355 | 353 | 359 | 381 |
| Net income – Common Sh. | 143 | 159 | 119 | 232 | 179 | 193 |
| EPS – Diluted ($) | 2.92 | 2.83 | 1.77 | 3.53 | 2.96 | 3.23 |
| Source: SEC Filings, Earnings Releases, Author’s Estimates(In USD million unless otherwise specified) | ||||||
In my last report on WesBanco, I estimated earnings of $2.80 per share for 2022 and $3.02 per share for 2023. I’ve increased my earnings estimates because I’ve raised my margin estimates and reduced my provisioning estimates.
My estimates are based on certain macroeconomic assumptions that may not come to pass. Therefore, actual earnings can differ materially from my estimates.
Maintaining a Hold Rating
WesBanco is offering a dividend yield of 3.5% at the current quarterly dividend rate of $0.35 per share. The earnings and dividend estimates suggest a payout ratio of 43% for 2023, which is close to the five-year average of 48%. Therefore, I’m not expecting an increase in the dividend level.
I’m using the historical price-to-tangible book (“P/TB”) and price-to-earnings (“P/E”) multiples to value WesBanco. The stock has traded at an average P/TB ratio of 1.57 in the past, as shown below.
| FY18 | FY19 | FY20 | FY21 | Average | ||
| T. Book Value per Share ($) | 21.6 | 25.7 | 21.5 | 22.1 | ||
| Average Market Price ($) | 44.1 | 38.1 | 25.3 | 34.7 | ||
| Historical P/TB | 2.04x | 1.48x | 1.17x | 1.57x | 1.57x | |
| Source: Company Financials, Yahoo Finance, Author’s Estimates | ||||||
Multiplying the average P/TB multiple with the forecast tangible book value per share of $17.4 gives a target price of $27.3 for the end of 2023. This price target implies a 32% downside from the November 23 closing price. The following table shows the sensitivity of the target price to the P/TB ratio.
| P/TB Multiple | 1.37x | 1.47x | 1.57x | 1.67x | 1.77x |
| TBVPS – Dec 2023 ($) | 17.4 | 17.4 | 17.4 | 17.4 | 17.4 |
| Target Price ($) | 23.8 | 25.6 | 27.3 | 29.1 | 30.8 |
| Market Price ($) | 40.3 | 40.3 | 40.3 | 40.3 | 40.3 |
| Upside/(Downside) | (40.8)% | (36.5)% | (32.2)% | (27.8)% | (23.5)% |
| Source: Author’s Estimates |
The stock has traded at an average P/E ratio of around 13.2x in the past, as shown below.
| FY18 | FY19 | FY20 | FY21 | Average | ||
| Earnings per Share ($) | 2.92 | 2.83 | 1.77 | 3.53 | ||
| Average Market Price ($) | 44.1 | 38.1 | 25.3 | 34.7 | ||
| Historical P/E | 15.1x | 13.5x | 14.3x | 9.8x | 13.2x | |
| Source: Company Financials, Yahoo Finance, Author’s Estimates | ||||||
Multiplying the average P/E multiple with the forecast earnings per share of $3.23 gives a target price of $42.5 for the end of 2023. This price target implies a 5.4% upside from the November 23 closing price. The following table shows the sensitivity of the target price to the P/E ratio.
| P/E Multiple | 11.2x | 12.2x | 13.2x | 14.2x | 15.2x |
| EPS – Dec 2023 ($) | 3.23 | 3.23 | 3.23 | 3.23 | 3.23 |
| Target Price ($) | 36.0 | 39.2 | 42.5 | 45.7 | 48.9 |
| Market Price ($) | 40.3 | 40.3 | 40.3 | 40.3 | 40.3 |
| Upside/(Downside) | (10.6)% | (2.6)% | 5.4% | 13.5% | 21.5% |
| Source: Author’s Estimates |
Equally weighting the target prices from the two valuation methods gives a combined target price of $34.9, which implies a 13.4% downside from the current market price. Adding the forward dividend yield gives a total expected return of negative 10.0%. Hence, I’m maintaining a hold rating on WesBanco, Inc.
Be the first to comment