

Maskot/DigitalVision via Getty Images
Although Healthcare REITs as a whole have been losing valuation thus far this year, they are outperforming the REIT average, according to Hoya Capital Income Builder. Healthcare REITs have shed (-16.96)% in total return thus far in 2022, while the REIT average is down (-21.13)%.
Hoya Capital Income Builder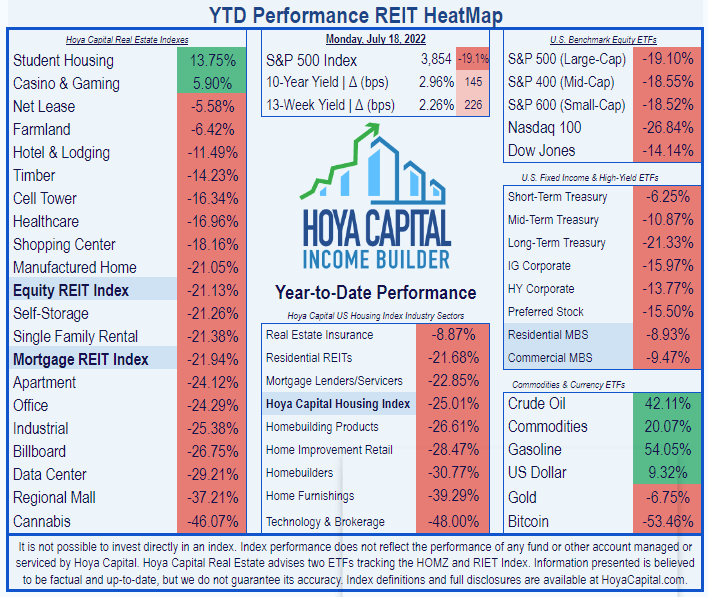
Welltower Inc. (NYSE:WELL) has outperformed the Healthcare herd YTD, losing just (-5.50%) off its share price so far.
Welltower Price Performance YTD (Seeking Alpha)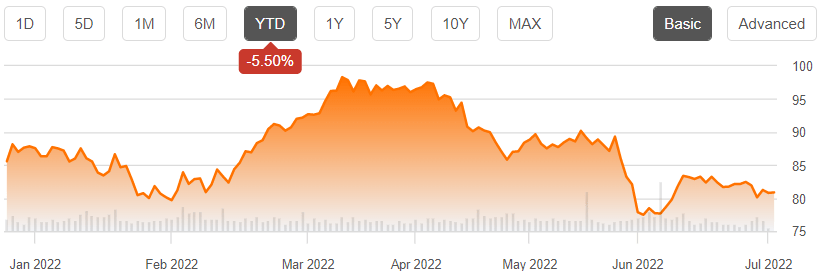
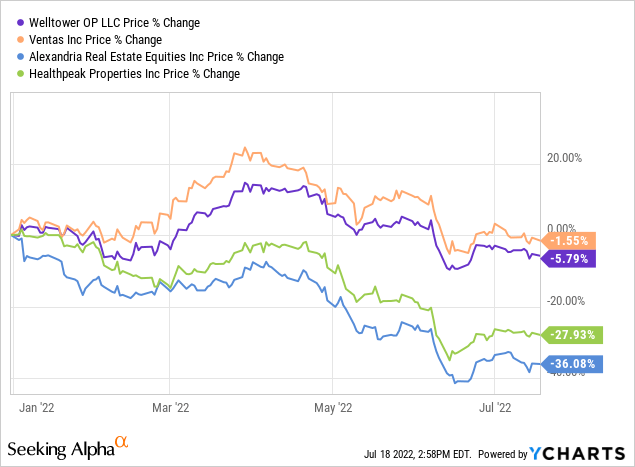
Among large-cap Healthcare REITs, WELL is running in 2nd place behind Ventas (VTR), but considerably ahead of Healthpeak (PEAK) and Alexandria (ARE).
Meet The Company
Welltower Inc. is the largest of all the Healthcare REITs, with a market cap over $36 billion. Founded in 1970 and headquartered in Toledo, this 52-year-old behemoth has 51 subsidiaries. It operates by providing capital to senior housing operators, post-acute care providers, and MOBs (medical office buildings). The company’s stated goal is to facilitate better treatment at lower costs, and keep patients out of the hospital.
The company’s real estate portfolio includes over 1600 properties comprising more than 125,000 housing units and about 23 msf (million square feet) of outpatient facilities. The company’s assets fall into three distinct segments:
- The SHOP (Seniors Housing Operating Portfolio) accounts for 38.0% of NOI,
- Triple-net leases contribute 41.2%, and
- Outpatient medical facilities kick in the other 20.8%.
According to the company’s 10-Q for Q1 2022, for the three months ended March 31, 2022, resident fees and services represented 71% of total revenues, and rental income represented 26%. The remaining 3% came from interest earned on outstanding loans.
The tenant roster is not ideally diversified. The top tenant, ProMedica, accounts for a whopping 11% of NOI, and the top 5 tenants combined account for 30%.
Geographically, 11% of Welltower’s assets are in the U.K. and 5% are in Canada. The remaining 84% are spread across the U.S., with the largest concentrations in California (13%), Texas (8%), and New Jersey (5%)
Welltower Tenant and Geographical Diversification (Welltower 10-Q for Q1 2022)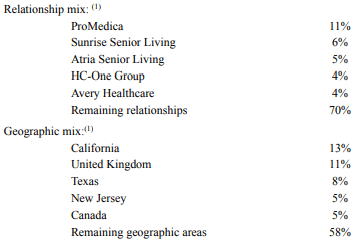
In the first quarter of this year alone, WELL acquired 10 SHOP properties at a cost of $477.6 million, realizing an anticipated weighted cap rate of 3.8%, as well as 4 MOBs totaling $152.5 million at 5.5%. At the same time, they disposed of 7 triple-net properties, realizing proceeds of $73.6 million and cap rates of 7.4%
Although the SHOP is the highest revenue earner at $994.3 million, it also demands by far the largest operating cost. Thanks to a 21% year-over-year increase in operating expenses in the SHOP, in Q1 2022, it operated at a net loss of (-$17.2) million. By contrast, the Triple Net segment netted $193.6 million in NOI, and the MOBs $49.4 million.
Welltower NOI by Segment (Welltower 10-Q for Q1 2022)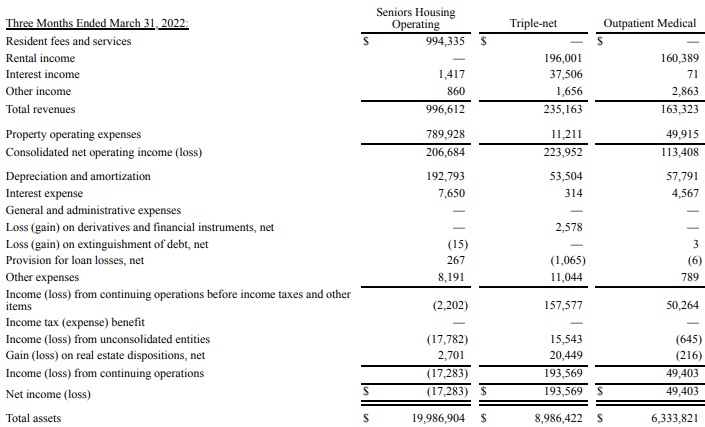
Over 80% of Welltower’s revenues in Q1 2022 came from operations in the U.S., with 10% from the U.K. and 8% from Canada.
Welltower Revenues by Country (Welltower 10-Q for Q1 2022)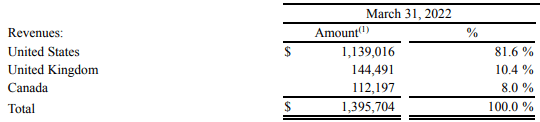
Welltower management clearly believes that the future is in SHOP. They currently have no fewer than 31 new SHOP facilities in development. This conviction is based on an anticipated increase in demand for senior housing, as well as a precipitous decline in starts, due to sharply increased construction costs and challenges in getting construction financing.
According to the Organisation for Economic Cooperation and Development (OECD), the rate of growth in the over-80 population is expected to more than double over this decade in the U.S., and also rise sharply in Canada and the U.K.
Welltower investor presentation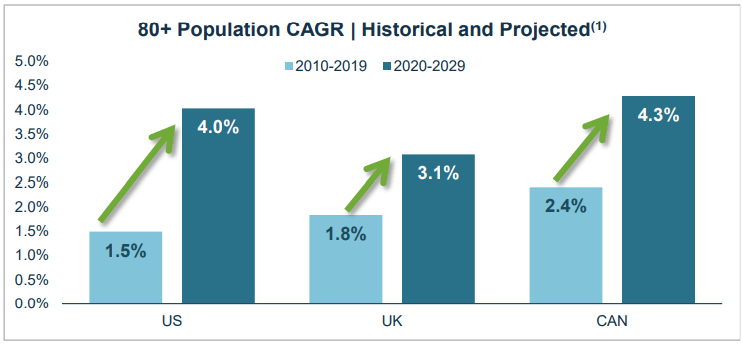
In fact, the 80+ age cohort is expected to be the fastest-growing of all the age cohorts in the U.S., the U.K., and Canada.
Welltower investor presentation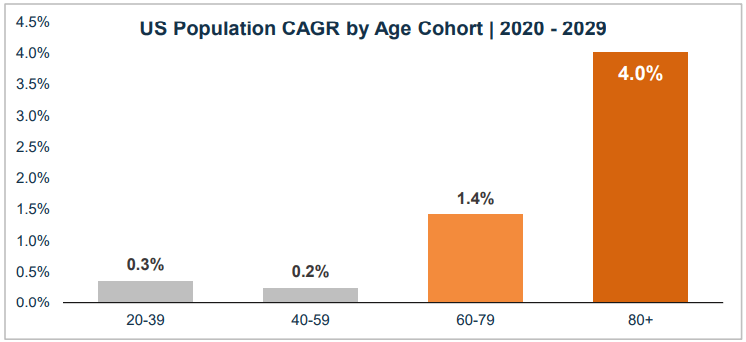
Welltower investor presentation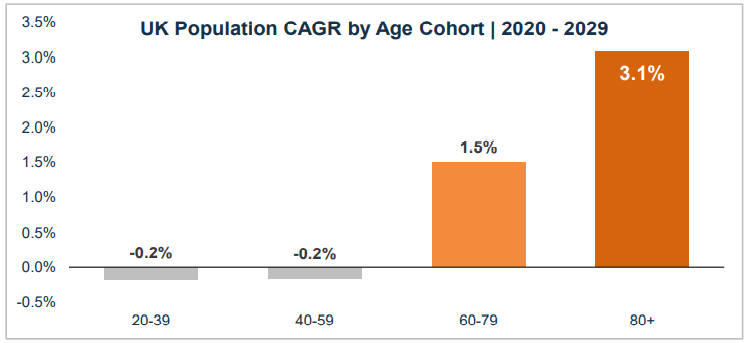
Welltower investor presentation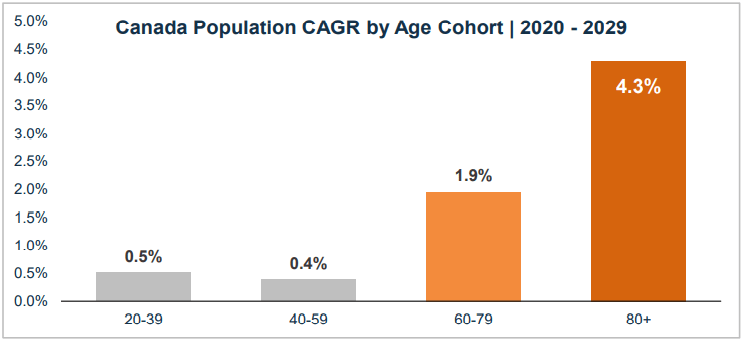
Construction starts on SHOP facilities have fallen to 10-year lows.
Welltower investor presentation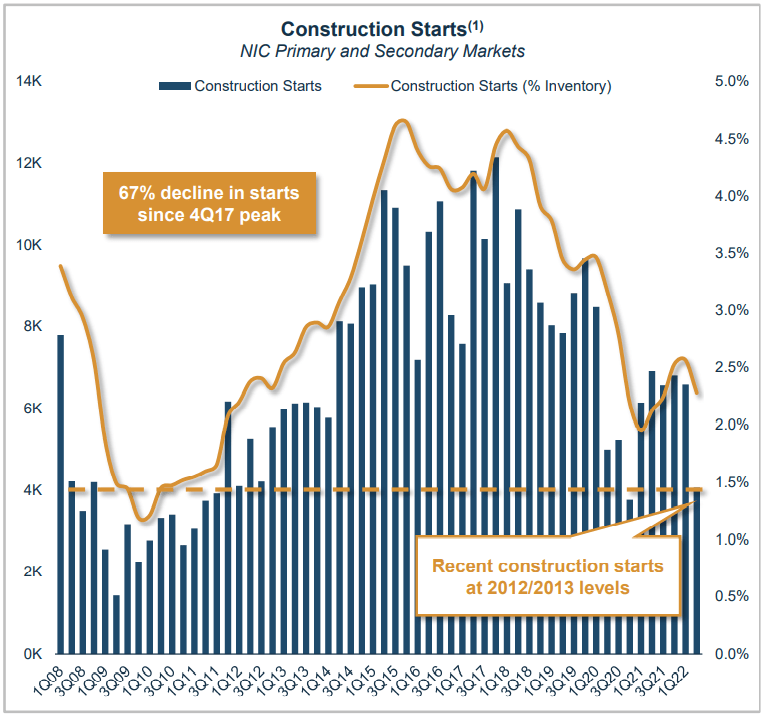
There has obviously been a corresponding decline in units under construction, and WELL management expects further declines.
Welltower investor presentation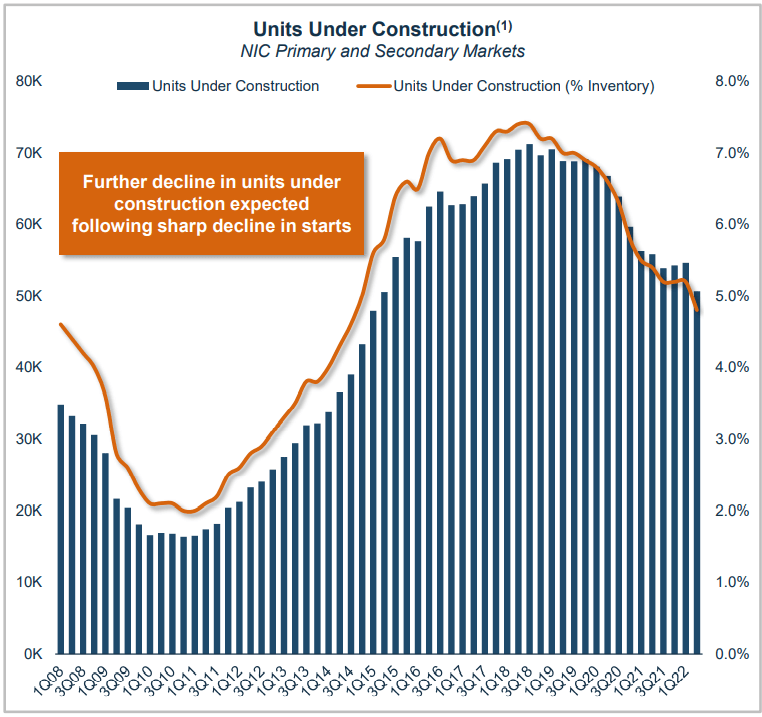
These trends are expected to result in significant pricing power, as reflected in sharply rising REVPOR (revenue per occupied room).
Welltower investor presentation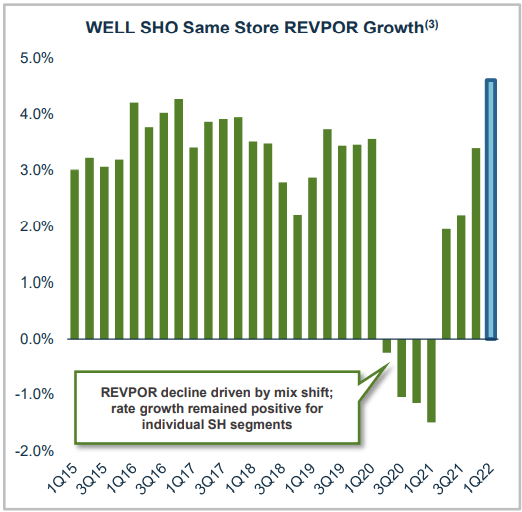
Welltower is also in the midst of other significant strategic shifts. Whereas in 2015-2020, just one tenant (Genesis Healthcare) providing post-acute care facilities comprised nearly 20% of the company’s NOI, WELL has sold a lot of those properties off, and Genesis is no longer in the top 5 WELL tenants.
The company is using a new data platform to construct shorter term contracts, allowing them to capture expected rent increases sooner.
In 2015-2020, the company faced an investing environment in which there were few attractive investment opportunities, so they focused on improving the portfolio through dispositions. Going forward, they see abundant investment opportunities and expect to deploy a great deal of capital.
As a result, the management team is optimistic that they are on the cusp of a multi-year period of strong per-share growth, after years of lackluster growth, resulting from an emphasis on dispositions over acquisitions, and the impact of the pandemic.
In addition to acquisitions, the company in Q1 2022 alone sank a total of $228.4 million into new development ($138.1 million), cap-ex ($32.8 million), and redevelopment ($57.4 million)
Welltower Development Activity (Welltower 10-Q for Q1 2022)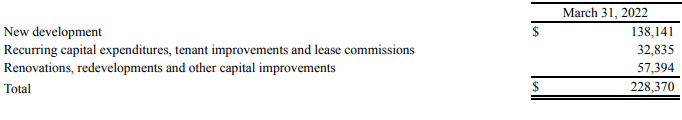
The shift already appears to be paying off. Welltower’s total portfolio revenue for Q1 2022 rose 32.7% year-over-year, driven by both organic revenue and a significant amount of capital deployment over the past 18 months.
The company recently hired John Burkart as Chief Operating Officer, and he is shifting to a data-driven technology platform approach. According to CEO Shankh Mitra, speaking on the most Q1 2022 earnings call,
We expect this multiyear initiative will have a tremendous impact on our earnings growth trajectory and long-term compounding machine that we are setting up at Welltower.
Merger Intrigue And Recent Developments
The company recently reported that its SHOP occupancy rate improved 130 bps (basis points) during Q2 2022, with about 50 bps of that increase occurring in the last two weeks of June alone. This news caused J.P. Morgan to upgrade WELL to Outperform from Neutral.
The company recently lost out on its offer to buy Healthcare Realty (HR) for approximately $5 billion, as HR decided to merge with Healthcare Trust of America (HTA) instead, despite an activist investor lobbying for the WELL offer.
In June, Wells Fargo named Welltower one of the 5 best real estate investments in the event of a recession. That same month, Bank of America named Welltower one of the 5 best investments for a graying planet.
Growth Metrics
Here are the 3-year growth figures for FFO (funds from operations), TCFO (total cash from operations), and market cap.
| Metric | 2018 | 2019 | 2020 | 2021 | 3-year CAGR |
| FFO (millions) | $1392 | $1577 | $1103 | $1221 | — |
| FFO Growth % | — | 13.2 | (-30.0) | 10.7 | (-4.27)% |
| FFO per share | $4.03 | $4.16 | $3.56 | $3.21 | — |
| FFO per share growth % | — | 3.2 | (-14.4) | (-9.8) | (-7.3)% |
| TCFO (millions) | $1584 | $1536 | $1365 | $1275 | — |
| TCFO Growth % | — | (-3.1) | (-11.1) | (-6.6) | (-6.98)% |
| Market Cap (billions) | $26.6 | $33.5 | $27.0 | $37.3 | — |
| Market Cap Growth % | — | 25.9 | (-19.4) | 38.1 | 11.93% |
Source: TD Ameritrade, CompaniesMarketCap.com, and author calculations
This company presents a mixed growth picture. Its pace of revenue and cash flow growth was mediocre before the pandemic. Like all Healthcare REITs providing direct services to patients, WELL took a major hit in the pandemic of 2020, and remained in the doldrums in 2021, even while share prices were skyrocketing.
Meanwhile, here is how the stock price has done over the past 3 twelve-month periods, compared to the REIT average as represented by the Vanguard Real Estate ETF (VNQ).
| Metric | 2019 | 2020 | 2021 | 2022 | 3-yr CAGR |
| WELL share price July 18 | $84.85 | $50.99 | $89.68 | $80.79 | — |
| WELL share price Gain % | — | (-40.0) | 75.9 | (-10.0) | (-1.62) |
| VNQ share price July 18 | $88.88 | $78.67 | $105.31 | $91.14 | — |
| VNQ share price Gain % | — | (-11.5) | 33.9 | (-13.5) | (0.84) |
Source: MarketWatch.com and author calculations
Along with other Healthcare REITs, WELL got hit especially hard by the pandemic, but share price came roaring back in 2021, despite little or no change in revenues, only to sell off again this year, a little less than the average REIT. The net effect is share price shrinkage averaging (-1.62)% annually over the last 3 years, compared to a gain of 0.84% for the VNQ over the same period.
Balance Sheet Metrics
Welltower carries a significant amount of debt. Although its debt as a percentage of its assets is solid, that debt as a multiple of EBITDA is problematic.
| Company | Liquidity Ratio | Debt Ratio | Debt/EBITDA | Bond Rating |
| WELL | 2.02 | 27% | 8.0 | BBB+/Baa1 |
Source: Hoya Capital Income Builder, TD Ameritrade, and author calculations
In June, WELL announced the addition of $5.2 billion to its credit facility. Perhaps not coincidentally, this is almost the exact amount of their offer to buy HR, which suggests they have plenty of dry powder to go after another company. Could Physicians Realty (DOC), Global Medical (GMRE), or Community Healthcare Trust (CHCT) be in its sights? All three are similar to HTA in their focus on MOBs.
Welltower had $367 million in cash and cash equivalents as of March 31, against $14.7 billion in total debt.
In March, WELL issued $550 million in senior unsecured notes at 3.85%, maturing in June 2032. The company’s ATM (at-the-market) share issuance capacity is $2.5 billion, of which they used $558.8 million in Q1 2022, leaving nearly $2 billion still available.
Dividend Metrics
Welltower pays less than the average Healthcare REIT, and the dividend cuts associated with the pandemic have left its Dividend Score unattractive. Whereas Healthcare REITs tend to out-yield the average REIT, WELL underperforms both the Healthcare sector and REITs overall. Meantime, its dividend payout ratio and safety rating are very comfortable.
| Company | Div. Yield | Div. Growth | Div. Score | Payout Ratio | Div. Safety |
| WELL | 3.01% | (-8.49)% | 2.35 | 70% | C |
Source: Hoya Capital Income Builder, TD Ameritrade, Seeking Alpha Premium
Dividend Score projects the Yield three years from now, on shares bought today, assuming the Dividend Growth rate remains unchanged.
Valuation Metrics
Despite paying a well-below-average Yield, WELL carries a relatively high price/FFO tag, and is one of the few Healthcare REITs that trades at a premium to NAV. From a value investor’s perspective, this is unattractive.
| Company | Div. Score | Price/FFO | Premium to NAV |
| WELL | 2.35 | 23.0 | 15.8 |
Source: Hoya Capital Income Builder, TD Ameritrade, and author calculations
What Could Go Wrong?
The COVID-19 pandemic has had significant adverse effects on Welltower, along with all other Healthcare REITs, and may continue to do so. The extent to which COVID-19 affects Welltower and its tenants will depend on future developments, which cannot be predicted with confidence. The virus continues to mutate, and spikes continue to happen. One such surge is currently underway in the U.K.
Welltower investor presentation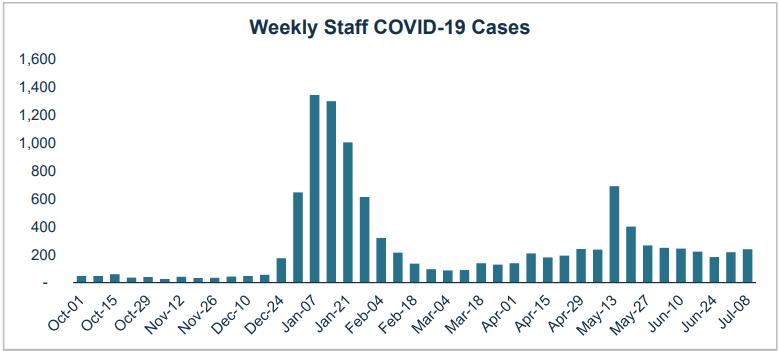
Welltower investor presentation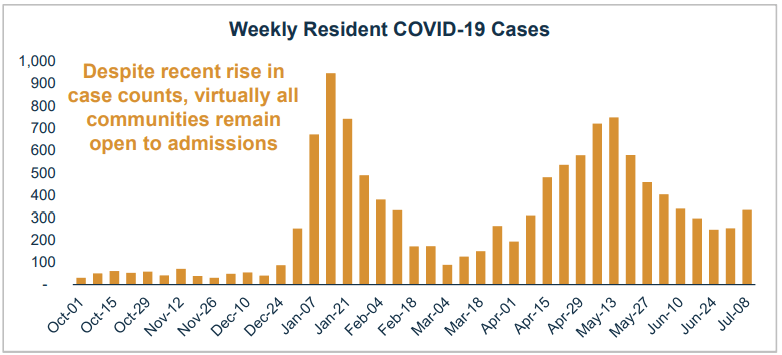
Welltower investor presentation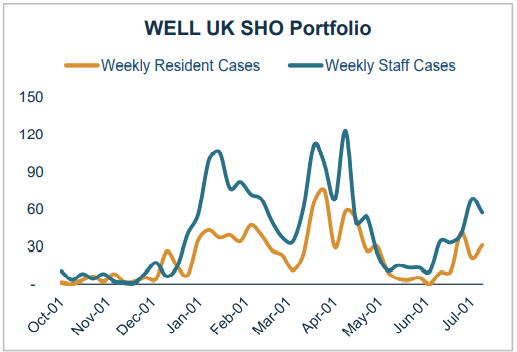
WELL’s SHOP revenues are dependent on occupancy, which has steadily increased in recent months. As of March 31, 2022, nearly all communities are open for new admissions and allowing visitors, in-person tours, and communal dining and activities.
At the same time, long-term/post-acute care facilities are generally experiencing a drop in occupancy. These factors may continue to impact the ability of WELL’s Triple-net tenants to make contractual rent payments in the future.
SHOP operating expenses likely will remain elevated during the pandemic and potentially beyond, as additional health and safety measures become standard practice. Plus, as with all senior housing operators, WELL is facing a skilled nursing shortage. I went into this in some depth in a previous article.
WELL also competes with other alternative ways of caring for seniors, such as Medicare PACE and adult foster care.
Investor’s Bottom Line
Welltower seems to be emerging from the pandemic, but it is too soon to tell. The graying of the U.S. population does favor senior housing, and medical services in general, but there are also significant headwinds, so I would want to wait and see before increasing my exposure to WELL. In addition, WELL is clearly a growth play. Its dividend yield is low by any standard, and they are taking a fairly high-stakes gamble on significant revenue growth going forward. The odds appear to be in the company’s favor, but if that growth does not materialize, or unforeseen costs or catastrophic events occur, the company could be left under a heavy debt load. Meantime, if you are holding shares of WELL, I don’t see any compelling reason to sell.
Seeking Alpha Premium
The Seeking Alpha Quant ratings concur, as do TipRanks, The Street, Zacks, and Ford Equity Research. On the other hand, Deutsche Bank, Keybanc, and Mizuho all rate Welltower as Buy or Overweight. The average price target is $94.90, implying upside of about 17%, which is not bad, but better growth plays can be found.
Be the first to comment