


DNY59
Background
Last week, the Federal Reserve approved its third consecutive interest-rate increase of 0.75% and signaled additional large increases were likely even at risk of driving the economy into recession. Stock markets immediately responded with increased volatility and sharp declines. The S&P 500 fell 1.7% while the XES and XLE fell 8.8% and 6.9% respectively. More broadly, energy led losses as U.S. crude oil declined 8% to its lowest level since January and natural gas fell 10%.
Oilfield Services: Value Matrix
Fifty-three oilfield service (OFS) equities, including several selected by the author, and the holdings of 2 large OFS ETFs (OIH and XES) were evaluated using a value matrix including factors for value, growth, profitability, ownership, and debt. The data was sourced from Seeking Alpha data after market close on Friday of last week. The complete raw data and calculations are available in a downloadable Excel file. A complete explanation of the value matrix and its factors is available in last week’s inaugural iteration of this report.
Weekly Momentum Standouts
Author, SA Data
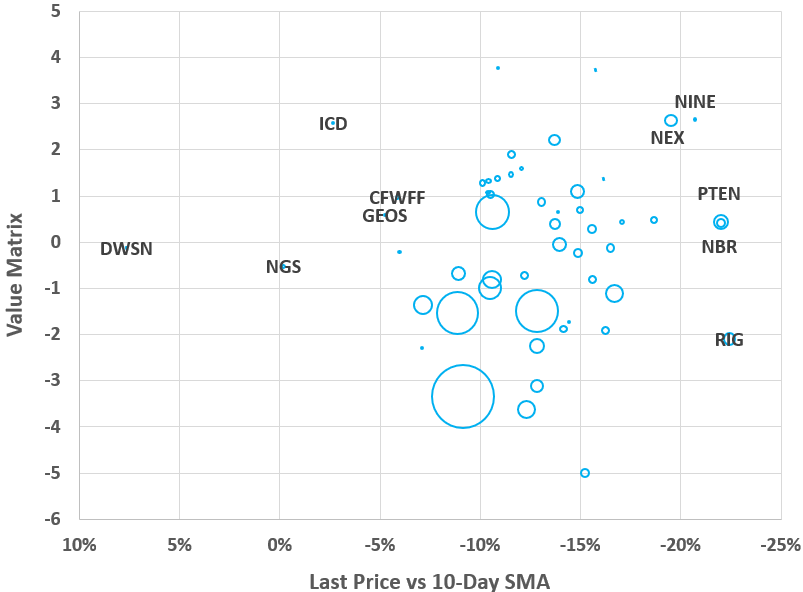
All 53 OFS providers are plotted with value matrix vs 10-Day momentum and bubble size proportional to market cap. The average last price vs 10-Day SMA for the group is -12.41%. The 10 most extreme performers by momentum are labelled. Currently, DWSN, NGS, ICD, GEOS, and OTCPK:CFWFF are the best performers on momentum, while RIG, NBR, PTEN, NINE, and NEXT are the worst.
Value Matrix: Top 10
Author, SA Data
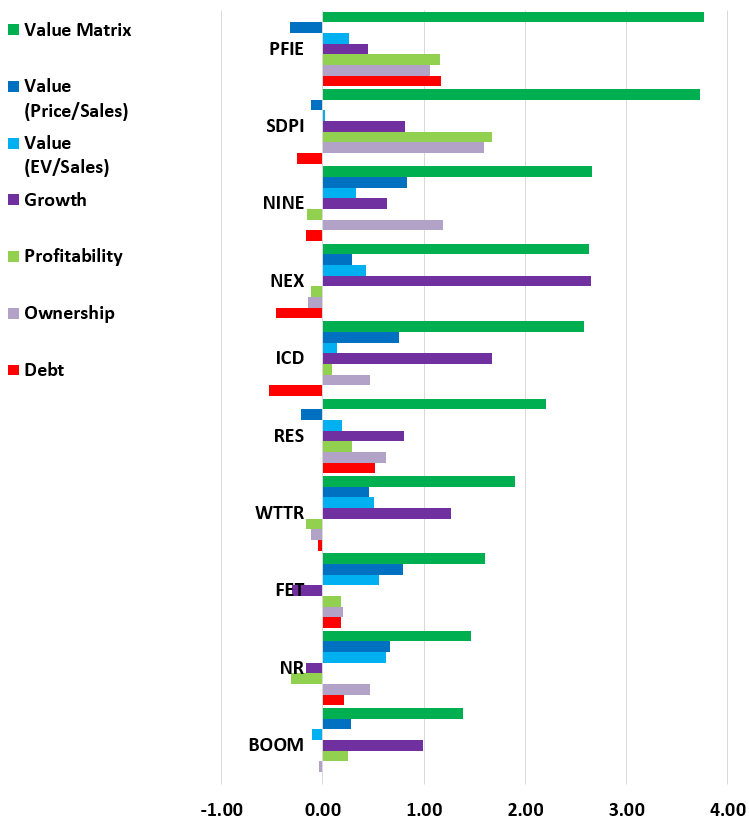
The top 10 OFS equities are plotted in descending order by value matrix score represented by the dark green bar. Notably, the top two OFS providers, PFIE and SDPI, are both microcaps headquartered a long way from Texas in Utah. The remaining top 10 OFS providers are NINE, NEX, ICD, RES, WTTR, FET, NR, and BOOM.
Value Matrix: Bottom 10
Author, SA Data
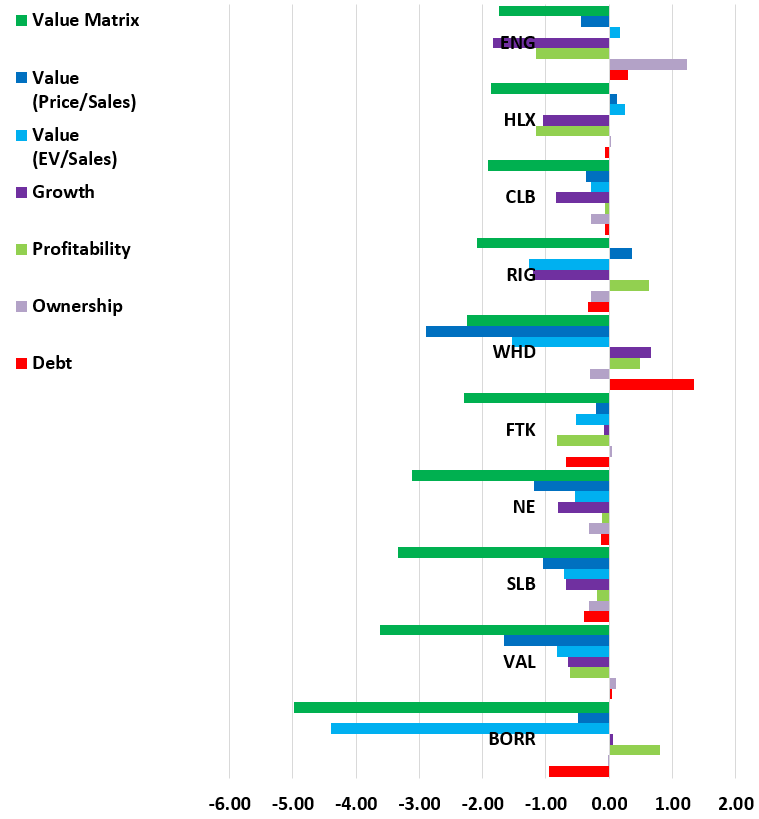
The bottom 10 OFS equities are plotted in descending order by value matrix score represented by the dark green bar. Offshore drillers, BORR and VAL, scored lowest based largely on valuation and profitability. The remaining bottom 10 OFS providers are SLB, NE, FTK, WHD, RIG, CLB, HLX, and ENG.
Chemicals and Equipment: Value vs Momentum
Author, SA Data
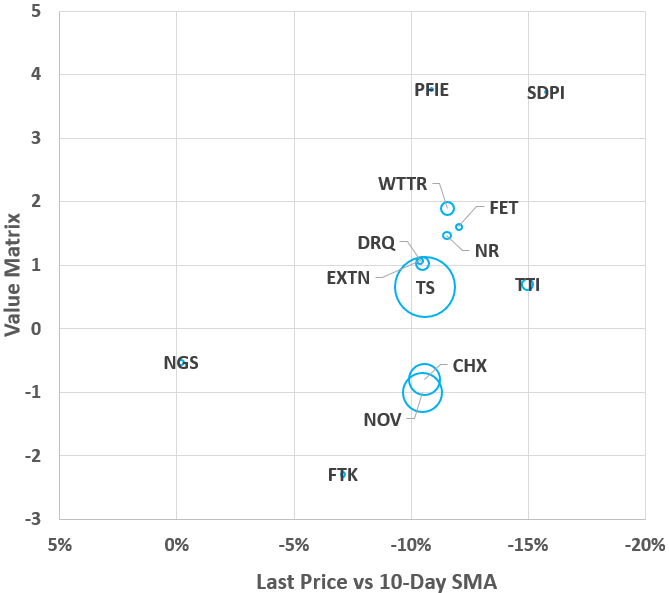
Oilfield chemicals and equipment suppliers value matrix vs 10-Day momentum is plotted with bubble size proportional to market cap. On average, the group is currently priced 10.5% below its 10-Day SMA. Smaller caps PFIE and TTI have responded sharply to market pressures while NGS was the most resistant. By value matrix, PFIE, SDPI, and WTTR score highest while FTK & NOV score lowest amongst oilfield chemicals and equipment suppliers.
Drillers: Value vs Momentum
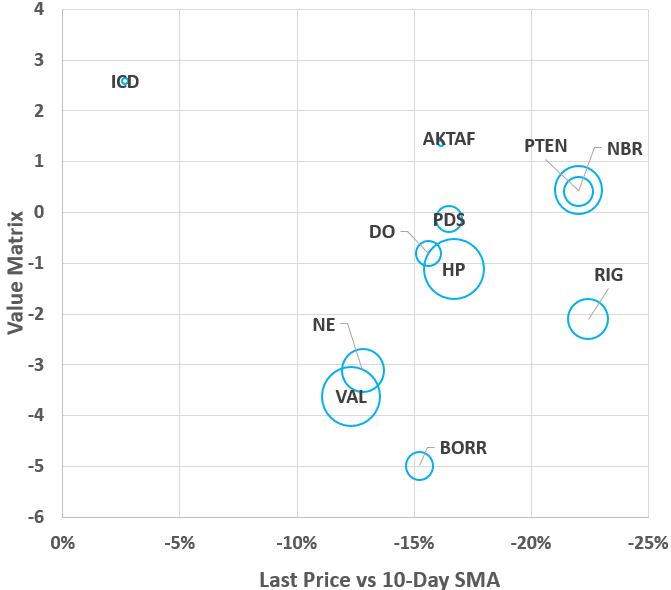
Author, SA Data
Driller value matrix vs 10-Day momentum is plotted with bubble size proportional to market cap. On average, the group is currently priced 15.85% below its 10-Day SMA. ICD appears to be most resistant to short term trends, while RIG, NBR, and PTEN have responded sharply. By value matrix, ICD & OTCPK:AKTAF, PTEN, and NBR score highest while BORR scores lowest amongst drillers.
Well Services: Value vs Momentum

Author, SA Data
Well services value matrix vs 10-Day momentum is plotted with bubble size proportional to market cap. On average, the group is currently priced 13.3% below its 10-Day SMA. Larger caps SLB and BKR appear to be resistant to short term trends, while smaller caps NINE, NEX, and OTCPK:TOLWF have responded sharply. By value matrix, NINE, NEX, & RES score highest while SLB scores lowest amongst well services providers.
Other OFS Providers: Value vs Momentum

Author, SA Data
The remaining OFS providers value matrix vs 10-Day momentum is plotted with bubble size proportional to market cap. On average, the group is currently priced 9.25% below its 10-Day SMA. DWSN is a standout currently priced 7.65% above its 10-Day SMA. By value matrix, SND, GEOS, and SLCA score highest while CLB & VTOL score lowest amongst remaining OFS providers.
Investor Takeaways
Investors should consider the value matrix a screen only. The matrix, its factors, normalization method, and weights could all be adjusted and yield different results. Further the matrix is based on the most readily available and common metrics. Some of these metrics will change rapidly with share price while others will change as new company reports are released. It does not include some company specific data available in quarterly reports and presentations. Every investment decision regarding an individual equity should be based on comprehensive analysis of that equity.
Based on the value matrix, those investors who hold BORR, VAL, SLB or any OFS with low matrix scores may wish to review their positions. OFS equities with higher matrix score may have more alpha potential. These include; PFIE, SDPI, NINE, NEX, and other OFS equities with higher matrix scores. However, the matrix and/or its factors may not forecast future price return of any of the OFS providers screened. The performance of factors considered may not be repeatable going forward; eg exceptional revenue growth may not be repeatable.
The value matrix is a screening tool only and some investors may find it to be a useful starting point. Undoubtedly, the value matrix could be improved to better screen OFS given current market conditions & available data. I encourage readers to download the Excel file and suggest improvements. Other readers may wish to modify it completely and apply a matrix based ranking to whole new set of fuzzy data. I hope some readers find it interesting, and I look forward to comments.
Why do trees conceal the splendor of their roots? – Pablo Neruda.
Be the first to comment