

Good morning and welcome to another week filled with financial, political and social drama (did I miss any?), where volatility remains high, and morale for the average sports fan remains low. There is not much to look forward to besides virtual happy hours and possibly some home cooking, if you’re lucky. This is part of my weekly series where I discuss the current market and how investors can position themselves accordingly.
QE = Quarantine Easing?
Despite the Fed lower rates and reinstating quantitative easing, this week was another tough one for risk assets. Stocks as measured by the S&P 500 (SPY), corporate bonds like Vanguard Intermediate Corporate Bonds (VCIT) and even iShares Municipals Bonds (MUB) all traded lower as default risk is rising and market liquidity is shrinking. The latter has been less obvious than the former but it is equally as important for investors. Liquidity is like the air we breathe. At any given moment, it is necessary for our survival, yet we never pay attention to it until it is missing. Investors often take liquidity for granted, especially after a decade of QE. Nevertheless, we are once again seeing signs of a lack of liquidity in the system with high yield debt not even trading (the iShares High Yield ETF (JNK) still trades), and the bid-ask spreads on 30-year Treasuries widening out to all time levels — meaning sellers cannot efficiently find buyers. It is believed this lack of liquidity is a result of the Volcker Rule limiting the risk banks can take. It is times like these when banks would provide the backstop to buy the debt that investors are trying to sell for cash. Instead of banks taking on that risk, we now have the Fed diving into its toolkit to buy treasuries and MBS to help stem the panic. Nevertheless, municipalities and corporations are seeing their cash dwindle and bonds prices fall. Perhaps these are next on the menu for the Fed to purchase? At this point, it seems like anything and everything is on the table as even Europe’s largest economy is promising an end to austerity and unleash fiscal stimulus. These sure are interesting times compared with what we were thinking a month ago.
Last Week’s Economic Indicators
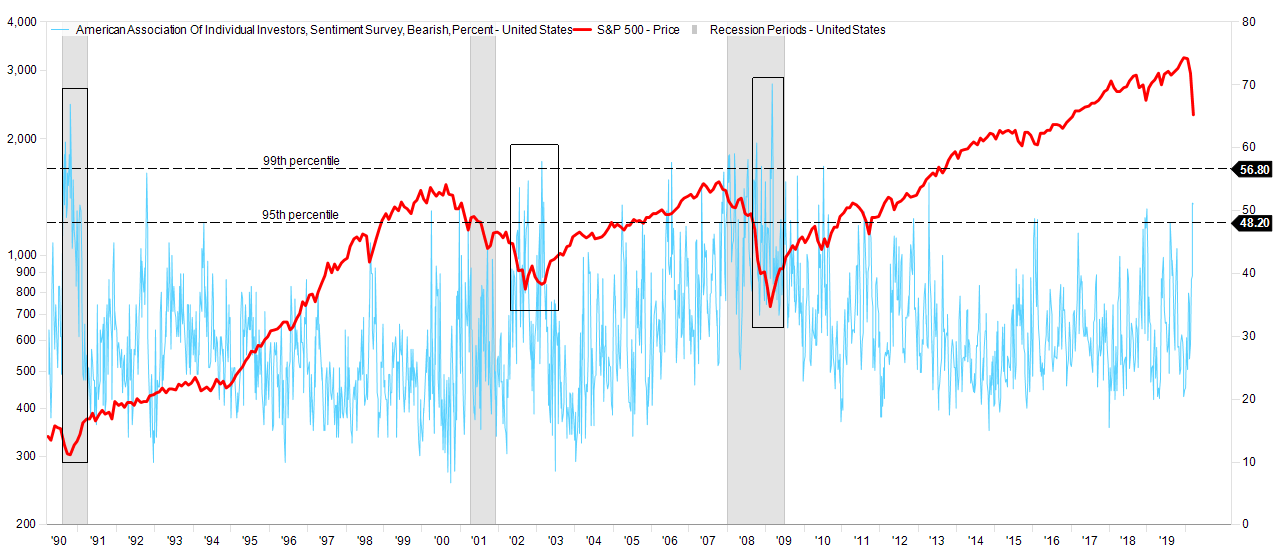
Many of last week’s indicators fell short of expectations. To my surprise, the consensus was still calling for positive results in some surveys like the NY Fed’s Empire State Index — a survey of NY manufacturing activity — which fell to -21.5. The average economist was expecting +3.0. Similarly, retail sales posted their largest negative print since December 2018. It should not have been difficult to say it will likely be negative, yet consensus was once again expecting a positive retail sales result. This is important because positive or negative surprises are a good tell of where the consensus lies — currently it is too optimistic. Another indicator that shows we still have yet to form a bottom in markets is the AAII Bull-Bear survey. Every week the American Association of Individual Investors surveys its members on if they are bullish, bearish or neutral. Over its 33-year history, it has served as a bearish majority around market bottoms. The below chart shows that 51% of investors are currently bearish. It is a good signal, yet not strong enough to say investors are too bearish. I have boxed in the major market bottoms around US recessions. Although the 95th percentile of the percentage of bears is often a reliable tactical indicator, most bear markets and recessions see a market bottom when this reading is in the 99th percentile. Look for sentiment to get more bearish before we see a market bottom.
Chart created from Factset.
Given the speed at which we have gone from making new highs in the stock market to declaring a bear market, monthly and quarterly economic data is not going to be very helpful given how much of a lag there is. At this point, the most relevant data points will be surveys, weekly data and market based indicators. On tap for next week:
3/23 Chicago Fed National Activity Index
3/24 Markit PMI, New Home Sales, Richmond Fed Index
3/24 Durable orders, FHFA Home Price Index
3/26 Initial Jobless Claims, Q4 GDP (Final Numbers), Kansas City Fed Survey, Wholesale Inventories
3/27 PCE, Personal Income, Michigan Sentiment
We will be starting off the week with one of my favorite indices: The Chicago Fed Index. This compilation of 85 indicators is a volatile series, which is why I prefer to apply a moving average to the data set, and we can see the index is in negative territory, as is the case ahead of most major equity declines. As the series puts in a bottom, expect the market to do so as well.
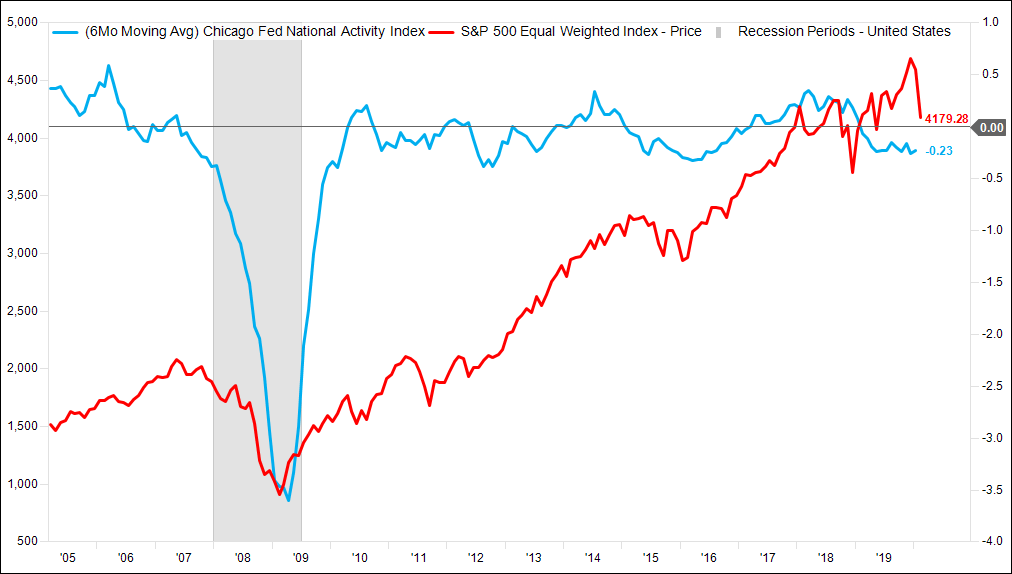
Chart created from Factset.
Tuesday will show us PMI data, a manufacturing survey that will give us a look at manufacturing over the last two weeks. Of course, the last week’s acceleration of business closures may not be fully reconciled in this survey, so it should not be a market-moving event. More important will be initial jobless claims on Wednesday. This weekly tally of new requests for unemployment insurance is one of the best leading indicators of recessions as it typically rises even before the monthly unemployment numbers show cracks in the labor market. Last week was the first spike above the 52-week trend line, and most times this happens we either had a natural disaster (i.e., a hurricane) or the beginning of a recession.
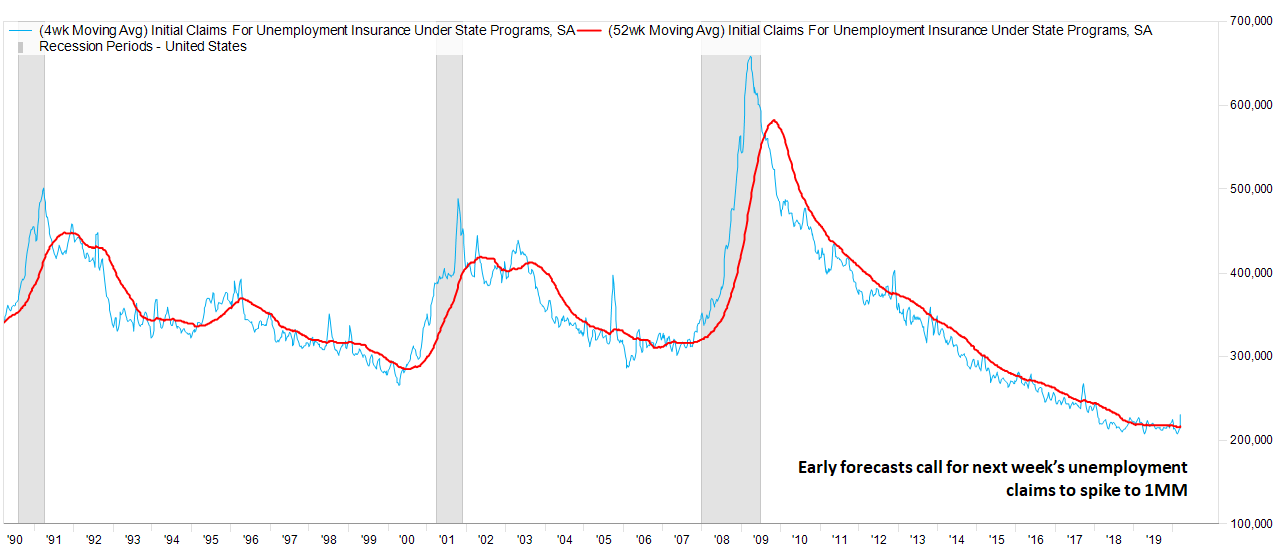
Chart created from Factset.
Credit Markets
Although much of this data is ominous, credit markets have shown some acute signs of hope given some blue chips were able to issue new debt this past week. Notable names include Goldman Sachs (GS) and Verizon (VZ) — both popular investment grade debt issuers. Otherwise, no other companies were able to issue debt last week, which is not a good sign for risk. When the debt markets close, investors tend to shy away first from the riskier companies that need the cash the most.
Reliable S&P Technical Indicator
It is important to understand a market bottom is a process and I will be watching a relative performance chart over the coming months to signal a bottom. Many who have individual stock portfolios may have started to see more and more stocks in the green towards the end of last week, despite SPY still posting a decline. This is common. I like to look at the Invesco S&P 500 Equal Weight ETF (RSP) versus SPY to see how the average stock is fairing versus the weighted average (S&P 500 is weighted by market cap). The below chart shows RSP relative to SPY during the financial crisis. Notice that although the S&P 500 bottomed on March 9, 2009, the equal weighted index began outperforming a couple months prior, and the March 9 low was higher than the previous low, meaning the average stock bottomed about three months prior to the index.
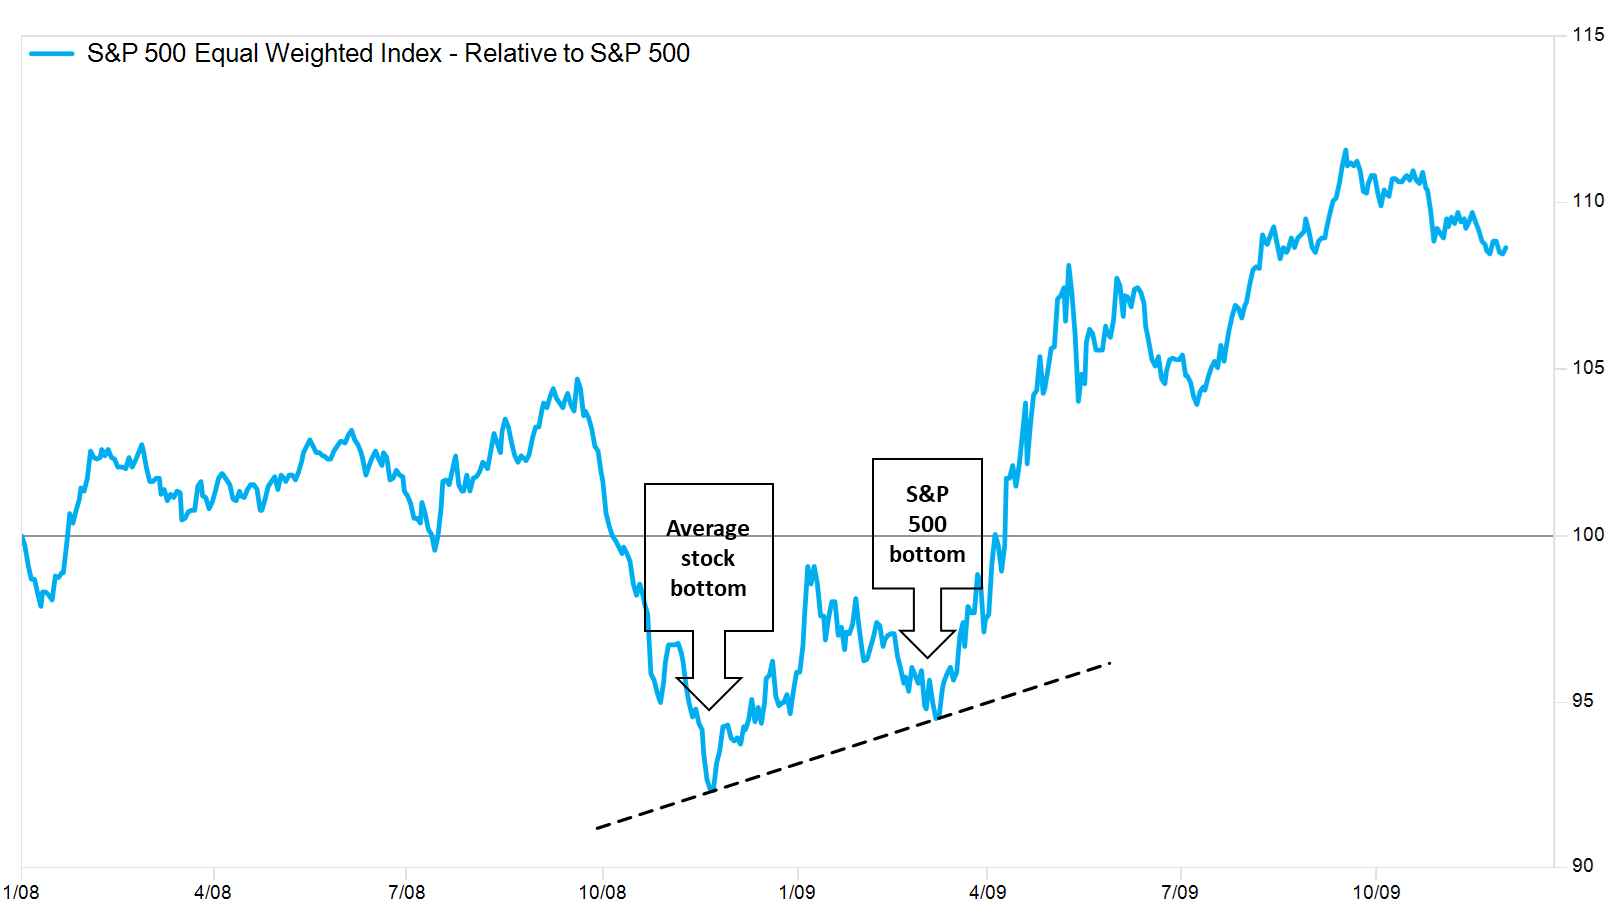
Chart created from Factset.
Here is the same relative chart around the tech bubble. Again, you see the equally weighted index (the average stock) started to outperform almost an entire year before the ultimate bottom on the index.
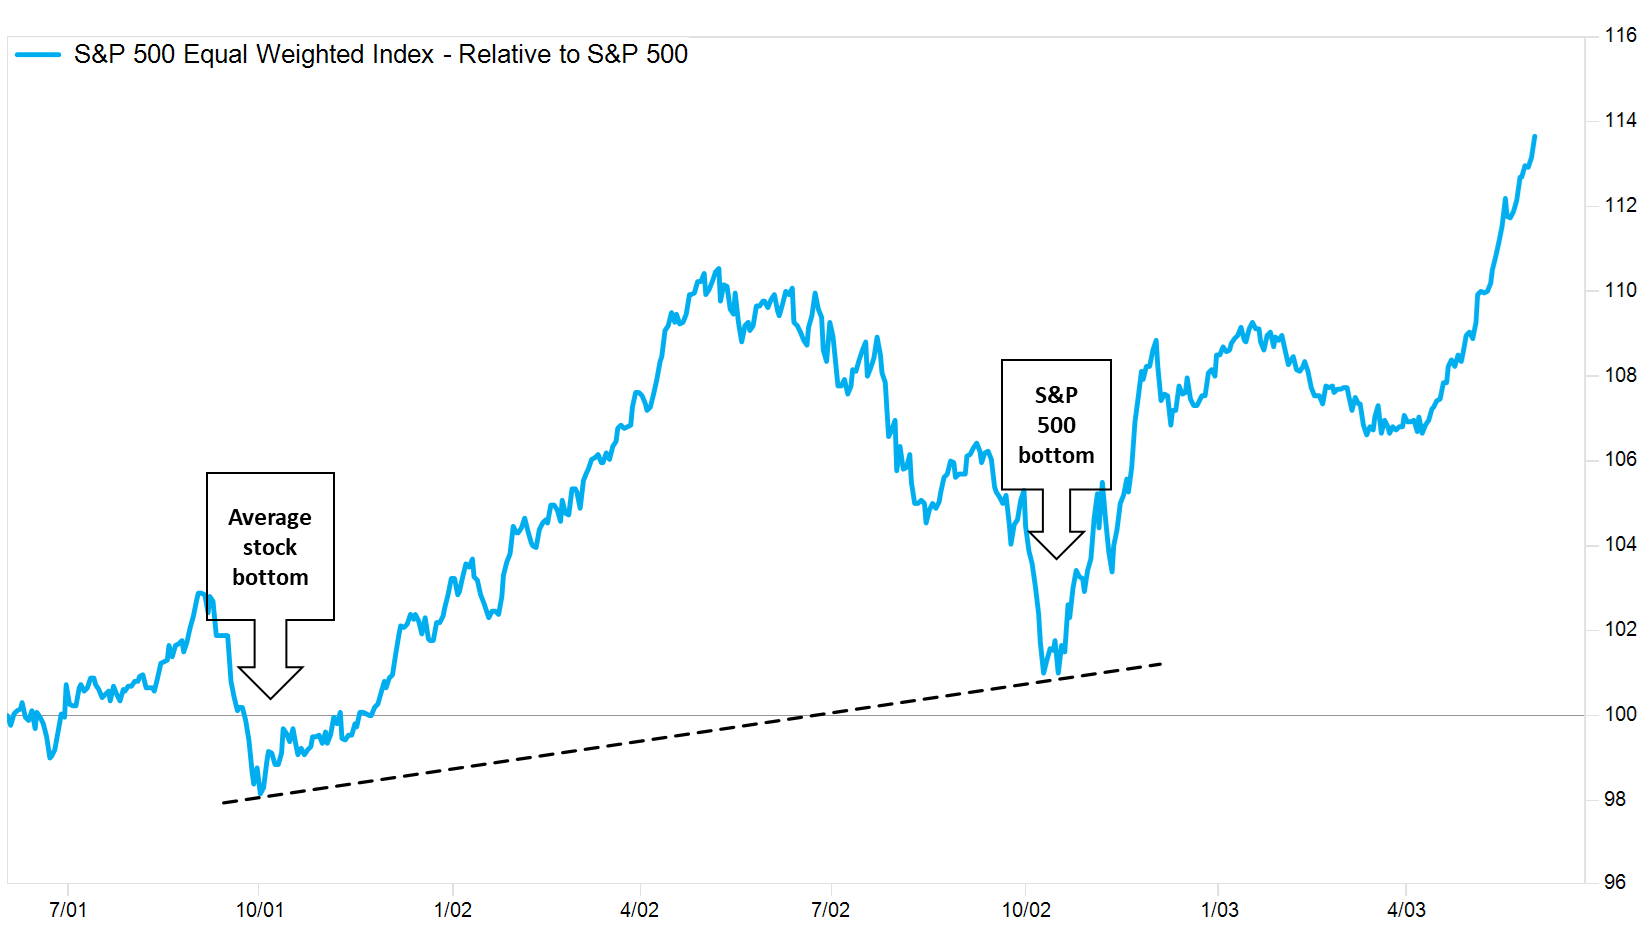
Chart created from Factset.
We have no evidence of this happening yet, As shown by the equal-weighted S&P relative performance chart taking a nose dive last week. We will need this to turn higher ahead of calling a market bottom.
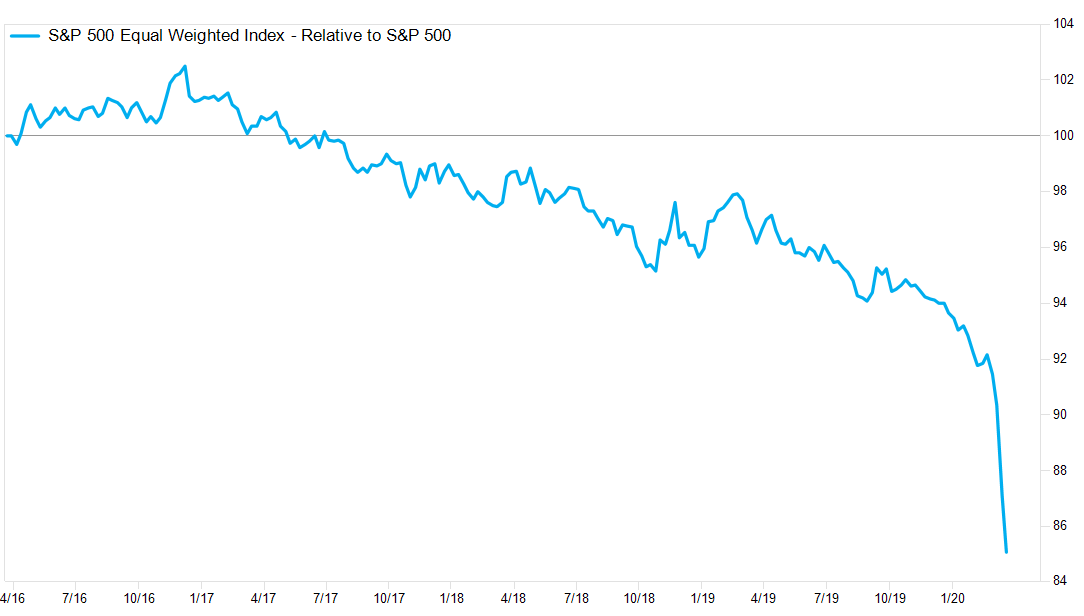
Chart created from Factset.
Let’s start the week off with optimism
I will leave you with something I genuinely believe is an actionable philosophy for longer term money. When all is said and done (yes, this will eventually end and a new bull market will emerge) the world will come out of quarantining with new perspectives around how we do things. Municipalities, students, employees, and businesses will all be left in more debt than when they started quarantining, and we will all likely come out of this will a different perspective on how to live going forward. Perhaps distance learning catches on, or more companies adopt permanent “work from anywhere” policies, or even students (and employers) giving online universities more credibility. The Financial Times recently posted an article about the remote work-from-home situation that companies are adopting has “jump-started the market by seven years” as it regards companies becoming more digitized and adopting technology out of necessity. Dealing with something as rapidly life-changing as this pandemic will be sure to leave investors scarred, but the way the world is adapting should help even the March Madness fans sleep at night. Hopefully the folks in Michigan are not too depressed in their survey results this Friday.
Stay vigilant.
Matt
Disclosure: I am/we are long SPY. I wrote this article myself, and it expresses my own opinions. I am not receiving compensation for it (other than from Seeking Alpha). I have no business relationship with any company whose stock is mentioned in this article.
Be the first to comment