


PeopleImages
Author’s note: This article was released to CEF/ETF Income Laboratory subscribers last week. Please check the latest data before investing.
The Weekly Closed-End Fund Roundup will be put out at the start of each week to summarize recent price movements in closed-end fund [CEF] sectors in the last week, as well as to highlight recently concluded or upcoming corporate actions on CEFs, such as tender offers. Data is taken from the close of Friday, August 12th, 2022.
Weekly performance roundup
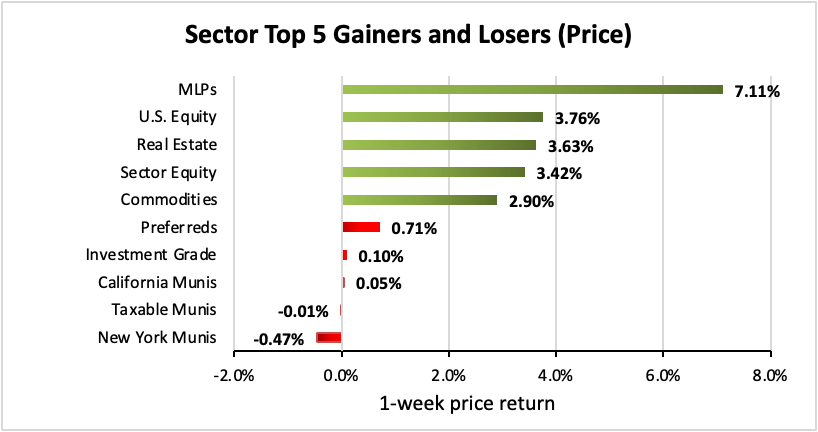
20 out of 23 sectors were positive on price (up from 19 last week) and the average price return was 1.84% (up from 0.95% last week). The lead gainer was MLPs (+7.11%) while New York Munis lagged (-0.47%).
Income Lab
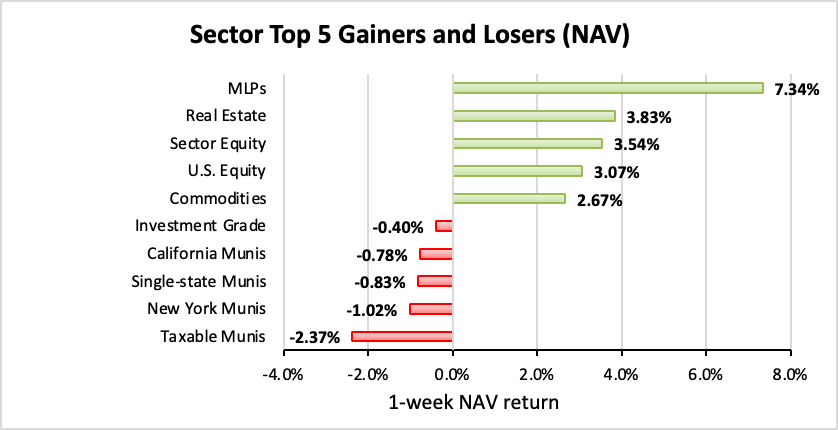
16 out of 23 sectors were positive on NAV (down from 17 last week), while the average NAV return was +1.52% (up from +0.36% last week). The top sector by NAV was MLPs (+7.34%) while the weakest sector by NAV was Taxable Munis (-2.37%).
Income Lab
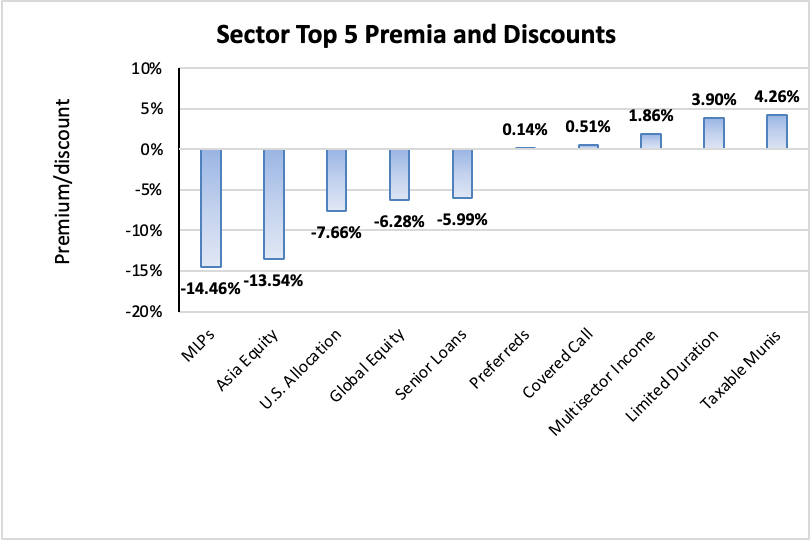
The sector with the highest premium was Taxable Munis (+4.26%), while the sector with the widest discount is MLPs (-14.46%). The average sector discount is -3.35% (up from -3.59% last week).
Income Lab
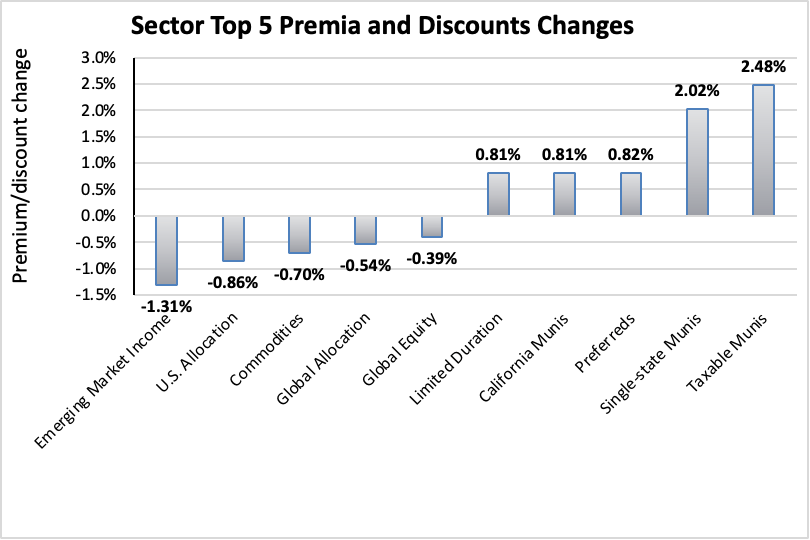
The sector with the highest premium/discount increase was Taxable Munis (+2.48%), while Emerging Market Income (-1.31%) showed the lowest premium/discount decline. The average change in premium/discount was +0.24% (down from +0.68% last week).
Income Lab
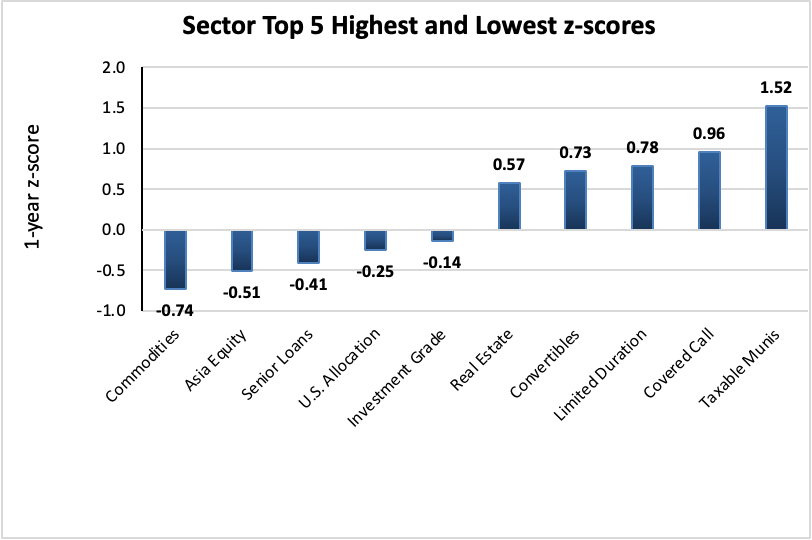
The sector with the highest average 1-year z-score is Taxable Munis (+1.52), while the sector with the lowest average 1-year z-score is Commodities (-0.74). The average z-score is +0.22 (up from -0.19 last week).
Income Lab
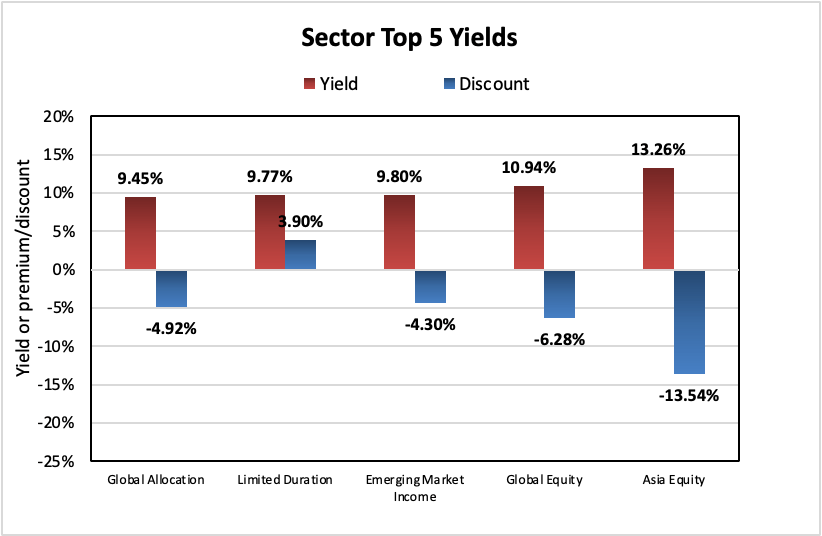
The sectors with the highest yields are Asia Equity (13.26%), Global Equity (10.94%), and Emerging Market Income (9.80%). Discounts are included for comparison. The average sector yield is +7.77% (down from +8.00% last week).
Income Lab
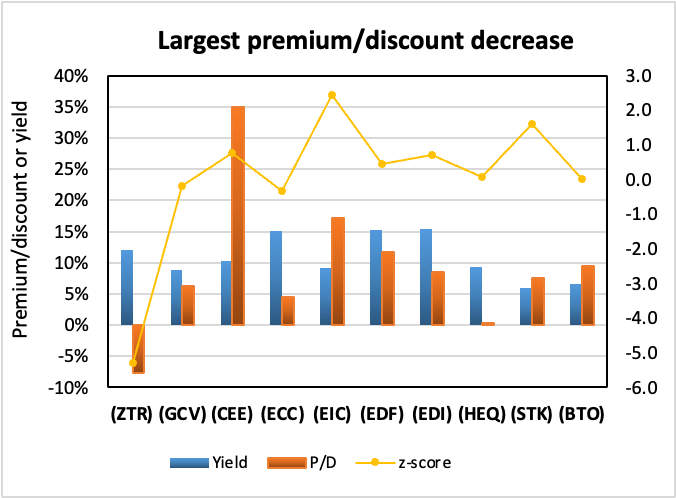
Individual CEFs that have undergone a significant decrease in premium/discount value over the past week, coupled optionally with an increasing NAV trend, a negative z-score, and/or are trading at a discount, are potential buy candidates.
| Fund | Ticker | P/D decrease | Yield | P/D | z-score | Price change | NAV change |
| Virtus Total Return Fund Inc. | (ZTR) | -15.95% | 12.11% | -7.68% | -5.3 | -13.33% | 1.66% |
| Gabelli Conv & Inc Secs | (GCV) | -11.97% | 8.81% | 6.24% | -0.2 | -6.68% | 3.85% |
| The Central And Eastern Europe Fund | (CEE) | -11.30% | 10.29% | 34.99% | 0.8 | -4.04% | 3.47% |
| Eagle Point Credit Company | (ECC) | -11.29% | 15.03% | 4.49% | -0.3 | -2.09% | 7.54% |
| Eagle Point Income Co Inc. | (EIC) | -10.49% | 9.09% | 17.23% | 2.5 | -3.24% | 3.95% |
| Virtus Stone Harbor Emerging Markets Inc | (EDF) | -8.53% | 15.22% | 11.71% | 0.5 | -3.25% | 4.15% |
| Virtus Stone Harbor Emg Mkts Total Inc | (EDI) | -7.31% | 15.41% | 8.46% | 0.7 | -2.48% | 4.10% |
| John Hancock Hedged Equity & Income Fund | (HEQ) | -4.64% | 9.35% | 0.40% | 0.1 | -1.73% | 2.81% |
| Columbia Seligman Premium Technology Gr | (STK) | -4.19% | 6.02% | 7.53% | 1.6 | -3.61% | 0.18% |
| John Hancock Financial Opportunities | (BTO) | -3.66% | 6.56% | 9.51% | 0.0 | 2.96% | 6.44% |
Income Lab
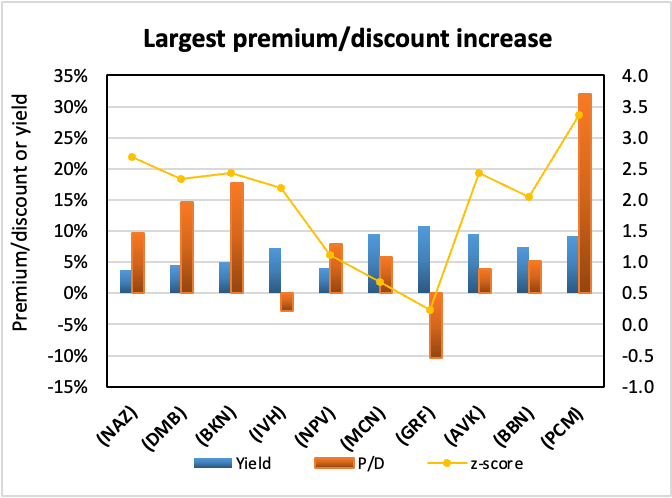
Conversely, individual CEFs that have undergone a significant increase in premium/discount value in the past week, coupled optionally with a decreasing NAV trend, a positive z-score, and/or are trading at a premium, are potential sell candidates.
| Fund | Ticker | P/D increase | Yield | P/D | z-score | Price change | NAV change |
| Nuveen AZ Quality Muni Inc. | (NAZ) | 9.77% | 3.81% | 9.68% | 2.7 | 8.86% | -0.83% |
| BNY Mellon Muni Bond Infrastructure Fund | (DMB) | 7.99% | 4.53% | 14.71% | 2.3 | 6.97% | -0.47% |
| BlackRock Invest Qual Muni | (BKN) | 7.41% | 5.04% | 17.66% | 2.4 | 5.40% | -1.22% |
| Ivy High Income Opportunities Fund | (IVH) | 6.83% | 7.33% | -2.84% | 2.2 | 9.02% | 1.36% |
| Nuveen VA Quality Muni Inc. | (NPV) | 6.11% | 4.10% | 7.91% | 1.1 | 5.04% | -0.90% |
| Madison Covered Call & Eq Strat | (MCN) | 5.15% | 9.49% | 5.86% | 0.7 | 7.97% | 2.72% |
| Eagle Capital Growth | (GRF) | 4.63% | 10.85% | -10.34% | 0.2 | 2.46% | -1.07% |
| Advent Claymore Convertible Securities & Income Fund | (AVK) | 4.19% | 9.57% | 3.89% | 2.4 | 6.68% | 2.39% |
| BlackRock Taxable Municipal Bond Trust | (BBN) | 4.18% | 7.42% | 5.13% | 2.0 | 1.36% | -2.65% |
| PCM Fund | (PCM) | 3.89% | 9.23% | 31.98% | 3.4 | 2.77% | -0.25% |
Income Lab
Recent corporate actions
These are from the past month. Any new news in the past week has a bolded date:
August 1, 2022 | Angel Oak Capital Advisors Announces the Completion of the Reorganization of Angel Oak Dynamic Financial Strategies Income Term Trust with and into Angel Oak Financial Strategies Income Term Trust.
June 30, 2022 | Gabelli Global Utility & Income Trust Rights Offering Concludes Raising $9.4 Million.
Upcoming corporate actions
These are from the past month. Any new news in the past week has a bolded date:
August 11, 2022 | Abrdn’s U.S. Closed-End Funds Announce Special Shareholder Meetings Relating to Proposed Acquisition of Assets of Four Delaware Management Company-Advised Closed-End Funds.
August 11, 2022 | RiverNorth/DoubleLine Strategic Opportunity Fund, Inc. Announces Transferable Rights Offering.
August 4, 2022 | Saba Capital Reaches Agreement Regarding Salient Midstream & MLP Fund.
August 1, 2022 | Virtus Total Return Fund Inc. Rights Offering Declared Effective.
July 22, 2022 | Delaware Investments National Municipal Income Fund Announces Self-Tender Offer for up to Fifty Percent of Its Shares.
Recent activist or other CEF news
These are from the past month. Any new news in the past week has a bolded date:
July 8, 2022 | Virtus Convertible & Income Fund II Announces Payment of Previously Declared Monthly Common Share Distribution; Reconfirms August 1 Distribution.
July 1, 2022 | Virtus Convertible & Income Fund II Postpones Monthly Distribution on Common Shares.
————————————
Distribution changes announced this month
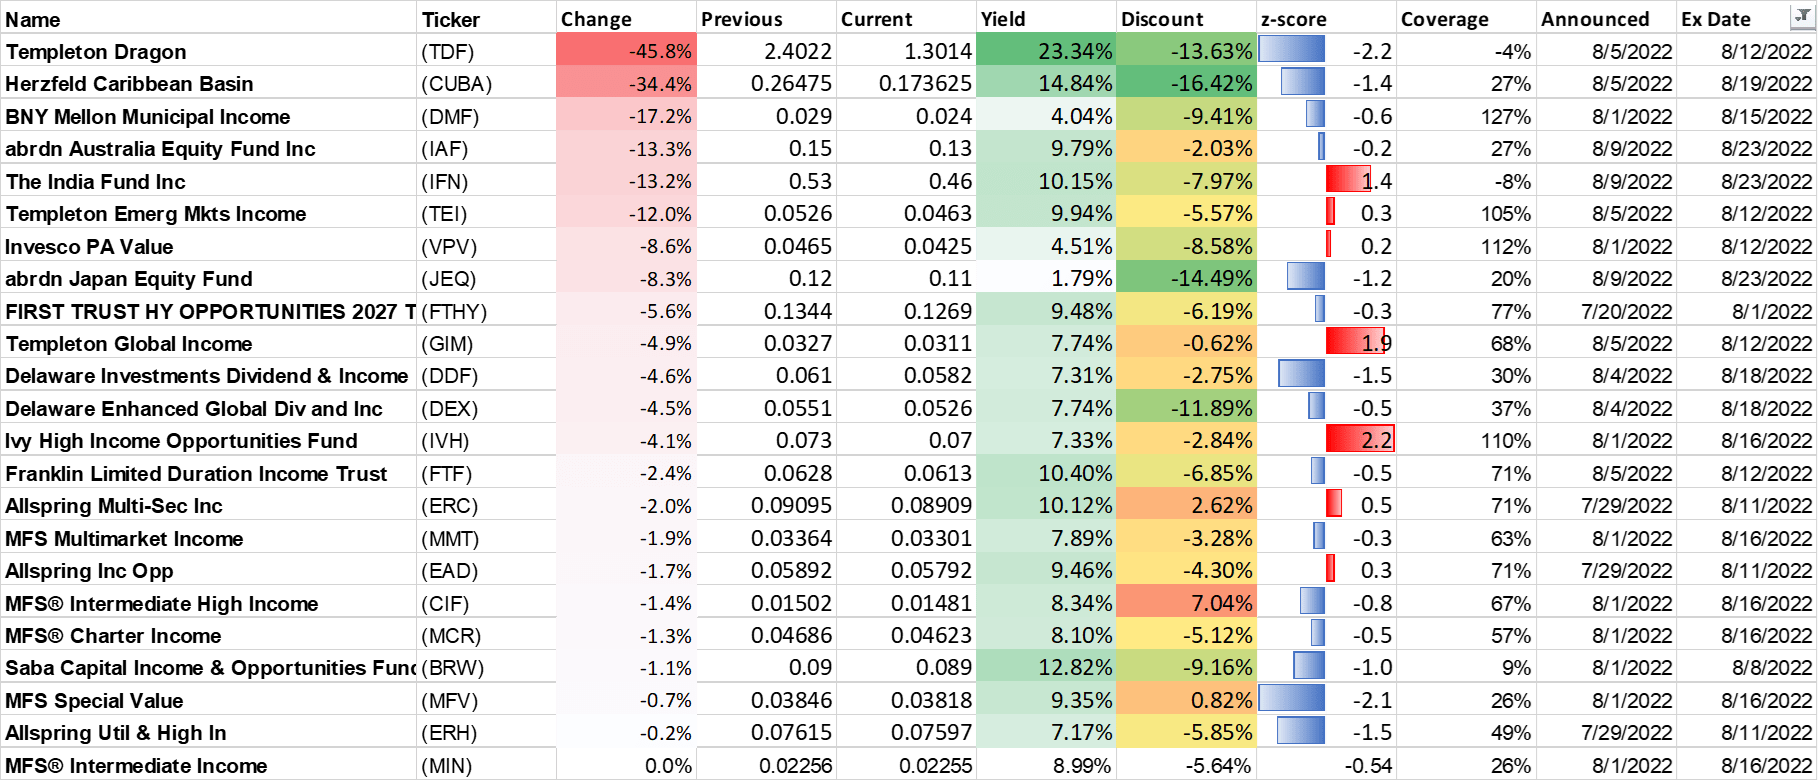
These are sorted in ascending order of distribution change percentage. Funds with distribution changes announced this month are included. Any distribution declarations made this week are in bold. I’ve also added monthly/quarterly information as well as yield, coverage (after the boost/cut), discount and 1-year z-score information. I’ve separated the funds into two sub-categories, cutters, and boosters.
Cutters
| Name | Ticker | Change | Previous | Current | Yield | Discount | z-score | Coverage | Announced | Ex Date |
| Templeton Dragon | (TDF) | -45.8% | 2.4022 | 1.3014 | 23.34% | -13.63% | -2.2 | -4% | 8/5/2022 | 8/12/2022 |
| Herzfeld Caribbean Basin | (CUBA) | -34.4% | 0.26475 | 0.173625 | 14.84% | -16.42% | -1.4 | 27% | 8/5/2022 | 8/19/2022 |
| BNY Mellon Municipal Income | (DMF) | -17.2% | 0.029 | 0.024 | 4.04% | -9.41% | -0.6 | 127% | 8/1/2022 | 8/15/2022 |
| abrdn Australia Equity Fund Inc | (IAF) | -13.3% | 0.15 | 0.13 | 9.79% | -2.03% | -0.2 | 27% | 8/9/2022 | 8/23/2022 |
| The India Fund Inc. | (IFN) | -13.2% | 0.53 | 0.46 | 10.15% | -7.97% | 1.4 | -8% | 8/9/2022 | 8/23/2022 |
| Templeton Emerg Mkts Income | (TEI) | -12.0% | 0.0526 | 0.0463 | 9.94% | -5.57% | 0.3 | 105% | 8/5/2022 | 8/12/2022 |
| Invesco PA Value | (VPV) | -8.6% | 0.0465 | 0.0425 | 4.51% | -8.58% | 0.2 | 112% | 8/1/2022 | 8/12/2022 |
| abrdn Japan Equity Fund | (JEQ) | -8.3% | 0.12 | 0.11 | 1.79% | -14.49% | -1.2 | 20% | 8/9/2022 | 8/23/2022 |
| FIRST TRUST HY OPPORTUNITIES 2027 Term | (FTHY) | -5.6% | 0.1344 | 0.1269 | 9.48% | -6.19% | -0.3 | 77% | 7/20/2022 | 8/1/2022 |
| Templeton Global Income | (GIM) | -4.9% | 0.0327 | 0.0311 | 7.74% | -0.62% | 1.9 | 68% | 8/5/2022 | 8/12/2022 |
| Delaware Investments Dividend & Income | (DDF) | -4.6% | 0.061 | 0.0582 | 7.31% | -2.75% | -1.5 | 30% | 8/4/2022 | 8/18/2022 |
| Delaware Enhanced Global Div & Inc. | (DEX) | -4.5% | 0.0551 | 0.0526 | 7.74% | -11.89% | -0.5 | 37% | 8/4/2022 | 8/18/2022 |
| Ivy High Income Opportunities Fund | (IVH) | -4.1% | 0.073 | 0.07 | 7.33% | -2.84% | 2.2 | 110% | 8/1/2022 | 8/16/2022 |
| Franklin Limited Duration Income Trust | (FTF) | -2.4% | 0.0628 | 0.0613 | 10.40% | -6.85% | -0.5 | 71% | 8/5/2022 | 8/12/2022 |
| Allspring Multi-Sec Inc. | (ERC) | -2.0% | 0.09095 | 0.08909 | 10.12% | 2.62% | 0.5 | 71% | 7/29/2022 | 8/11/2022 |
| MFS Multimarket Income | (MMT) | -1.9% | 0.03364 | 0.03301 | 7.89% | -3.28% | -0.3 | 63% | 8/1/2022 | 8/16/2022 |
| Allspring Inc Opp | (EAD) | -1.7% | 0.05892 | 0.05792 | 9.46% | -4.30% | 0.3 | 71% | 7/29/2022 | 8/11/2022 |
| MFS® Intermediate High Income | (CIF) | -1.4% | 0.01502 | 0.01481 | 8.34% | 7.04% | -0.8 | 67% | 8/1/2022 | 8/16/2022 |
| MFS® Charter Income | (MCR) | -1.3% | 0.04686 | 0.04623 | 8.10% | -5.12% | -0.5 | 57% | 8/1/2022 | 8/16/2022 |
| Saba Capital Income & Opportunities Fund | (BRW) | -1.1% | 0.09 | 0.089 | 12.82% | -9.16% | -1.0 | 9% | 8/1/2022 | 8/8/2022 |
| MFS Special Value | (MFV) | -0.7% | 0.03846 | 0.03818 | 9.35% | 0.82% | -2.1 | 26% | 8/1/2022 | 8/16/2022 |
| Allspring Util & High In | (ERH) | -0.2% | 0.07615 | 0.07597 | 7.17% | -5.85% | -1.5 | 49% | 7/29/2022 | 8/11/2022 |
| MFS® Intermediate Income | (MIN) | 0.0% | 0.02256 | 0.02255 | 8.99% | -5.64% | -0.54 | 26% | 8/1/2022 | 8/16/2022 |
Income Lab
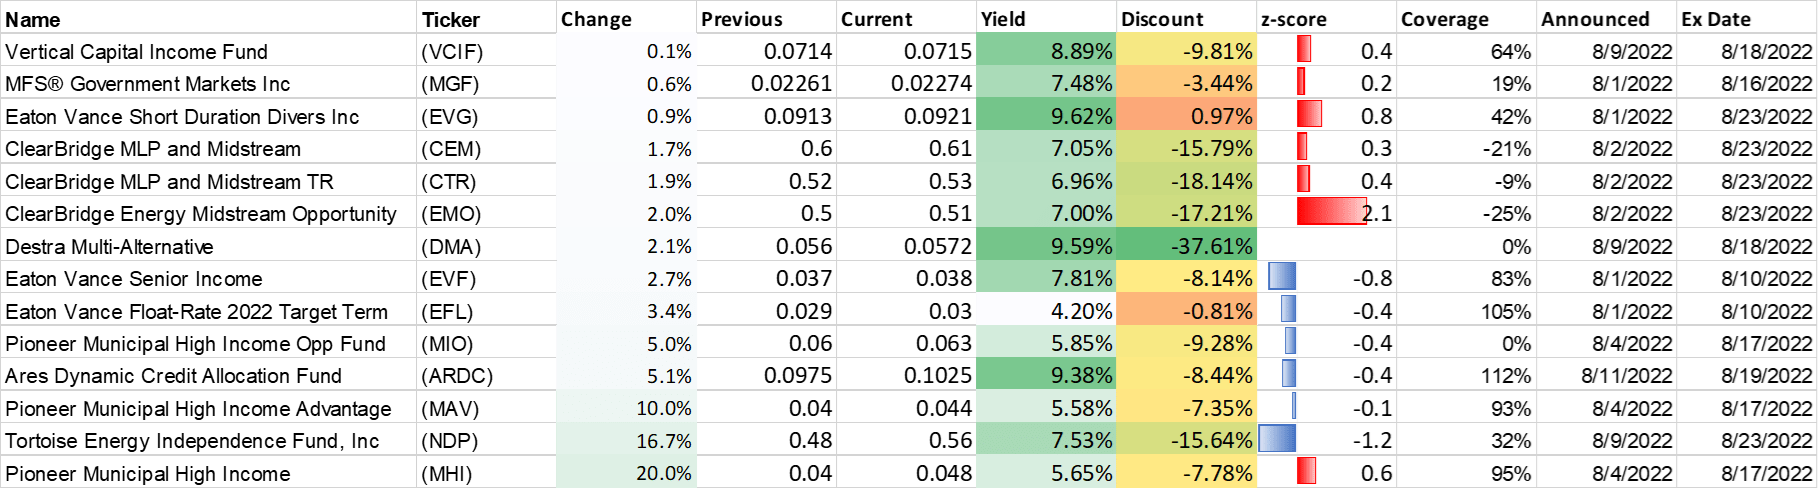
Boosters
| Name | Ticker | Change | Previous | Current | Yield | Discount | z-score | Coverage | Announced | Ex Date |
| Vertical Capital Income Fund | (VCIF) | 0.1% | 0.0714 | 0.0715 | 8.89% | -9.81% | 0.4 | 64% | 8/9/2022 | 8/18/2022 |
| MFS® Government Markets Inc | (MGF) | 0.6% | 0.02261 | 0.02274 | 7.48% | -3.44% | 0.2 | 19% | 8/1/2022 | 8/16/2022 |
| Eaton Vance Short Duration Divers Inc | (EVG) | 0.9% | 0.0913 | 0.0921 | 9.62% | 0.97% | 0.8 | 42% | 8/1/2022 | 8/23/2022 |
| ClearBridge MLP and Midstream | (CEM) | 1.7% | 0.6 | 0.61 | 7.05% | -15.79% | 0.3 | -21% | 8/2/2022 | 8/23/2022 |
| ClearBridge MLP TR | (CTR) | 1.9% | 0.52 | 0.53 | 6.96% | -18.14% | 0.4 | -9% | 8/2/2022 | 8/23/2022 |
| ClearBridge Energy Midstream Opportunity | (EMO) | 2.0% | 0.5 | 0.51 | 7.00% | -17.21% | 2.1 | -25% | 8/2/2022 | 8/23/2022 |
| Destra Multi-Alternative | (DMA) | 2.1% | 0.056 | 0.0572 | 9.59% | -37.61% | 0% | 8/9/2022 | 8/18/2022 | |
| Eaton Vance Senior Income | (EVF) | 2.7% | 0.037 | 0.038 | 7.81% | -8.14% | -0.8 | 83% | 8/1/2022 | 8/10/2022 |
| Eaton Vance Floating-Rate 2022 Target Term | (EFL) | 3.4% | 0.029 | 0.03 | 4.20% | -0.81% | -0.4 | 105% | 8/1/2022 | 8/10/2022 |
| Pioneer Municipal High Income Opp Fund | (MIO) | 5.0% | 0.06 | 0.063 | 5.85% | -9.28% | -0.4 | 0% | 8/4/2022 | 8/17/2022 |
| Ares Dynamic Credit Allocation Fund | (ARDC) | 5.1% | 0.0975 | 0.1025 | 9.38% | -8.44% | -0.4 | 112% | 8/11/2022 | 8/19/2022 |
| Pioneer Municipal High Income Advantage | (MAV) | 10.0% | 0.04 | 0.044 | 5.58% | -7.35% | -0.1 | 93% | 8/4/2022 | 8/17/2022 |
| Tortoise Energy Independence Fund, Inc. | (NDP) | 16.7% | 0.48 | 0.56 | 7.53% | -15.64% | -1.2 | 32% | 8/9/2022 | 8/23/2022 |
| Pioneer Municipal High Income | (MHI) | 20.0% | 0.04 | 0.048 | 5.65% | -7.78% | 0.6 | 95% | 8/4/2022 | 8/17/2022 |
Income Lab
Strategy statement
Our goal at the CEF/ETF Income Laboratory is to provide consistent income with enhanced total returns. We achieve this by:
- (1) Identifying the most profitable CEF and ETF opportunities.
- (2) Avoiding mismanaged or overpriced funds that can sink your portfolio.
- (3) Employing our unique CEF rotation strategy to “double compound“ your income.
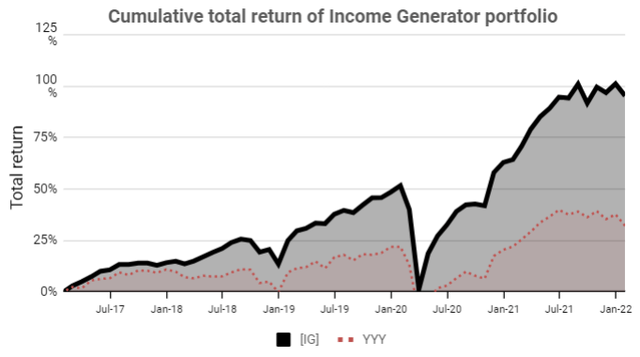
It’s the combination of these factors that has allowed our Income Generator portfolio to massively outperform our fund-of-CEFs benchmark ETF (YYY) whilst providing growing income, too (approx. 10% CAGR).
Income Lab
Income Lab
Remember, it’s really easy to put together a high-yielding CEF portfolio, but to do so profitably is another matter!
Be the first to comment