

tolgart/iStock via Getty Images
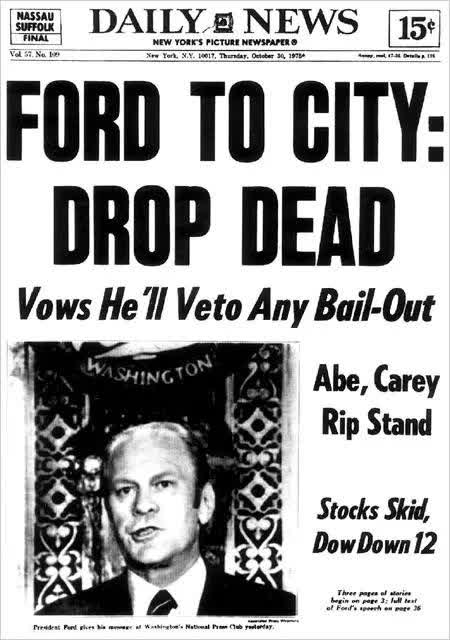
Fed to Wall Street: Drop Dead
“How far do we think the Fed will go in their new excellent adventure of QT? We don’t know. The Fed’s new mission will be to put a top in inflation, not a bottom in asset prices. Another easy forecast based on the Fed’s long history, we are sure they will proceed until Powell & Co. breaks something – the bond market, the stock market, or the junk bond market.”
Wedgewood Partners, April 2022.
“My main message has not changed since Jackson Hole. The FOMC is strongly resolved to bring inflation down to 2%, and we will keep at it until the job is done.”
Jerome Powell, September 2022.
“There is no gadgetry in monetary mechanisms and no device that will save us from our sins. We’re going to have a good deal of pain and suffering before we can solve these things.”
Fed Chair William McChesney Martin, June 1969.
Review and Outlook
|
3Q |
YTD |
1-Year |
3-Year |
Inception |
|
|
Wedgewood SMID Composite Net |
-5.3 |
-29.5 |
-21.5 |
9.0 |
8.2 |
|
Russell 2500 Index |
-2.8 |
-24.0 |
-21.1 |
5.4 |
5.4 |
|
Returns are presented net of fees and include the reinvestment of all income. “Net (Actual)” returns are calculated using actual management fees and are reduced by all fees and transaction costs incurred. |
Top performance detractors for the third quarter include Helen of Troy (HELE), FormFactor (FORM), Steven Madden (SHOO), Leidos (LDOS), and Burlington Stores (BURL). Top performance contributors include Computer Services (OTCQX:CSVI), Texas Pacific Land (TPL), The Toro Company (TTC), Acuity Brands (AYI), and Saia (SAIA).
During the quarter we trimmed PVH Corp (PVH). and bought Gildan Activewear (GIL).
|
Q3 Top Contributors |
Avg. Wgt. |
Contribution to Return |
|
|
Computer Services |
3.80 |
1.31 |
|
|
Texas Pacific Land |
5.82 |
0.93 |
|
|
The Toro Company |
1.64 |
0.19 |
|
|
Acuity Brands |
5.07 |
0.10 |
|
|
Saia |
5.79 |
0.06 |
|
|
Q3 Bottom Contributors |
Avg. Wgt. |
Contribution to Return |
|
|
Helen of Troy |
2.66 |
-1.31 |
|
|
FormFactor |
3.25 |
-1.25 |
|
|
Steven Madden |
4.93 |
-0.80 |
|
|
Leidos |
5.60 |
-0.71 |
|
|
Burlington Stores |
3.19 |
-0.54 |
|
| Portfolio contribution calculated gross of fees. The holdings identified do not represent all of the securities purchased, sold, or recommended. Returns are presented net of fees and include the reinvestment of all income. “Net (actual)” returns are calculated using actual management fees and are reduced by all fees and transaction costs incurred. Past performance does not guarantee future results. Additional calculation information is available upon request. |
Helen of Troy was a detractor in the quarter as the Company continues to deal with a variety of headwinds. The Company’s healthcare and housewares businesses were major beneficiaries during the pandemic, and both we and the Company have been expecting a normalization of demand in this business. Further, the post-pandemic normalization of demand patterns at major customers such as Walmart (WMT), Target (TGT), and Amazon (AMZN) have further weighed on the Company – both in terms of fundamentals and in terms of market sentiment, plus stock valuation.
Finally, decades-high inflation in key consumer staples categories such as food and other necessities has diverted some spending away from the more discretionary product categories supplied by Helen of Troy. Despite all these headwinds, the Company has been able to hold on to most of the business that it gained during the Pandemic.
Revenues in the most recent quarter were +26% above the same quarter two years ago, and we find the stock’s valuation to be extremely attractive at the moment, at levels last seen in the 2008-2009 recession period, when the Company was under former (and, in our opinion, inept) management.
FormFactor detracted from performance after the Company gave a third quarter outlook that reflected a substantial year-on-year decline in profitability. One of FormFactor’s largest customers, Intel, delayed some product introductions due to engineering problems. In addition, demand for PC’s and smartphones have slowed from recent Pandemic highs which caused some FormFactor customers to pause product development as they reevaluate the demand environment.
Despite these near-term pauses, the semiconductor industry’s long-term trend of reinvesting of greater than +20% of revenues into R&D is still intact. Demand for FormFactor test cards is a function of that new product development and should serve to support attractive growth at FormFactor’s over the next several years.
Steve Madden continued to reap the benefits of its competitively advantaged supply chain and generated a sterling +35% increase in revenue with similar growth in earnings per share. Many retail vendors have been struggling to replenish their own stores, let alone wholesale customers with inventory, but Steve Madden has done an excellent job fulfilling customer needs and is able to take ample pricing as a result. Many of the Company’s smaller competitors cannot meet demand as they were hobbled, if not completely wiped out, by the Pandemic induced shutdowns over the past few years.
As economies continue to re-open, Steve Madden should continue to compound its market share gains at increasingly attractive returns, not unlike how the industry evolved in the aftermath of the 2008-2009 financial crisis. With the stock trading at a multi-decade low forward earnings multiple, we continue to view shares as an attractive opportunity.
Leidos detracted from performance as the Company’s book-to-bill came in below market expectations. The significant change in the global defense situation to date has caused some near-term pauses and noise around the ramping of different projects and priorities. Leidos is positioned exceedingly well as a defense contractor, particularly to the U.S. and its allies, as we expect a significant increase in U.S. government defense and civilian spending during fiscal 2023.
This increased spending should in turn flow through to Leidos’ order book, as it focuses on modernizing IT environments and cybersecurity. We continue to hold Leidos as a top weighting because it still trades at an historically attractive forward earnings multiple, despite outperforming year to date.
Burlington Stores posted another difficult quarter of results, with comparable store sales (“comps”) declining -17%. The reported comp was also against a steep year ago result that was boosted by stimulus spending and post-pandemic reopening, but the Company has been caught off guard by dramatic short-term shifts in consumer behavior and found itself in more direct competition with major retailers in the near term.
Further, inflation in the Company’s supply chain has more than offset the margin benefits of ample merchandise availability. While other off-price retailers have also been challenged recently, Burlington is further behind the maturity curve in fully embracing the off-price model, so it is not overly surprising that Burlington’s results have been weaker. The Company continues to possess multiple levers to pull over the next several years that will lead to better growth and returns, regardless of macroeconomic pressures.
Computer Services was a top contributor to performance during the quarter. The Company agreed to be acquired by Centerbridge Partners LP and Bridgeport Partners for a substantial premium. CSI provides core processing services to small banks (typically less than $5 billion in assets). The Company also sells regulatory compliance solutions to banks as well as nonbank financial technology companies.
We added to CSI positions earlier this year after the stock traded to attractive historical multiples. At the time, the market seemed to be ignoring solid long-term demand trends coming from the core banking software industry. We plan to use CSI as a source of funds as the stock trades near the offer price from Centerbridge and Bridgeport.
Texas Pacific Land was a top contributor to performance during the quarter. Revenue vaulted over +80% as oil and gas royalties more than doubled and water sales nearly doubled. Most of this was driven by higher realized prices on the production of oil and gas on the Company’s acreage, but production of oil and gas also grew +21%. The Company’s royalty interests span more than 880,000 acres in West Texas. Most of this land is in the highly productive Delaware Basin of the Permian Basin.
We expect that development activity will continue to grow at a rapid pace in this region, primarily driven by both domestic and multinational producers looking to maximize returns on increasingly scarce oil and gas capital expenditures. Further, as the tragic war in Ukraine has unfolded, energy security has become an increasingly important issue for countries around the globe.
The production of hydrocarbons on the Company’s acreage represents a “port in the storm” for the U.S. – and for allies that are dependent on the energy of hostile countries. It is difficult to know how any specific policy will evolve, but we think having a commanding acreage position in the most productive regions in the country puts the Company in an excellent position to help.
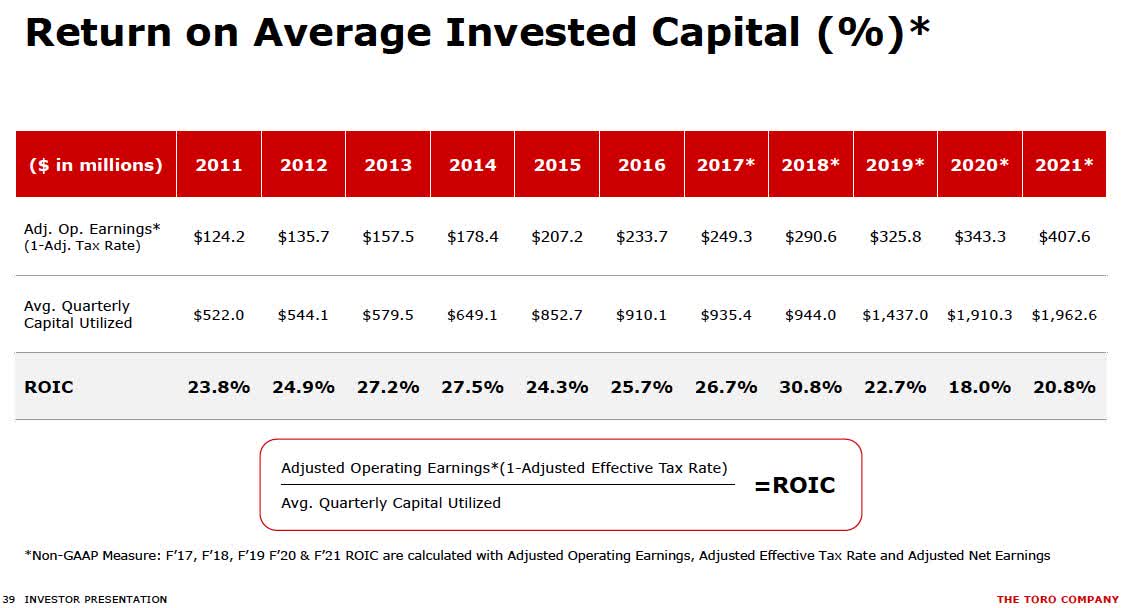
Toro contributed favorably to performance during the quarter. The Company benefitted from pricing actions it took earlier in the year, offsetting rising input cost inflation. An important proof-point we consider when evaluating the competitive advantage of any business is whether margins can be maintained (or expanded), especially during periods of inflation.
In addition, Toro continues to see robust demand for its professional and residential products. The Company has a backlog in its professional segment that is at its highest level since the year began, whereas residential products grew +7% on strong year and 2-year comparisons and despite many “home” categories across big-box retailers witnessing declines.
Acuity Brands contributed to portfolio performance as the Company continued to generate strong revenue growth while protecting margins in the face of a particularly difficult inflationary environment. The Company’s fiscal fourth quarter results (released in early October) reflected +12% revenue growth with over +15% adjusted operating margins that are near all-time highs from a year ago.
Acuity is managing inflationary pressure by constantly re-engineering their lighting and control products while also enacting more than a half-dozen price increases over the past 2 years. The Company’s backlog continues to build as commercial office, education and industrial facilities owners invest in much needed renovations. The secular move toward more energy-efficient commercial lighting solutions is a long-term driver for Acuity products. For example, California recently banned the sale of compact and linear fluorescent lamps.
Although Acuity does not sell lightbulbs, it stands to benefit from future demand for luminaires and lighting controls for LED units that will inevitably replace these fixtures.
Saia was a top contributor to performance after posting +16% increase in revenue per shipment (excluding fuel surcharges) leading to +76% growth in operating income on a +5% improvement in its operating ratio. Saia is a best-in-class operator that should be able to drive a long-term operating ratio into the 70s. In addition, we expect Saia’s increased investments in capacity should allow the Company to post attractive growth throughout the economic cycle.
Company Commentaries
Leidos
As we continue to familiarize our clients with our Focused SMID portfolio, we wish to introduce Leidos, one of our largest holdings in the portfolio. Leidos is a technology, science, and engineering service provider primarily to the U.S. government, with a significant focus on the U.S. military and intelligence communities. Large customers include the U.S. Department of Defense (DoD), the U.S. Intelligence community, the Department of Homeland Security, and Federal Aviation Administration, plus the Department of Veteran Affairs.
Aside from the U.S. government, which represents nearly 90% of the Company’s revenues, Leidos also provides services to some commercial customers and to allied foreign governments and their military and intelligence services. Leidos has grown over several decades from a base of scientific and engineering expertise into a provider of a variety of services, retaining a primary focus on advanced technological areas, but spreading into many tangential areas where the Company’s scale, and its long relationships with its customer base, have allowed it grow.
Our thesis behind our initial purchase in September 2020 was fairly straightforward: in a strong market at high valuations, Leidos generated solid growth at attractive returns, it had demonstrated strategic and financial competence in a series of acquisitions and divestitures over the previous several years, and it was trading at an attractive valuation by its own historical standards and in relation to the broad market.
Although we have built the stock into a significant position as fundamentals have evolved over time, we took only a small initial position because the attractive valuation, to a large degree, was driven by the market’s caution around the Company’s intermediate-term outlook in the case of an election victory for the Democrats – with the Company primarily viewed by the market as a defense contractor, the market tends to see greater opportunities for Leidos, and the rest of the defense industry, under a Republican rather than a Democratic administration.
If you consult the graph below, showing a 20-year illustration of the market’s valuation of the broad S&P 500 Aerospace & Defense subsector, you will see how the market has reacted to changes in U.S. administrations, especially early in each president’s term. Of course, the Democrats did win control of both the presidency and Congress, and the market did in fact take a dim initial view on the future prospects for the defense industry.
20-year graph of S&P 500 Aerospace & Defense subsector’s Price-to-FY2 Earnings
20 year graph of S&P 500 Aerospace & Defense subsector’s Price-to-FY2 Earnings (Source: FactSet)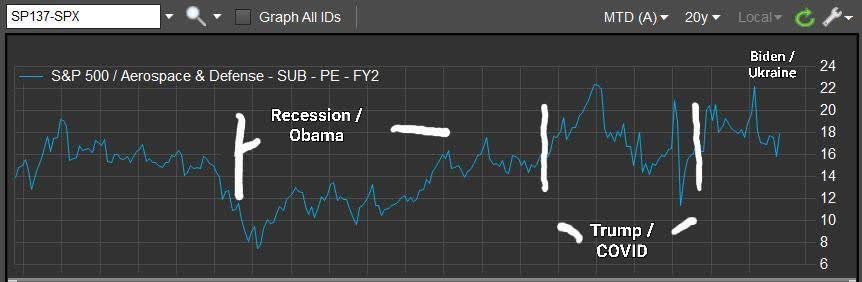
During our initial work on Leidos, and continuing during the early part of our holding period, several things made us comfortable with the company’s fundamental outlook, despite the fact that valuation expansion opportunities would be unlikely for some time. For example, commentary from the Biden campaign during the election indicated it was unlikely that the defense budget, or its priorities, would change drastically.
Long before anyone feared that an actual shooting war might break out, we thought any risk to the defense budget was more likely to be in areas such as weapons, fighter jets, or missile systems; we expected a continuation of focus, however, in areas such as intelligence gathering and analysis, cybersecurity, and technological upgrades – all areas in which Leidos operates at scale.
Despite the market’s worries about possible Democratic cuts to the defense budget, President Biden’s initial request for the Fiscal Year 2022 DoD budget – his first as president – came in at $715 billion, which represented a modest 1.6% increase to the FY2021 budget. Congress eventually added to this request, though, and the final DoD budget ended up at $740 billion, or a greater than 5% increase.
We note that within this budget, the DoD’s Research, Development, Test, and Evaluation funding – areas of focus for Leidos – increased more than 10% to greater than $120 billion. Then, early in 2022, the world’s military and political situation changed dramatically, with Russia’s invasion of Ukraine. This, unfortunately, as it were, has resulted in several emerging long-term benefits for Leidos.
First, and most importantly, the funding environment for Leidos’s largest customer, the U.S. DoD, has improved significantly. Although the Biden administration’s initial FY2023 DoD budget request called for a roughly 4% increase in funding, Congress added to the budget considerably, eventually approving an increase greater than 10%.
This budget again saw record funding for the DoD’s Research, Development, Test, and Evaluation accounts; although we have not seen a final number for this yet, the initial request of $130 billion would represent an increase of approximately 8%. We also note that Congress has approved tens of billions of incremental dollars of emergency Ukraine-related funding within the FY2022 budget.
Second, we would point out that the spending outlook for the U.S. military allies also suddenly looks much better. Although Leidos’s exposure to government customers outside of the U.S. is much lower (currently less than 10% of revenues), we think this portion of the business can grow considerably. While we will not quote a variety of news headlines from the United Kingdom, Germany, Canada, and other NATO allies, as well as from Australia, concerning current and longer-term defense spending upgrades, we will share the graphic below to highlight the potential opportunity from the U.S. allies.
As you may know, NATO’s defense ministers agreed in 2006 to spend at least 2% of their countries’ GDP on defense; however, as you will see below, most countries in the alliance have not been doing so. We have struggled to find an exact number for what the non-US NATO members spend as a percentage of GDP, but we estimate, using a variety of sources, that this number was perhaps 1.5-1.75% of GDP prior to the Ukraine war.
NATO Defense Spend
NATO Defense Spend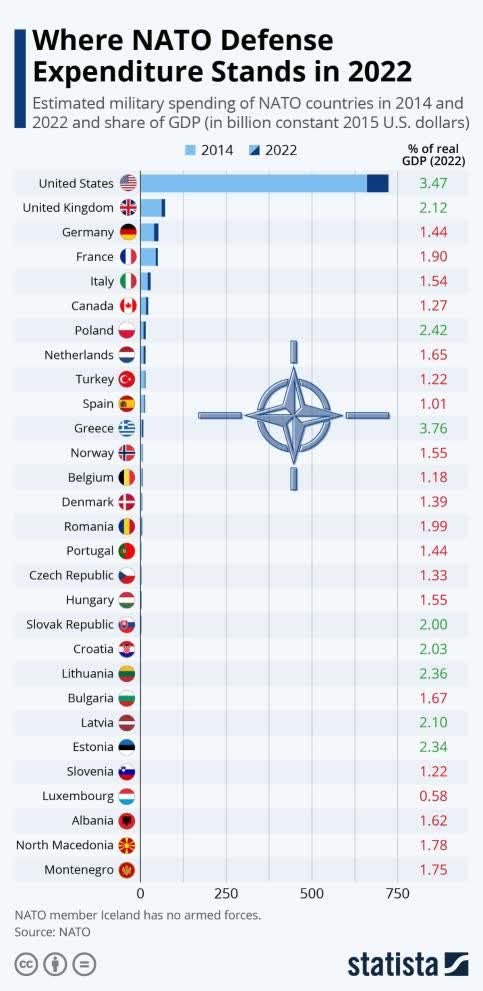
Furthermore, as you can see below, total defense spending by the alliance outside of the U.S. actually fell by more than -$50 billion in real terms (at 2015 dollars and exchange rates) in the 25 years between 1989 and 2014 despite the addition of 12 new countries to the alliance in that time.
Between Russia’s invasion of Crimea in 2014, and NATO’s recommitment to the 2% of GDP spending targets in response to pressure from the Trump administration, you can see that NATO ex-U.S. spending has recovered significantly in the past 8 years, although total spending by the non-U.S. portion of the alliance is still only roughly 6% higher than 1989 levels in real, 2015-indexed terms.
If we use NATO’s estimate of $328 billion of spending by the non-U.S. portion of the alliance and use our best guess that this represents perhaps 1.65% of those nations’ GDP, a full 2% allocation of their GDP would represent total defense spending of nearly $400 billion – representing a one-time incremental step-up of over 20%. For Leidos, the much larger U.S. defense spending obviously is the greatest opportunity, but we believe increased funding from allies only adds to the company’s total longer-term opportunity.
NATO Europe and Canada Defense Spend
NATO Europe and Canada Defense Spend (Source: NATO press release, 6/27/22)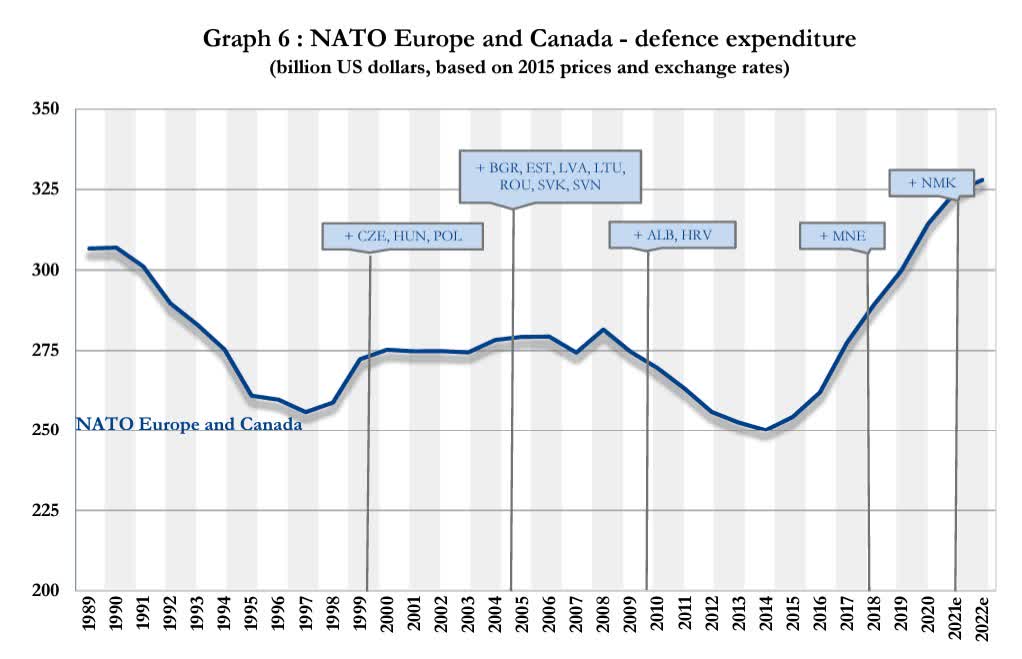
Now that we have laid out the enhanced longer-term opportunity for the Company’s fundamentals, let us turn to the opportunity in the stock. For a start, we point out that consensus estimates for Leidos haven’t moved at all since the outbreak of the war in Ukraine. We find this nearly laughable. The market expects sales growth of only 4-6% per year through 2024. This is well below the levels of growth Leidos generated for five of the last six years, and that was before we had an outbreak of actual war and the high likelihood of a new Cold War.
While the government procurement process does not move quickly, and the opportunities created by the world’s new political and military situation will not appear overnight, there will be a significant increase in the budget of Leidos’s largest customer (the U.S. DoD) in the October 2023 fiscal year, which starts imminently, and we expect the Company to benefit. More importantly, we believe there will be an elevated funding tailwind for Leidos for years to come, and eventually we expect the market to catch on.
Furthermore, we believe the greater long-term opportunities for Leidos will lead to an opportunity for valuation expansion, regardless of which party happens to control Congress or the presidency. While the market may still be more willing to pay up under a Republican, rather than a Democratic, administration, we believe the valuation bar will be adjusted higher in either case.
We would argue we already have seen some modest benefit on the valuation front already this year, with Leidos’s valuation roughly holding steady at an admittedly low level in a market that has seen broad valuation contraction; we expect to see both estimates and valuation moving higher in the next several years. Until we see this play out, we expect to continue to hold a significant position in the stock.
The Toro Corporation
The Toro Corporation has an illustrious history stretching back to its founding in 1914. Many of us first encountered The Toro Company in the rite of passage when our parents finally relented in allowing us to cut the grass for the first time when we were barely taller than the lawn mower handle. From the Company’s humble beginning building tractor engines for the Bull Tractor Company in Bloomington, Milwaukee, the Company has methodically grown into the diversified conglomerate of today that today possesses industry leading brand awareness, market share, technological prowess, and profitability.
We are always enamored with a company’s beginnings, so herewith is the short story of The Toro Corporation’s storied history. The “Toro” name was chosen given its first relationship with The Bull Tractor Company, which according to Company documents was the #1 brand of farm tractors in 1914. Shortly after, in 1919, the Company created the mechanized golf course equipment industry with their invention of The Toro Standard Golf Machine.

Golf course maintenance would prove to a boon for the Company. In 1922 the Company established the first nationwide network of golf course equipment distributors. The Company still boasts that a few of those early customers remain customers today. Innovation was key to the Company in their formative years, as it is today.
Such rapid product innovation propelled the Company to become the #1 manufacturer of golf maintenance and water irrigation in the world. An example of such, in 1924 the Company introduced the first mower called the Park Special. The Park Special would quickly become the industry standard and seller until the advent of rotary mowers in the late 1950s.
After World War II, the Company enhanced their in-house product development with acquisitions. The Company entered the rotary lawnmower business in 1948 with the acquisition of the Whirlwind Company of Milwaukee. Quickly by 1954 the Company captured the #1 market share in the power mower industry.
In 1951 the Company entered the home snow blower business. In 1962, Toro acquired Moist O’ Matic of Riverside California, a pioneer in plastic irrigation. By 1972 the Company was #1 in golf course irrigation. In 1997 the Company greatly expanded its presence in the landscape contractor business with the acquisition of Exmark Manufacturing of Beatrice, Nebraska. In 2014 the Company expanded into the professional snow and ice management business with the acquisition of BOSS Snowplow of Iron Mountain, Michigan.
By 2018 Toro had grown to $2.8 billion in revenues with locations in 125 countries. Given the Company’s size, their acquisition targets became increasing larger. In 2013 the Company entered the trenchless market with the acquisition of Astec’s horizontal directional drilling (HDD) smaller rig line.
Despite some notable internal new product development, the Company’s market share remained small and stalled – yet the trenchless market opportunity remained large. To remedy this problem and opportunity, Toro purchased Perry, Oklahoma based Charles Machine Works (CMW) for $700 million in cash. The industry leader, CMW manufactures and sells a plethora of underground trenching equipment which includes underground pipe and cable, HDD, trenchers, loaders, excavators and much more. CMW’s eponymous brand is Ditch Witch. At the time of this key acquisition CMW generated $725 million in revenues.
Acquisitions accelerated over the past two years – particularly into new technologies, including Venture Products (Ventrac brand in turf, landscape, snow and ice), TURFLYNX (pioneer in autonomous, all-electric golf fairway mowers), Left Hand Robotics (alternative power, smart-connected and autonomous), and Intimidator Group (Spartan Mowers zero turn mowers, with significant presence in the southern U.S.).
As the Company exits the pandemic era, three key elements dominate the Company’s business trajectory: supply shortages, the golf business, and zero emission products. On the supply front, shortages still exist in size – particularly in the Company’s professional line of equipment. Such equipment shares a significant number of internal parts shared by many other industries, such as, high horsepower engines, hydraulic systems, motors and pumps, plus a myriad of wire harnesses and related electrical parts.
The Company reports the nature of shortages has changed from those that stalled initial product manufacturing to those now that prohibit finished goods to be completed. The shortages are still most acute in the Company’s booming Ditch Witch business.
Speaking of booming, the Company’s key golf business is booming at unpresented levels. According to the Company, there are 30,000 golf courses around the world. Half of those are located in the U.S. The Company claims that it has a 50% market share across the globe. Importantly, Toro is the only company in the industry the has both golf equipment and golf irrigation.
The advent of and societal desires to embrace zero-emission products is, and will be, a signal transformation for The Toro Company. Circa-2022, the Company is agnostic whether a customer desires gas-powered or lithium battery operated equipment, but that will likely change in the years ahead as technological advancements continue apace with zero-emission equipment. Relatedly, the Company tracks an internal “Vitality Index” with the goal that at least 35% of sales must come from products introduced over the preceding two years. If this goal continues to be met it will most likely come from both zero-emission and robotic products.
We applaud management’s capital allocation discipline and, yes, aggressiveness to position the Company in a continued leadership role as technological advancement sweeps across their markets.
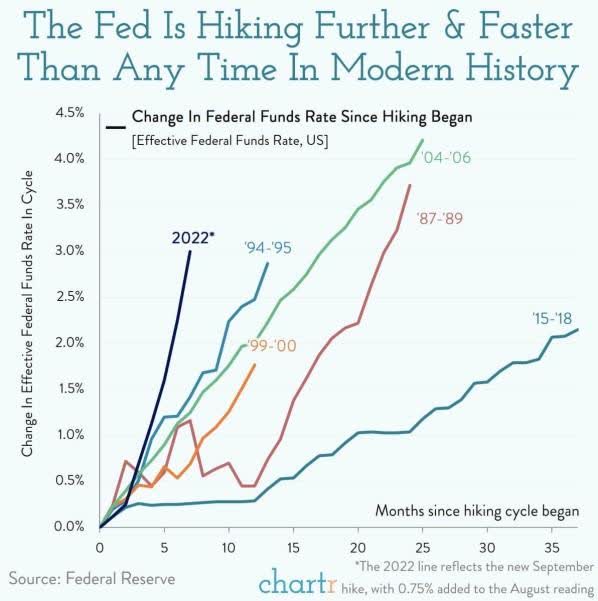
Whip Inflation Now – Until Something Breaks

We lead off this Letter with the same Ford Administration WIN graphic from our last Letter and a short summary, cutting to the chase: Please see our market commentary from our past couple of Letters. We note that on literally every economic and market measure chronicled in those Letters has gotten worse during the third quarter – some materially. (30-year mortgage rates have raced to 7.14% – up from just 3.07% over the past 12 months.)
Powell & Co. has finally convinced investors around the globe that they are most serious in channeling their inner-Volcker to rein in inflation. However, getting inflation back to their desired 2% level will not be a surgical operation, but blunt force economic shocks. In other words, Fed to Wall Street: Drop Dead!
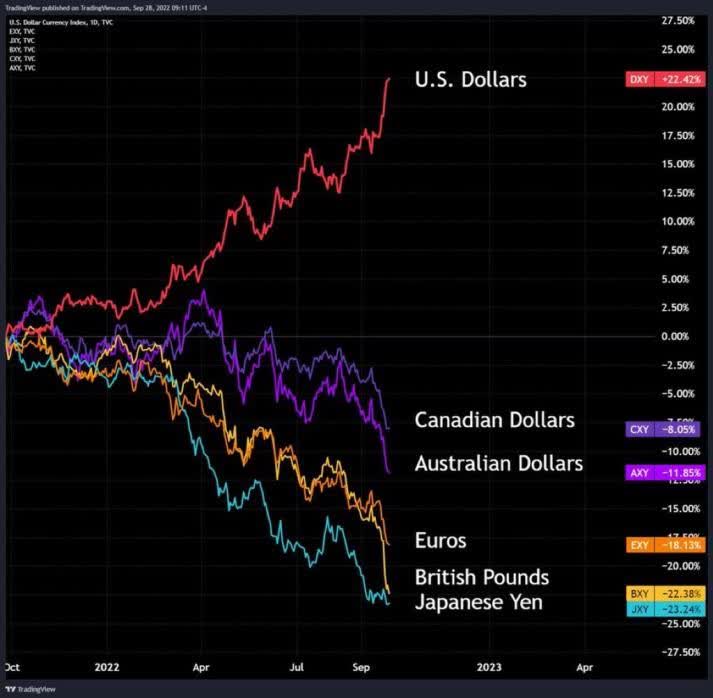
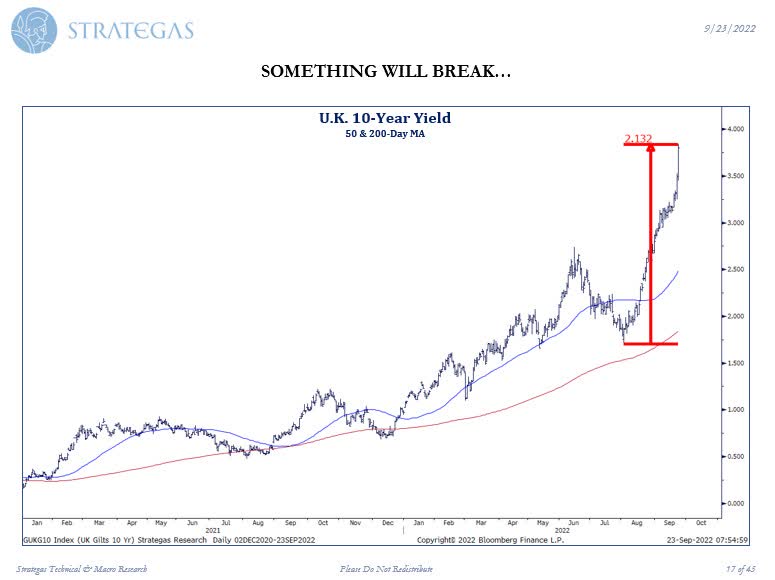
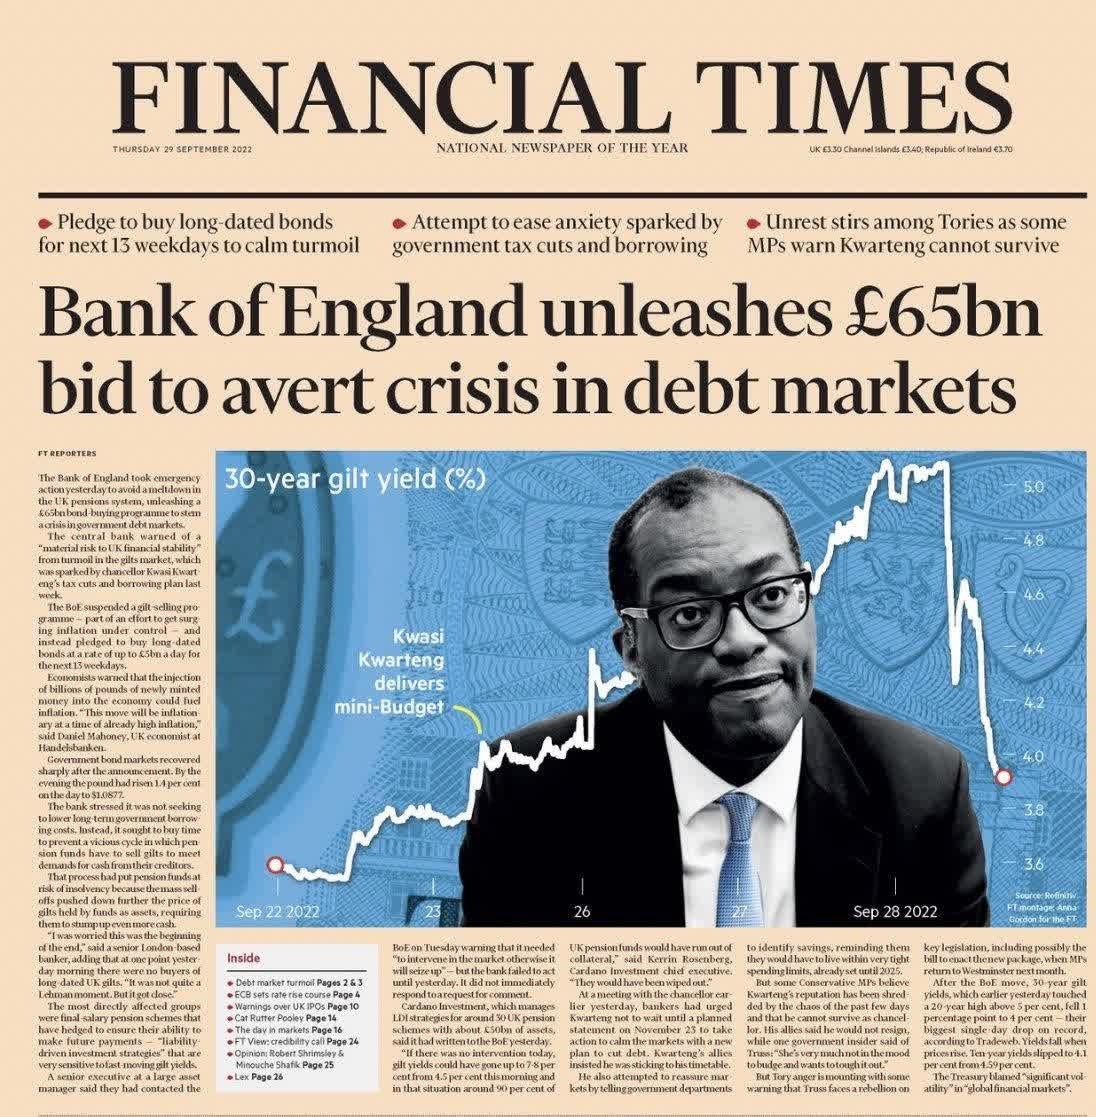
As bad as our stock and bond markets (and housing affordability) have suffered this year, international markets have experienced nothing short of shock and awe destruction as the strength in the U.S. dollar has quaked forex markets, which in turn have begun to break those markets that have feasted on too much leverage – such as the U.K. Gilt market.
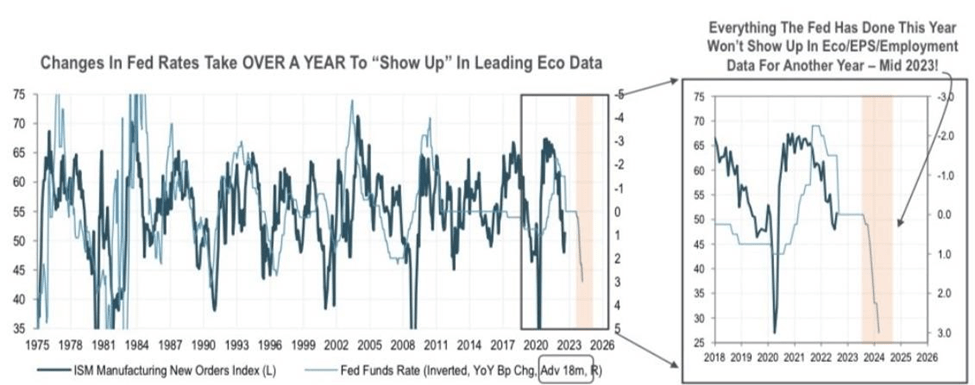
The Fed’s inflation fighting resolve is likely to be tested as we write this Letter. The U.S. bond market’s wild swings have reached elevated levels associated with past financial destruction and concomitant central bank intervention. Discounting the significant lag times interest rate hikes take to filter through the economy is a second order to future wild swings.
We’ve never put much stock in mind reading, but we’d guess, considering how long it takes historically for our central bank Mandarins to meaningfully reduce inflation, that Fed Chair Powell will do all in his intestinal fortitude to avoid adding “Powell Pivot II” on his CV. We suggest investors gird themselves for the inevitable epic battle of Powell vs. Brainard. Note, Lael Brainard, the Fed’s Vice-Chair is so dovish on the easiest possible monetary policy that she makes uber-dove Janet Yellen resemble a Harris’s Hawk.
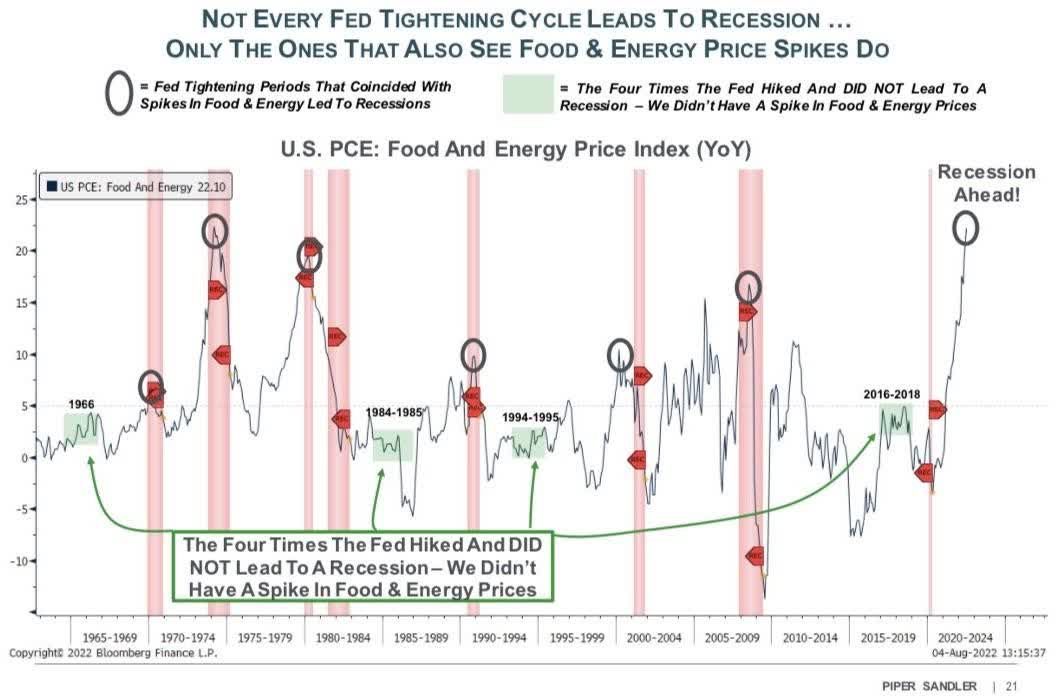
The stock market continues to sniff out this battle royale of wits and political clout in the Eccles Building – and recession risk too.
Source: Piper Sandler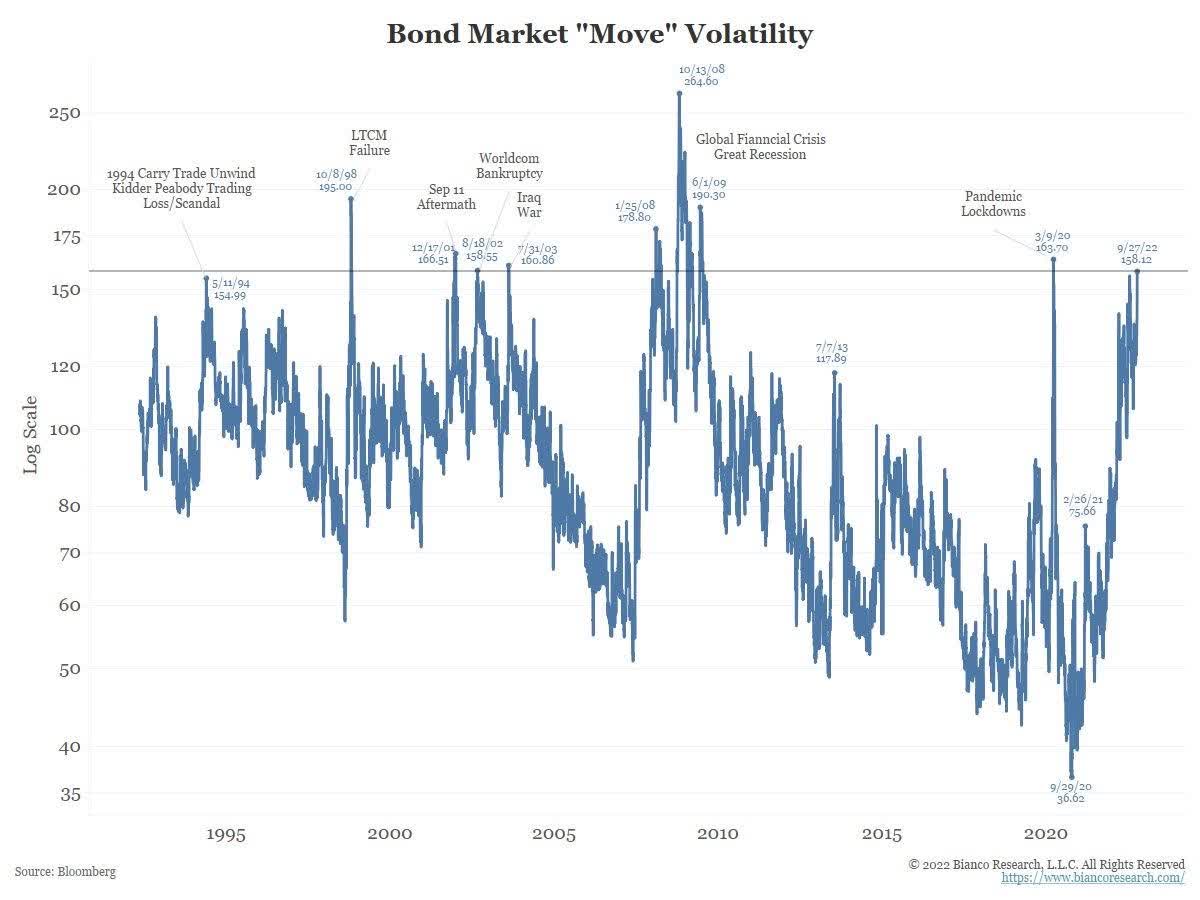
We ended our last Letter as follows:
“Even if inflation recedes below current, evolving expectations, Corporate America still faces higher levels of sticky cost structures that may take a few years to claw back. Margin headwinds may dominate earnings well into 2023. Needless to say, we expect second quarter earnings (and third quarter forecasts) to add another whirlwind in stock prices.”
Our current thoughts on corporate earnings are unchanged, but more worrisome. Can Powell & Co. engineer the ever elusive “soft landing”? Although the consumer still seems to be in good spending shape, the list of companies, across most industries, reporting hard earning landings (and outlooks) grows by the day. Rare is the company that is not choking on too much inventory. Those companies who sell into international markets face a tsunami of revenue headwinds due to the soaring dollar.
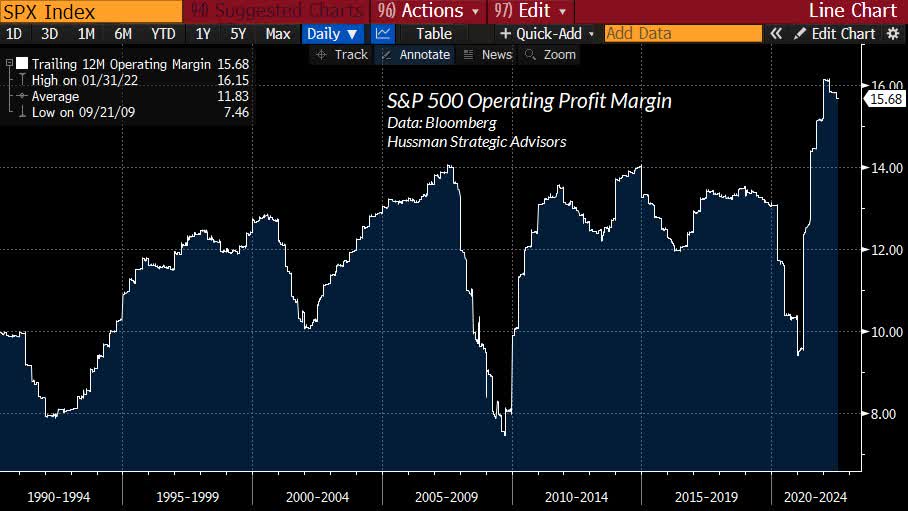
Record high corporate profit margins have barely begun to recede from the once in a generation cocktail of $1.7 trillion in monetary quantitative easing and $3.5 trillion in fiscal stimulus pandemic relief. In our view, analyst expectations for growth in earnings in 2023 and into 2024 seem hopelessly optimistic. Needless to say, we expect third quarter earnings (and fourth quarter forecasts) to add another whirlwind in stock prices.
Source: J.P. Morgan Asset Management Source: J.P. Morgan Asset Management Source: J.P. Morgan Asset Management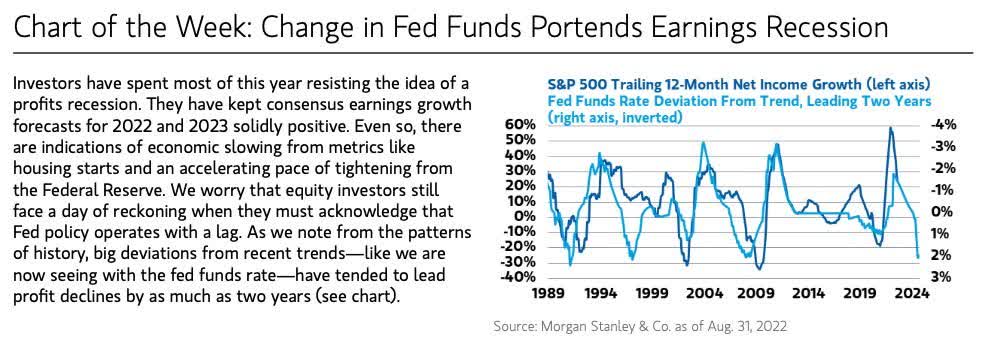

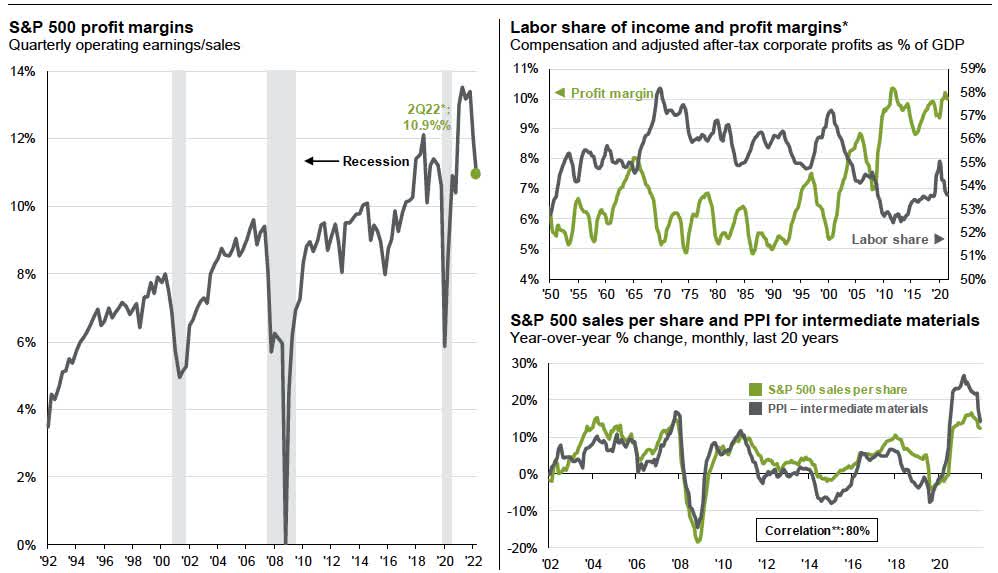
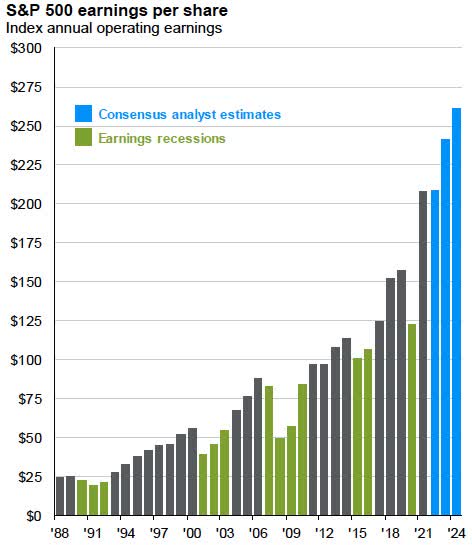
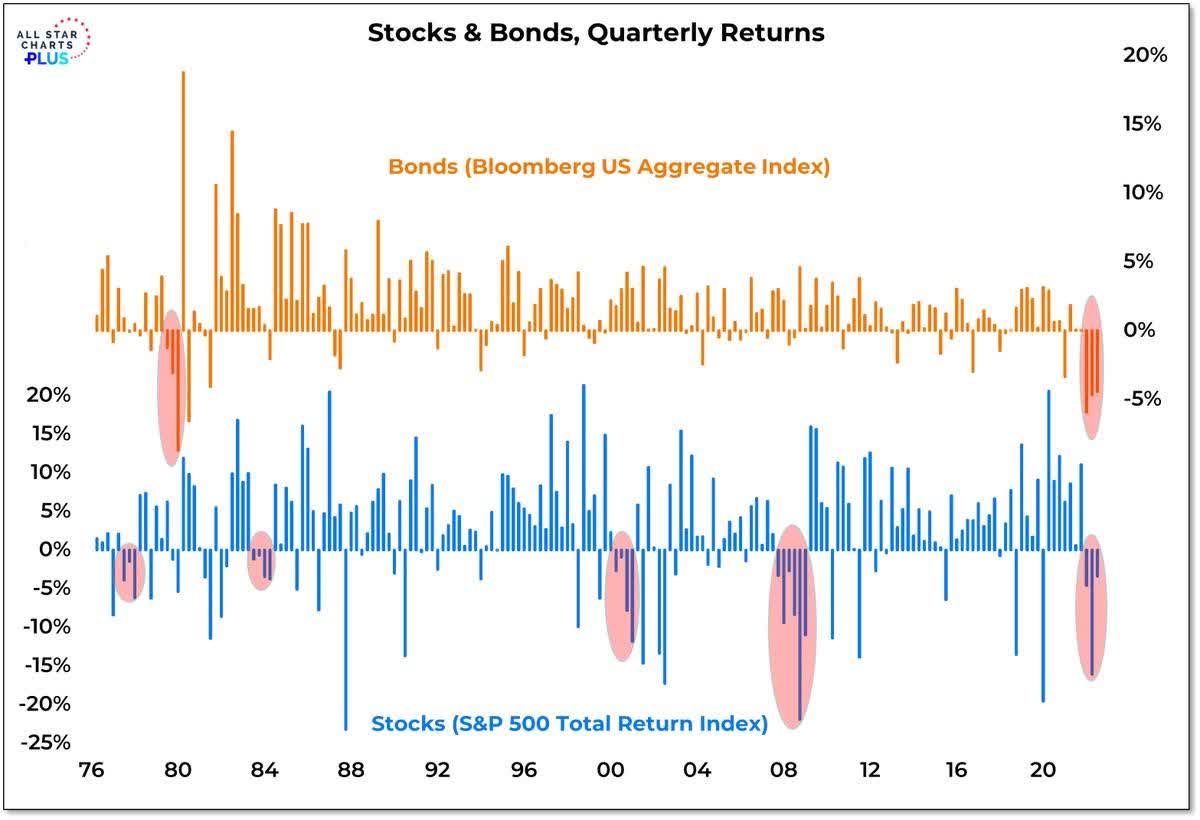
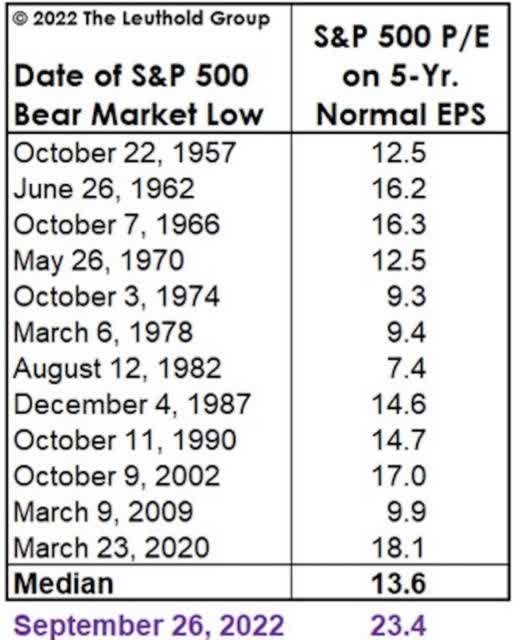
The graphic below best describes the sum of all of our fears. Many of our brethren value stocks on future earnings expectations. All is well on that front. Wall Street is inherently a discounting mechanism, as the past is prologue. However, when the operating environment reaches historic extremes, measures of “normalization” are prudent to consider.
On that score, if 2023 and 2024 earnings disappoint current expectations (as we expect), given the Fed’s long road of tightening to get to their ideal 2% inflation, “normalized” earnings levels paint a picture that the next leg down in the current bear market may be a long road as well.
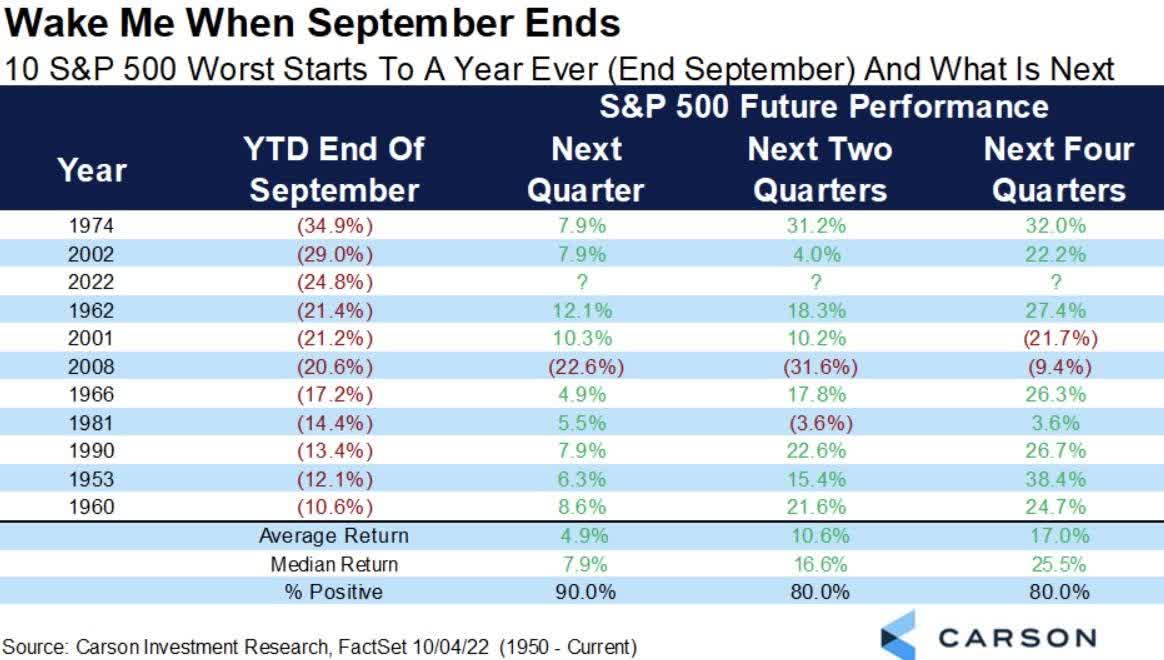
Despite our admitted bearishness, the contrarian element in our investing nature cannot help but think such bearishness (and fear of another Fed mistake) are not rare views these days. The stock market was at a similar moment of fear just make in mid-June, only to see the stock market stage a wicked sharp rally of nearly +20% by mid-August. Such rallies are part-in-parcel of bear markets – and why market timers are nowhere to be found on Forbes 400 List of Richest Americans.
In addition, the recent stock market rallies, and declines of +/- 2-3% each day, are even more evidence that the stock market can’t shake its addiction with the “Fed Put.” Each and every trading day starts with the hope or fear that Powell & Co. will or won’t “pivot.” In essence, the stock market trades as a single commodity, rather than a collection of vastly different individual businesses. We welcome a future when global financial markets can finally divorce themselves from the promises and foibles of central bankers. We aren’t holding our breath.
On the other hand, perhaps we should not look a gift horse in the mouth. If the stock market must be hooked on the opioids of central bankers, long-term “business owners” should relish the opportunity to take advantage of the opportunities central bankers will serve up.
We are reminded of the fact (paradox?) that the greatest source of significant gains in wealth are served up during bear markets. Our investment strategy remains the same. We will remain patient for Mr. Market to serve up fat pitches to either overweight current positions or add new positions.
Finally, Wedgewood is pleased to announce the well-deserved promotion of Bill Thomas to CEO and President. Bill has been with the firm since 2015 and President since 2016. He has had a substantial positive impact on the culture and operations of Wedgewood in a relatively short period of time.
Tony Guerrerio, who had been CEO, Chairman, and Portfolio Manager will remain Chairman and Portfolio Manager. Bill’s previous positions include CEO of Grail Advisors, as well as senior leadership positions at large national firms like Charles Schwab and Scudder Investments. His wealth of experience has benefitted the firm over the last seven years, and we look forward to a seamless transition.
David A. Rolfe | Michael X. Quigley | Christopher T. Jersan, CFA
|
The information and statistical data contained herein have been obtained from sources, which we believe to be reliable, but in no way are warranted by us to accuracy or completeness. We do not undertake to advise you as to any change in figures or our views. This is not a solicitation of any order to buy or sell. We, our affiliates and any officer, director or stockholder or any member of their families, may have a position in and may from time to time purchase or sell any of the above mentioned or related securities. Past results are no guarantee of future results. This report includes candid statements and observations regarding investment strategies, individual securities, and economic and market conditions; however, there is no guarantee that these statements, opinions or forecasts will prove to be correct. These comments may also include the expression of opinions that are speculative in nature and should not be relied on as statements of fact. Wedgewood Partners is committed to communicating with our investment partners as candidly as possible because we believe our investors benefit from understanding our investment philosophy, investment process, stock selection methodology and investor temperament. Our views and opinions include “forward-looking statements” which may or may not be accurate over the long term. Forward-looking statements can be identified by words like “believe,” “think,” “expect,” “anticipate,” or similar expressions. You should not place undue reliance on forward-looking statements, which are current as of the date of this report. We disclaim any obligation to update or alter any forward-looking statements, whether as a result of new information, future events or otherwise. While we believe we have a reasonable basis for our appraisals and we have confidence in our opinions, actual results may differ materially from those we anticipate. The information provided in this material should not be considered a recommendation to buy, sell or hold any particular security. |
Editor’s Note: The summary bullets for this article were chosen by Seeking Alpha editors.
Be the first to comment