

tupungato
Earnings of Webster Financial Corporation (NYSE:WBS) will most probably dip this year due to the initial effects of the merger of equals. Once the cost savings get phased in and merger-related one-time costs taper off, earnings are likely to surge. Further, moderate organic loan growth is likely to boost earnings. Overall, I’m expecting Webster Financial to report earnings of $3.49 per share for 2022, and $6.07 per share for 2023. The year-end target price suggests a high upside from the current market price. Therefore, I’m maintaining a buy rating on Webster Financial Corporation.
Cost Savings is the Biggest Earnings Catalyst
Following the merger with Sterling Bancorp, the efficiency ratio stood at 59% in the second quarter of 2022. Thanks to already identified areas for cost savings, the management is expecting the efficiency ratio to improve to the mid-40% range, as mentioned in the earnings presentation. According to details given in an earlier press release, the management had initially expected to save a massive $120 million in costs following the merger.
I was previously expecting cost savings to materialize soon after the merger. However, now that I’ve seen the second quarter’s performance, I’ve decided to push out the cost-saving benefits by a quarter year. Therefore, I’m assuming the cost-saving benefits will become visible in 2023. I’m expecting the efficiency ratio to drop to 45% by the fourth quarter of 2022, and then to 43% by the fourth quarter of 2023.
Job Markets to Sustain Organic Loan Growth
Webster Financial’s loan book grew by a remarkable 4.9% in the second quarter of 2022, or 19.6% annualized. The management is targeting organic loan growth of 8% to 10% this year, as mentioned in the earnings presentation. This target seems achievable given the second quarter’s performance.
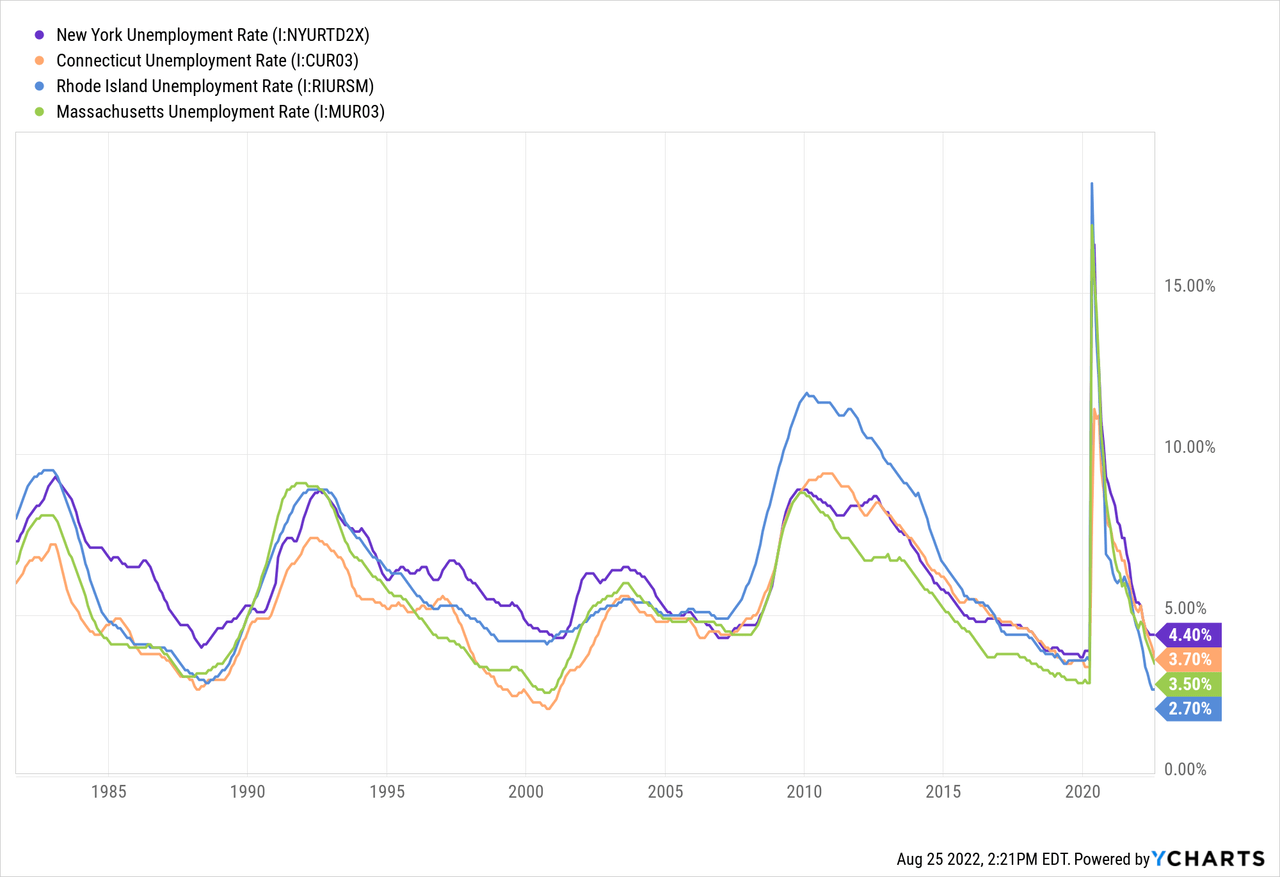
Further, strong job markets give hope that credit demand will persevere despite high interest rates. Following the Sterling Bancorp merger, Webster Financial now operates in several northeastern states, namely New York, Connecticut, Rhode Island, and Massachusetts. These states currently have very strong job markets from a historical perspective.
Overall, I’m expecting the loan portfolio to grow organically at a rate of 2% per quarter (8% annualized) till the end of 2023, which is close to the historical trend. The following table shows my balance sheet estimates.
| FY18 | FY19 | FY20 | FY21 | FY22E | FY23E | |||||
| Financial Position | ||||||||||
| Net Loans | 18,253 | 19,828 | 21,282 | 21,971 | 46,896 | 50,762 | ||||
| Growth of Net Loans | 5.4% | 8.6% | 7.3% | 3.2% | 113.5% | 8.2% | ||||
| Other Earning Assets | 7,454 | 8,477 | 8,978 | 10,834 | 16,366 | 17,031 | ||||
| Deposits | 21,859 | 23,325 | 27,335 | 29,847 | 55,221 | 59,773 | ||||
| Borrowings and Sub-Debt | 2,635 | 3,704 | 1,696 | 1,249 | 5,385 | 5,493 | ||||
| Common equity | 2,741 | 3,063 | 3,090 | 3,293 | 8,031 | 8,816 | ||||
| Book Value Per Share ($) | 29.7 | 33.3 | 34.3 | 36.5 | 45.7 | 50.1 | ||||
| Tangible BVPS ($) | 23.6 | 27.2 | 28.1 | 30.3 | 30.1 | 34.6 | ||||
|
Source: SEC Filings, Author’s Estimates (In USD million unless otherwise specified) |
||||||||||
Loan Mix Makes the Topline Moderately Rate Sensitive
Floating and periodic-rate loans represented 59% of total loans at the end of June 2022, as mentioned in the earnings presentation. Therefore, the average earning-asset yield will be quite sensitive to interest rate hikes this year. However, the liability side is also quite rate-sensitive. As mentioned in the presentation, the management is assuming a deposit beta of a sizable 30% to the Fed funds rate.
The results of the management’s interest-rate sensitivity analysis given in the presentation showed that a 200-basis points ramp in interest rates can increase the net interest income by 8.4% over twelve months.
2Q 2022 Earnings Presentation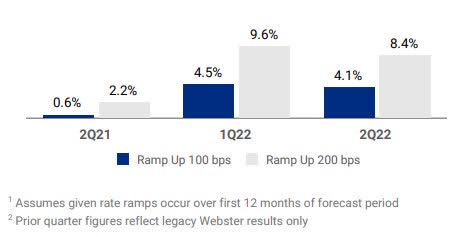
Considering these factors, I’m expecting the margin to increase by 15 basis points in the second half of 2022, before plateauing until the end of 2023.
Provisioning Likely to be Above Normal in the Second Half Due to a Low Reserve Level
After the large adjustment for the Sterling Bancorp merger in the first quarter of 2022, provision expenses dropped to a level below normal in the second quarter of this year. Allowances were 1.25% of total loans, while nonperforming loans were 0.54% of total loans at the end of June 2022. This coverage does not seem comfortable to me, especially given the inflationary environment which should result in financial stress for borrowers. The high interest-rate environment and threats of a recession also call for a larger allowance relative to nonperforming loans. Therefore, I’m expecting provisioning to remain above the historical average during the second half of 2022. For 2023, I’m expecting provisioning to be slightly below a normal level.
Overall, I’m expecting the net provision expense to make up 0.24% of total loans in the second half of 2022 (annualized), leading to a full-year provision expense of 0.55% of total loans. For 2023, I’m expecting the net provision expense to make up 0.16% of total loans. In comparison, the net provision expense averaged 0.21% of total loans in the last five years.
Expecting Earnings to Grow to $6.07 Per Share in 2023
I’m expecting earnings to dip this year due to the initial effects of the merger, i.e. merger-related operating expenses and the provisioning adjustment. The benefits of the merger of equals will likely become apparent next year. Further, earnings next year will benefit from the anticipated organic loan growth as well as a higher net interest margin.
Overall, I’m expecting Webster Financial to report earnings of $3.49 per share for 2022, including one-time merger-related costs. For 2023, I’m expecting earnings to grow to $6.07 per share, up 74% year-over-year. the following table shows my income statement estimates.
| FY18 | FY19 | FY20 | FY21 | FY22E | FY23E | |||||
| Income Statement | ||||||||||
| Net interest income | 907 | 955 | 891 | 901 | 1,936 | 2,222 | ||||
| Provision for loan losses | 42 | 38 | 138 | (55) | 257 | 80 | ||||
| Non-interest income | 283 | 285 | 285 | 323 | 443 | 443 | ||||
| Non-interest expense | 706 | 716 | 759 | 745 | 1,331 | 1,175 | ||||
| Net income – Common Sh. | 352 | 373 | 211 | 399 | 614 | 1,067 | ||||
| EPS – Diluted ($) | 3.81 | 4.06 | 2.35 | 4.42 | 3.49 | 6.07 | ||||
|
Source: SEC Filings, Author’s Estimates (In USD million unless otherwise specified) |
||||||||||
Actual earnings may differ materially from estimates because of the risks and uncertainties related to inflation, and consequently the timing and magnitude of interest rate hikes. Further, a stronger or longer-than-anticipated recession can increase the provisioning for expected loan losses beyond my estimates.
Maintaining a Buy Rating
Webster Financial is offering a dividend yield of 3.3% at the current quarterly dividend rate of $0.40 per share. The earnings and dividend estimates suggest a payout ratio of 26% for 2023, which is below the 2017-2021, ex-2020, average of 36%. Despite the room for a dividend hike, I’m not expecting an increase in the dividend level because Webster Financial does not change its dividend level frequently. The company has maintained its quarterly dividend at $0.40 per share since the second quarter of 2019.
I’m using the historical price-to-tangible book (“P/TB”) and price-to-earnings (“P/E”) multiples to value Webster Financial. The stock has traded at an average P/TB ratio of 1.83 in the past, as shown below.
| FY18 | FY19 | FY20 | FY21 | Average | ||
| T. Book Value per Share ($) | 23.6 | 27.4 | 28.1 | 30.3 | ||
| Average Market Price ($) | 60.3 | 49.8 | 32.5 | 53.7 | ||
| Historical P/TB | 2.56x | 1.82x | 1.16x | 1.77x | 1.83x | |
| Source: Company Financials, Yahoo Finance, Author’s Estimates | ||||||
Multiplying the average P/TB multiple with the forecast tangible book value per share of $30.1 gives a target price of $55.1 for the end of 2022. This price target implies a 15.0% upside from the August 24 closing price. The following table shows the sensitivity of the target price to the P/TB ratio.
| P/TB Multiple | 1.63x | 1.73x | 1.83x | 1.93x | 2.03x |
| TBVPS – Dec 2022 ($) | 30.1 | 30.1 | 30.1 | 30.1 | 30.1 |
| Target Price ($) | 49.0 | 52.0 | 55.1 | 58.1 | 61.1 |
| Market Price ($) | 47.9 | 47.9 | 47.9 | 47.9 | 47.9 |
| Upside/(Downside) | 2.4% | 8.7% | 15.0% | 21.3% | 27.6% |
| Source: Author’s Estimates |
The stock has traded at an average P/E ratio of around 13.5x in the past, as shown below.
| FY18 | FY19 | FY20 | FY21 | Average | ||
| Earnings per Share ($) | 3.81 | 4.06 | 2.35 | 4.42 | ||
| Average Market Price ($) | 60.3 | 49.8 | 32.5 | 53.7 | ||
| Historical P/E | 15.8x | 12.3x | 13.9x | 12.1x | 13.5x | |
| Source: Company Financials, Yahoo Finance, Author’s Estimates | ||||||
Multiplying the average P/E multiple with the forecast earnings per share of $3.49 gives a target price of $47.2 for the end of 2022. This price target implies a 1.4% downside from the August 24 closing price. The following table shows the sensitivity of the target price to the P/E ratio.
| P/E Multiple | 11.5x | 12.5x | 13.5x | 14.5x | 15.5x |
| EPS 2022 ($) | 3.49 | 3.49 | 3.49 | 3.49 | 3.49 |
| Target Price ($) | 40.2 | 43.7 | 47.2 | 50.7 | 54.2 |
| Market Price ($) | 47.9 | 47.9 | 47.9 | 47.9 | 47.9 |
| Upside/(Downside) | (16.0)% | (8.7)% | (1.4)% | 5.9% | 13.2% |
| Source: Author’s Estimates |
Equally weighting the target prices from the two valuation methods gives a combined target price of $51.1, which implies a 6.8% upside from the current market price. Adding the forward dividend yield gives a total expected return of 10.2%. Considering the total expected return and the earnings outlook, I’m maintaining a buy rating on Webster Financial.
Be the first to comment