

mesut zengin
Although wheat prices continue to be sensationalized by the media, global stock/use ratios suggest there might be downside to wheat prices and the Teucrium Wheat Fund (NYSEARCA:WEAT). However, I would not recommend shorting the WEAT exchange-traded fund (“ETF”), as a bad headline in the Russia/Ukraine war can cause a massive price spike.
Fund Overview
The Teucrium Wheat ETF provides investors exposure to the returns of owning wheat through wheat futures. The WEAT ETF is one of the largest agricultural commodity ETFs with over $350 million in assets.
Strategy
Wheat is one of the most important agricultural commodities in the world. Whereas the other main agricultural commodities like corn and soybeans are primarily used for animal feed and fuel (in the case for corn), wheat is primarily used as food for human consumption. With the global human population recently surpassing 8 billion, the question of how to feed all 8 billion humans has become sensationalized by the media.
The WEAT ETF achieves its investment objective by holding wheat futures in 3 tranches: 2nd to expire, 3rd to expire, and December following the 3rd to expire (Figure 1).
Figure 1 – WEAT ETF strategy (teucrium.com)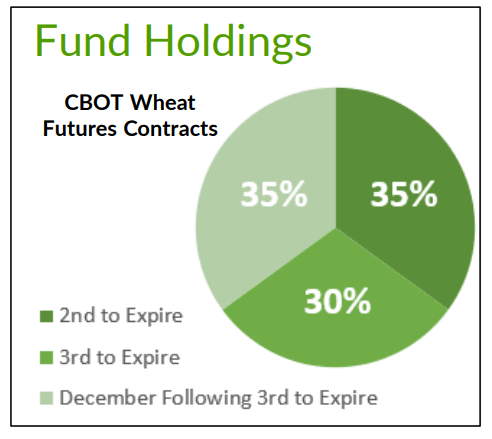
Portfolio Holdings
As of November 16, 2022, the WEAT ETF holds 35% of its assets in March 2023 Wheat futures, 30% in May 2023 futures, and 35% in December 2023 futures (Figure 2).
Figure 2 – WEAT ETF holdings (teucrium.com)
Returns
The WEAT ETF has had strong returns in the past few years, particularly since 2020, as the world has experienced tighter supply / demand conditions (Figure 3).
Figure 3 – WEAT ETF returns (morningstar.com)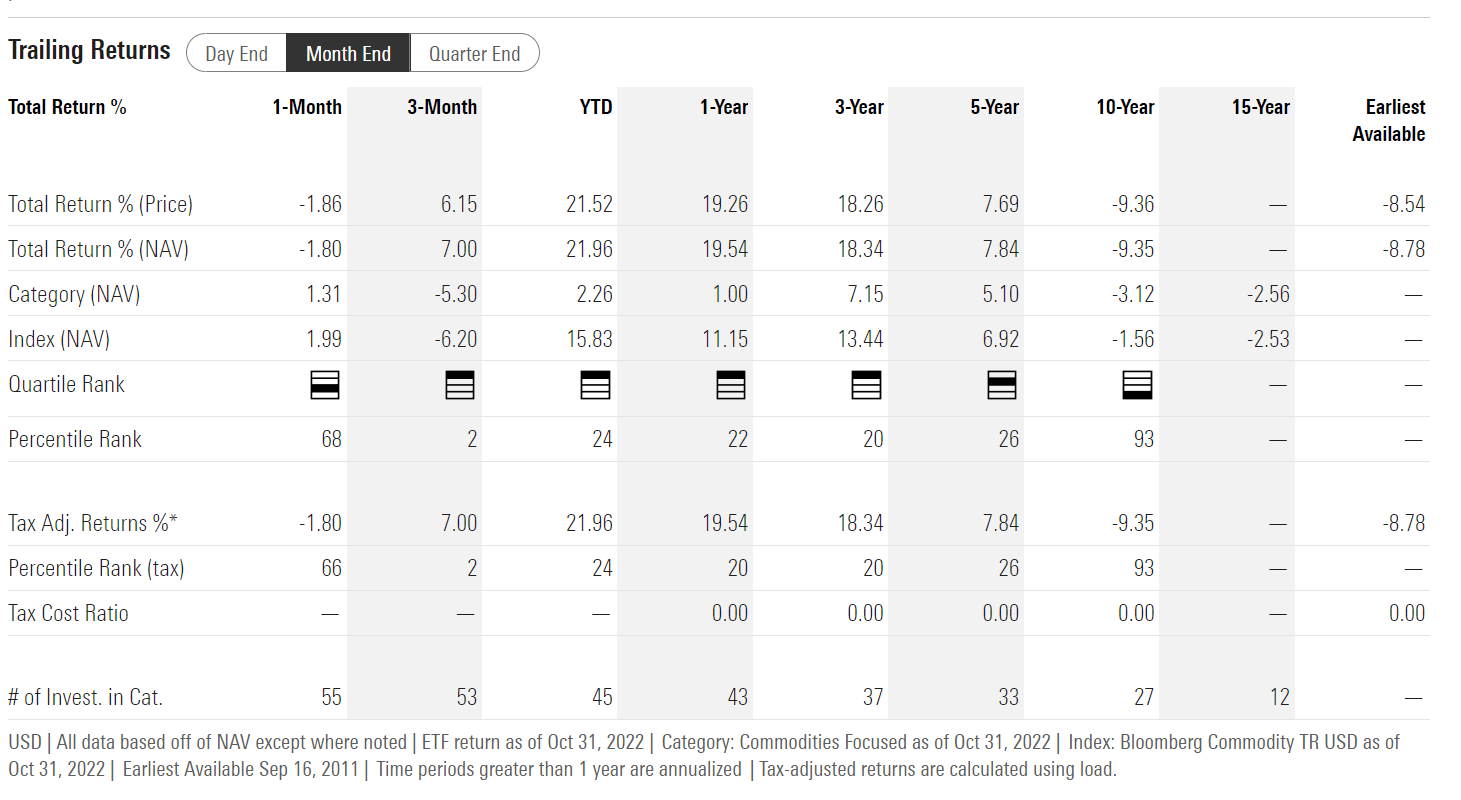
Distribution & Yield
The WEAT ETF does not pay a distribution.
Fees
The WEAT ETF’s fees are a little convoluted. According to the fund’s annual report, the WEAT ETF charged a 2.27% gross expense ratio for the year ended December 31, 2021 (Figure 4). Net of fee waivers, this worked out to a net expense ratio of 1.89% (which is what is reported on Seeking Alpha).
Figure 4 – WEAT ETF fees (WEAT ETF 10K report)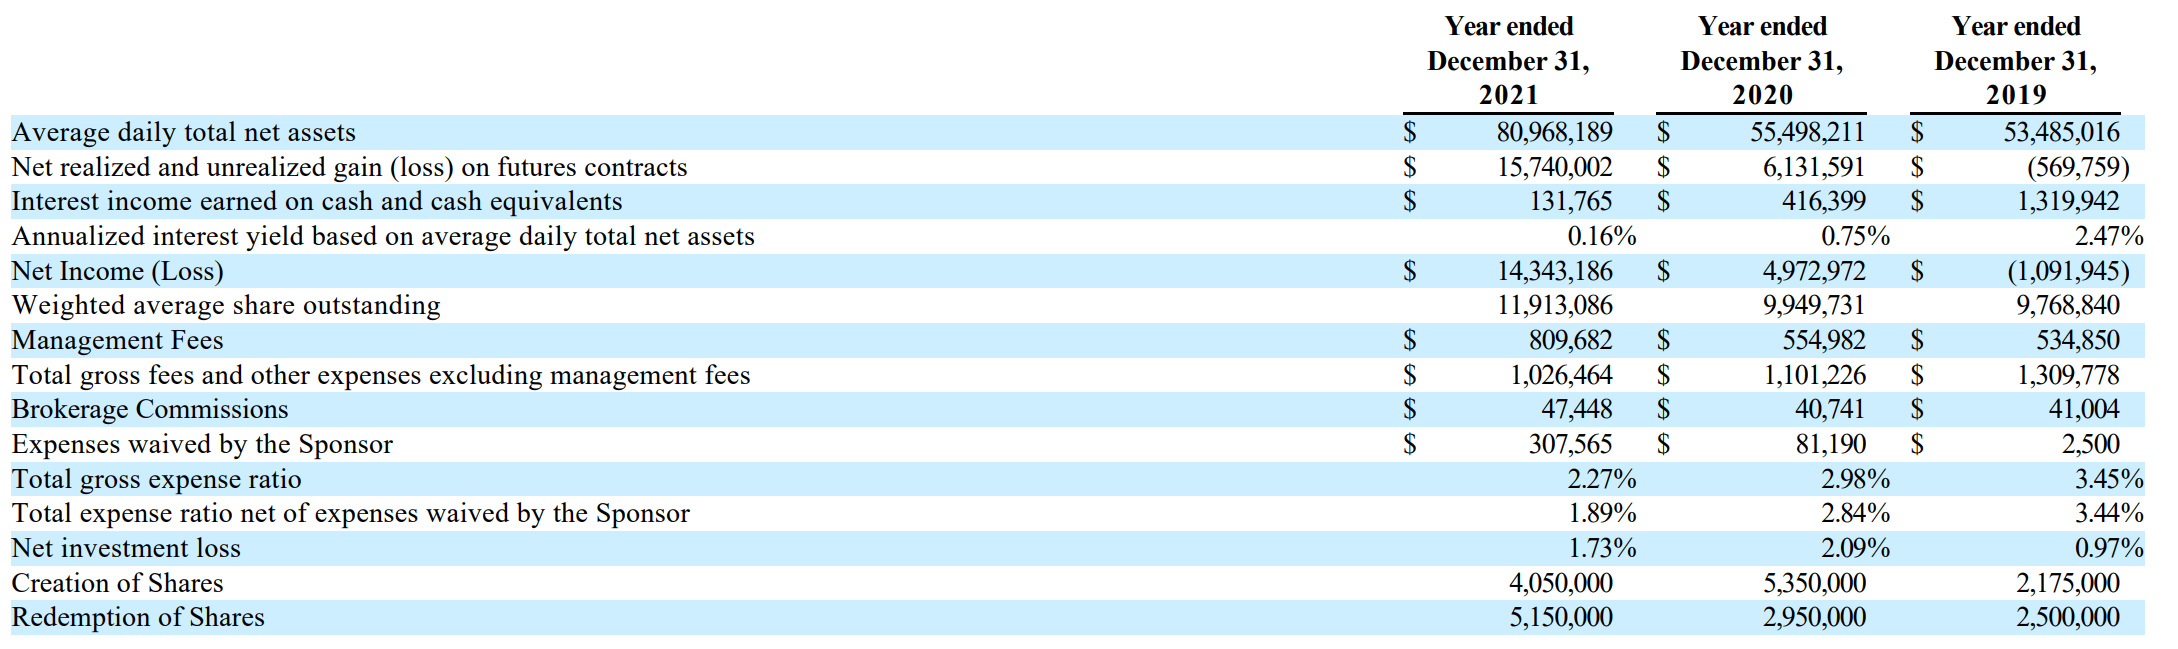
However, as the company earns interest on cash balances held in the fund, and as interest rates have risen in recent quarters, management considers its net expense ratio to be only 0.22% (Figure 5).
Figure 5 – WEAT ETF management’s estimate of net expense ratio (WEAT ETF amended prospectus)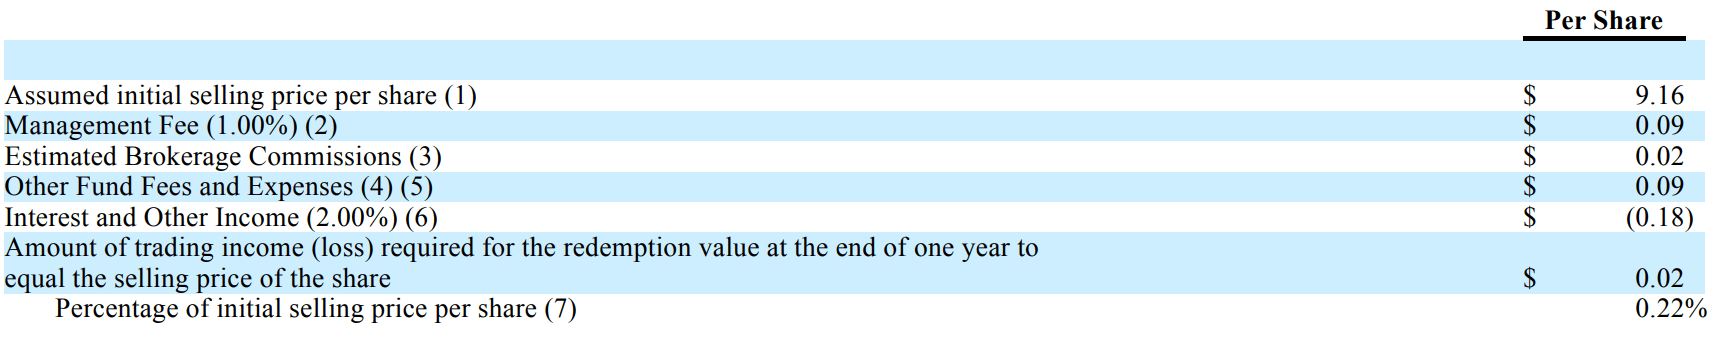
In my personal opinion, the ~2% interest income earned by the fund should be considered ‘returns’ and not a contra to expenses, to make the WEAT ETF comparable to other funds and strategies. Hence I believe WEAT’s expense ratio should be ~2.2% and not 0.22%.
WEAT Underperforms In The Long-run
I’ve written on this issue in other articles discussing futures-based ETFs, but in the long-run, the WEAT ETF is expected to significantly underperform spot wheat prices due to the structure of the fund.
As mentioned above, the WEAT ETF owns the 2nd, 3rd, and December after the 3rd wheat futures. When the 1st wheat futures expire, the fund must ‘roll’ its exposure from the 2nd future (which has become the 1st) onto the new 3rd future, and adjust the weights in the 2nd and 3rd futures to maintain its holdings in the right proportion according to the strategy. Periodically, it must also roll the December future to the next year.
As commodity futures are typically in contango, where longer-dated futures are higher in price, the WEAT ETF loses value during the “rolls.” Hence, over the long-run, the WEAT ETF underperforms spot wheat prices, as shown in Figure 6 below.
Figure 6 – WEAT underperforms spot wheat prices in the long-run (Author created with price chart from stockcharts.com)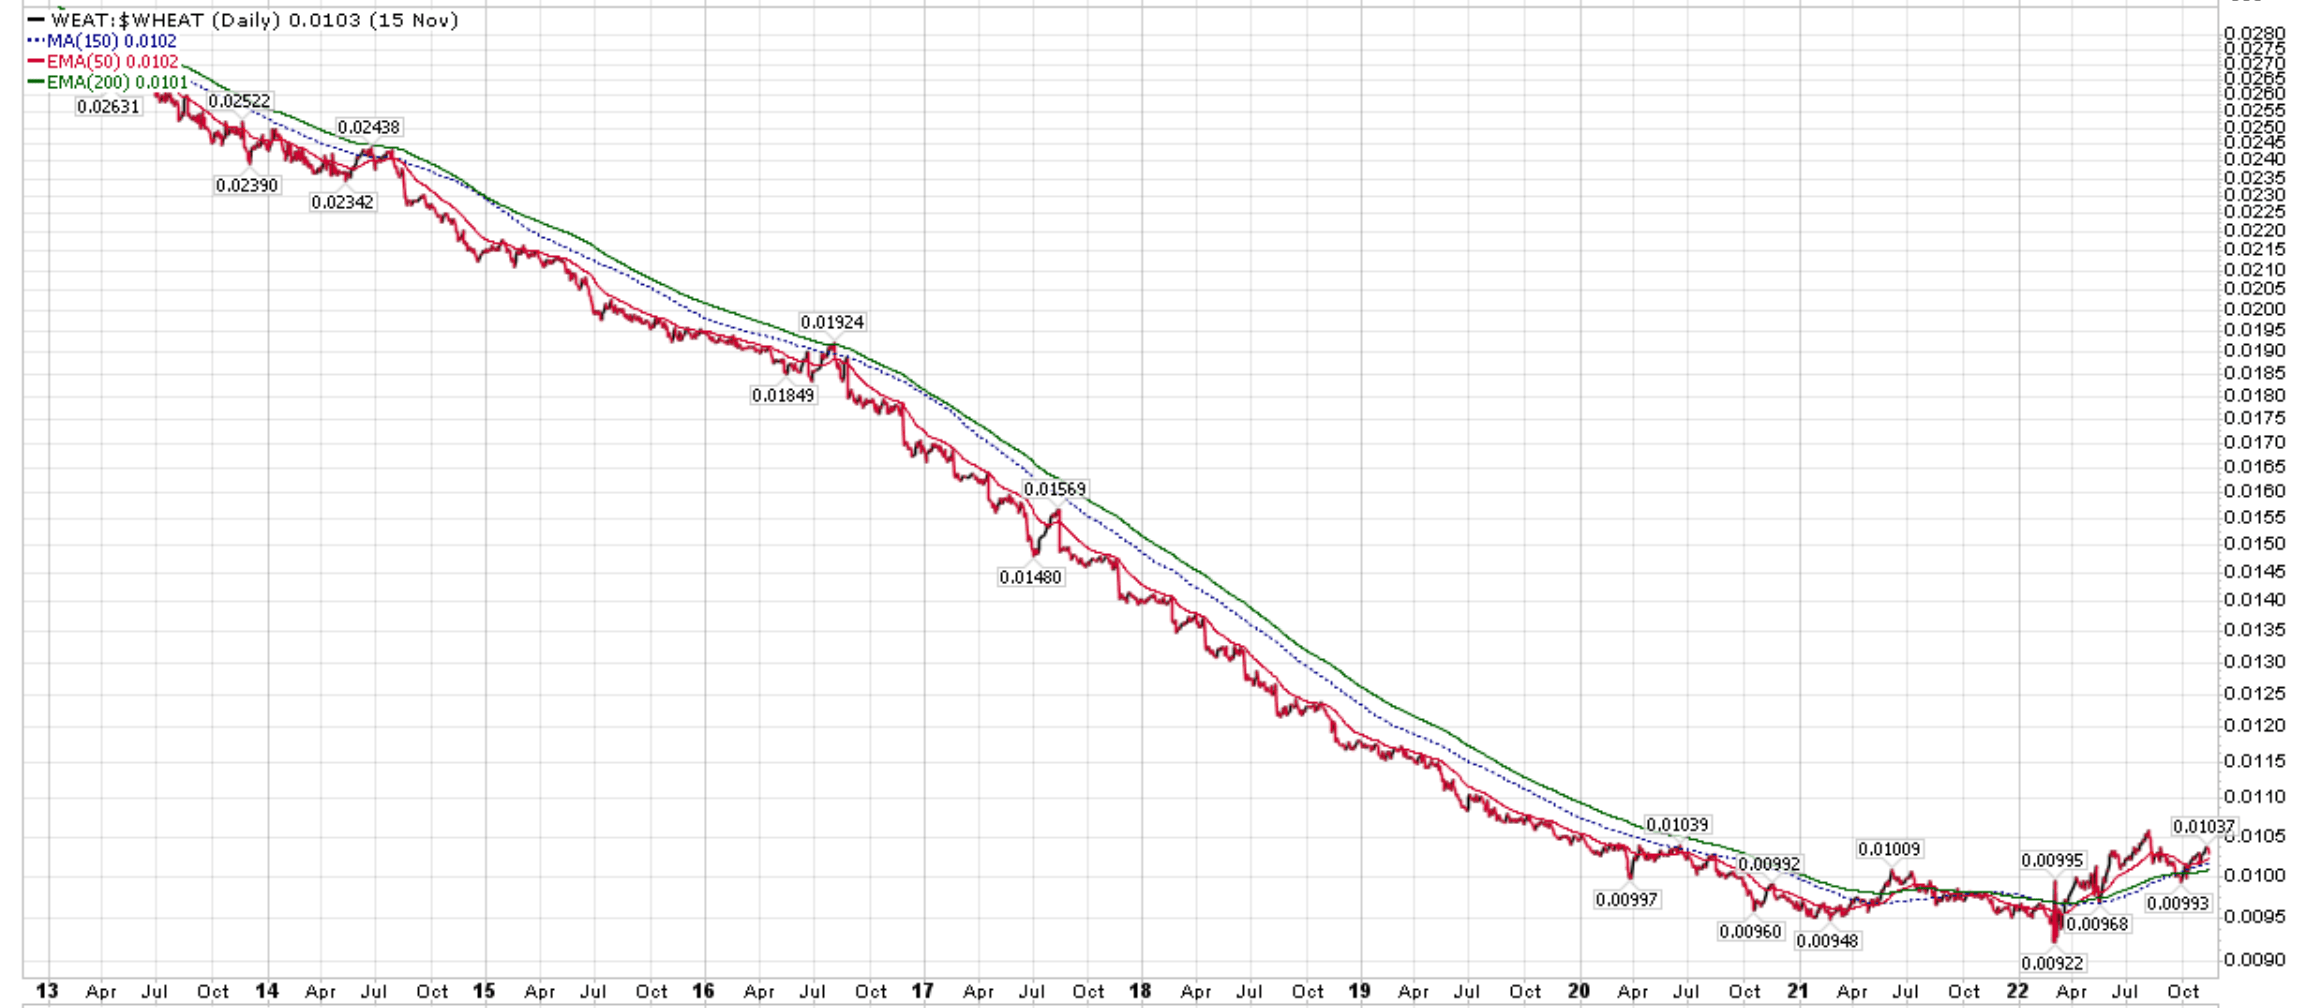
Therefore, I believe the WEAT ETF is only suitable as a short to medium-term bet on the price of wheat.
Russia/Ukraine Has Been Biggest Near-Term Driver Of Wheat Prices
When Russia invaded Ukraine in February, we saw a large spike in the spot price of wheat, as Russia and Ukraine are the world’s largest and 5th largest wheat exporter respectively (Figure 7).
Figure 7 – World’s top wheat exporters (USDA via rferl.org)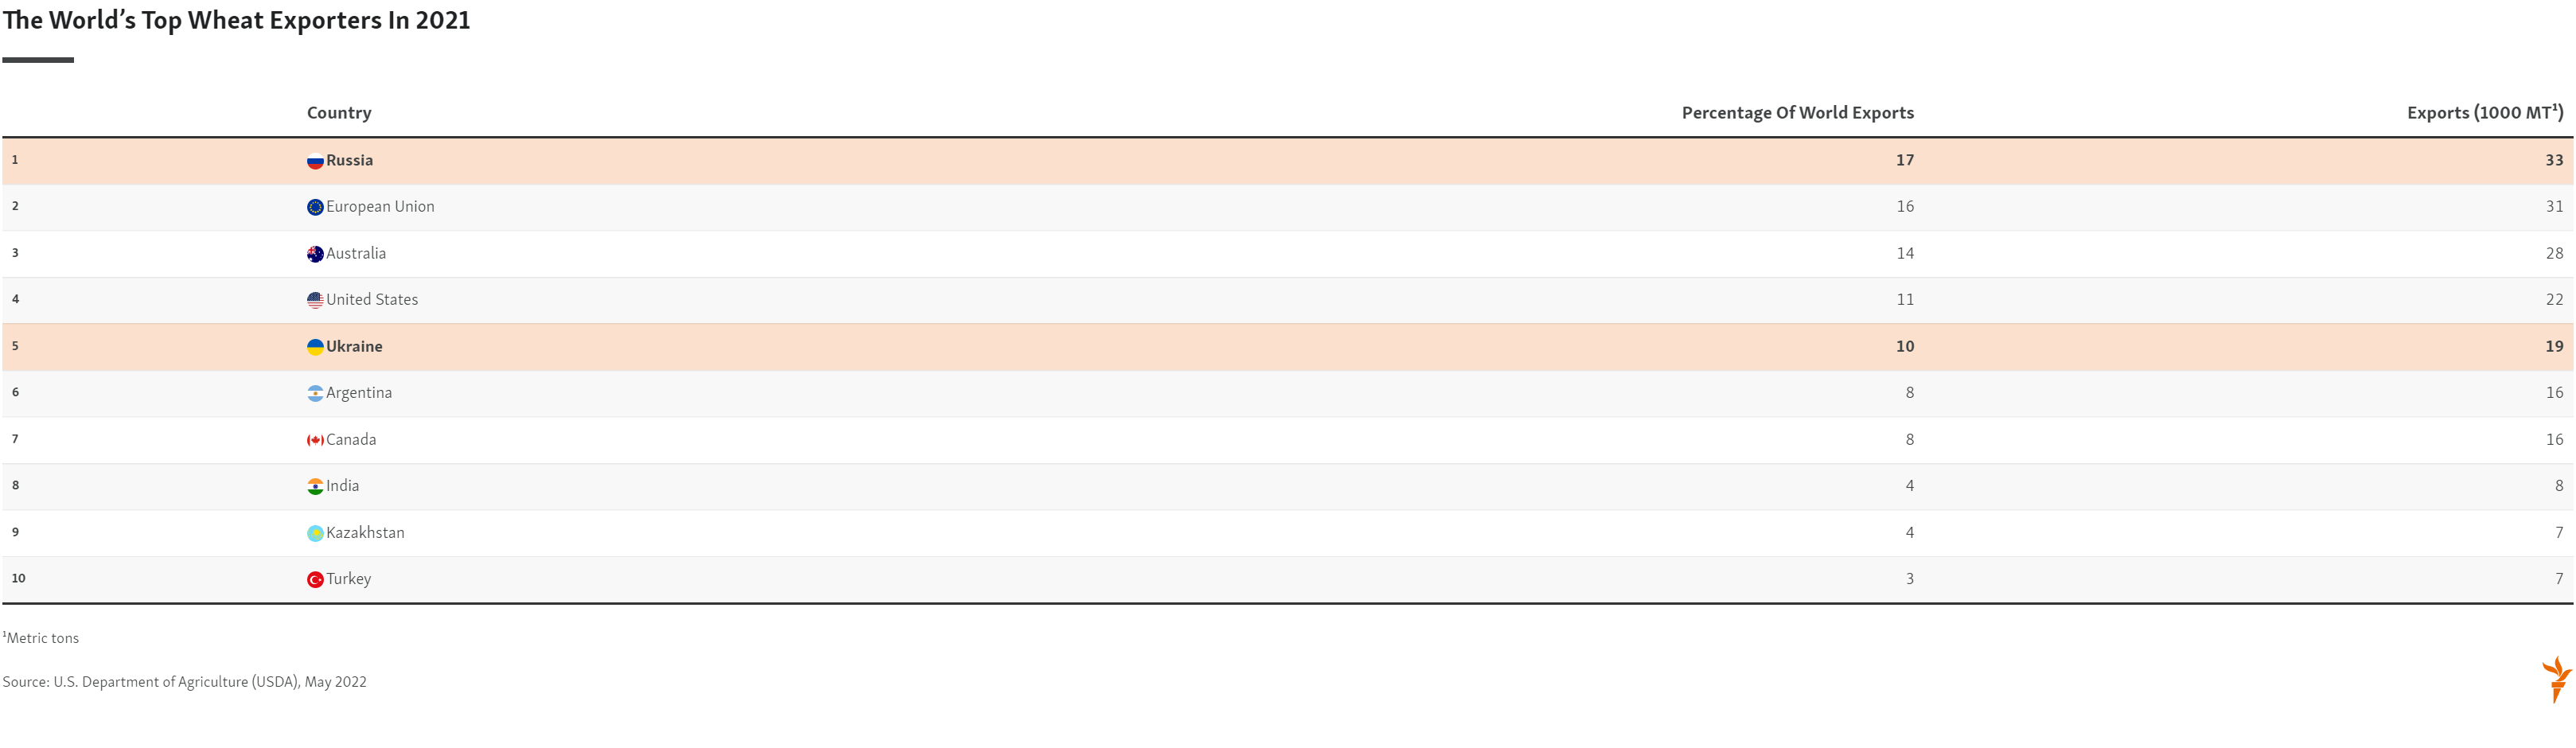
However, despite the Russia/Ukraine war continuing with no end in sight, spot wheat prices have traded back down to pre-invasion levels (Figure 8). What happened?
Figure 8 – Wheat prices have come back to earth (stockcharts.com)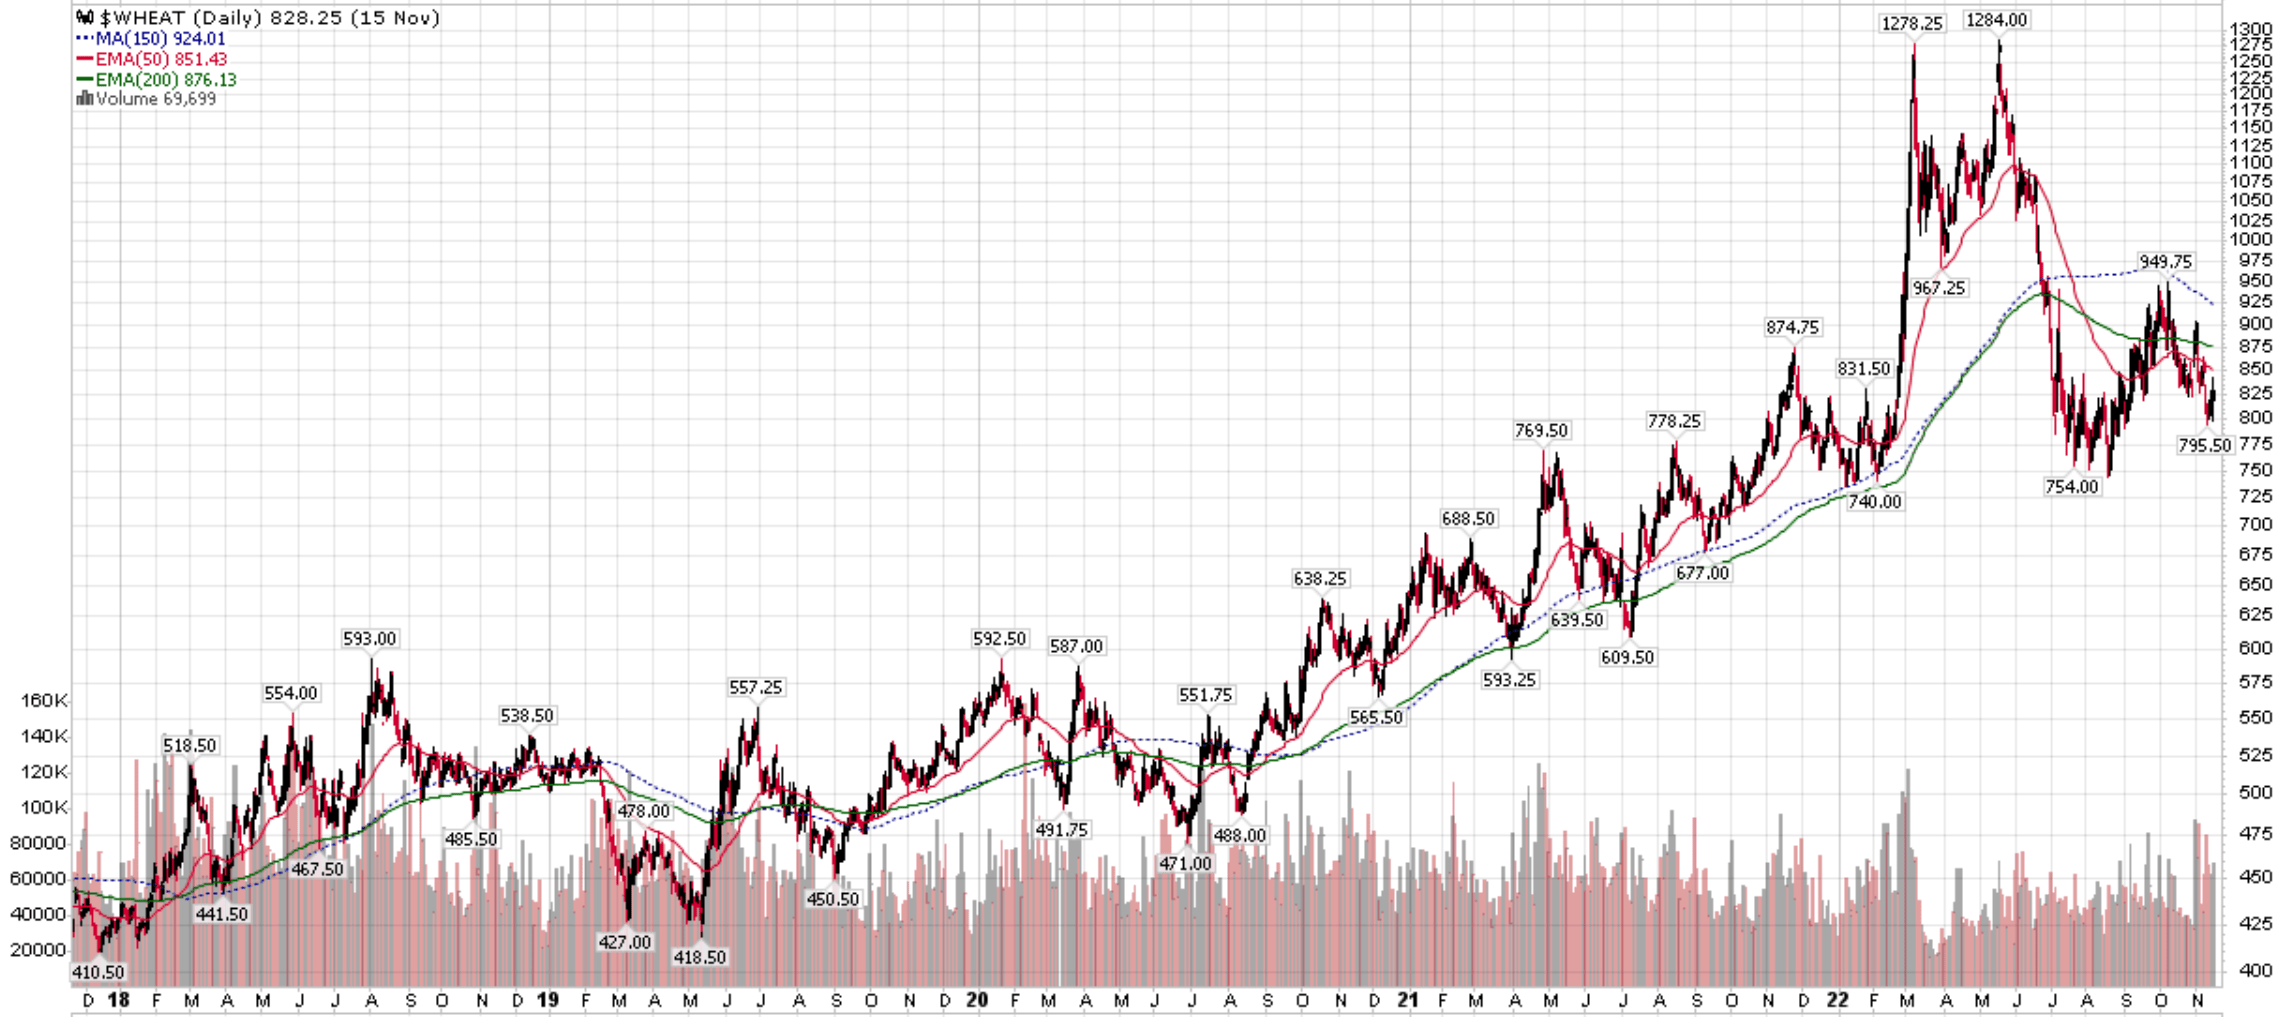
Russia/Ukraine Wheat Export Deal Soothed Nerves
What happened was that after the initial spike, markets calmed down and realized that the world was not going to run out of wheat. Importantly, in July, Russia and Ukraine agreed to an UN-backed deal to resume exports of Russian and Ukrainian grains through the Black Sea. This helped calm global nerves regarding a food shortage.
China’s Bumper Crop Also Helped
Also helping market sentiment was news out of China, which actually harvested a bumper wheat crop in the summer, despite warning earlier in the year of the worst wheat crop in history. China is the world’s largest producer and consumer of wheat, so any changes in the Chinese crop could cause large swings in global wheat prices.
WASDE Report Suggests Markets Roughly Balanced
Although headlines regarding wheat prices continue to be sensationalized by severe weather and the war in Ukraine, data from recent World Agricultural Supply and Demand Estimates (“WASDE”) reports suggest the global wheat market remains relatively well balanced.
While some pundits might bemoan the estimated ending stocks of 267.8 million tons of wheat as the tightest in years, viewed from a longer-term perspective, it’s not nearly so bad (Figure 9).
Figure 9 – Wheat supply/demand balance (November WASDE report)
First, ending stocks are only back to 2016/17 levels, when it was 261.0 million tons. More importantly, the stock/use ratio of 0.34 is also only back to 2015/2016 levels. Historically, there is a strong relationship between the stock/use ratio and the price of wheat, discounted by inflation as measured by PPI (Figure 10).
Figure 10 – Wheat price discounted by PPI inversely correlated to global stock/use ratio (Author created with price chart from stockcharts.com and data from WASDE reports)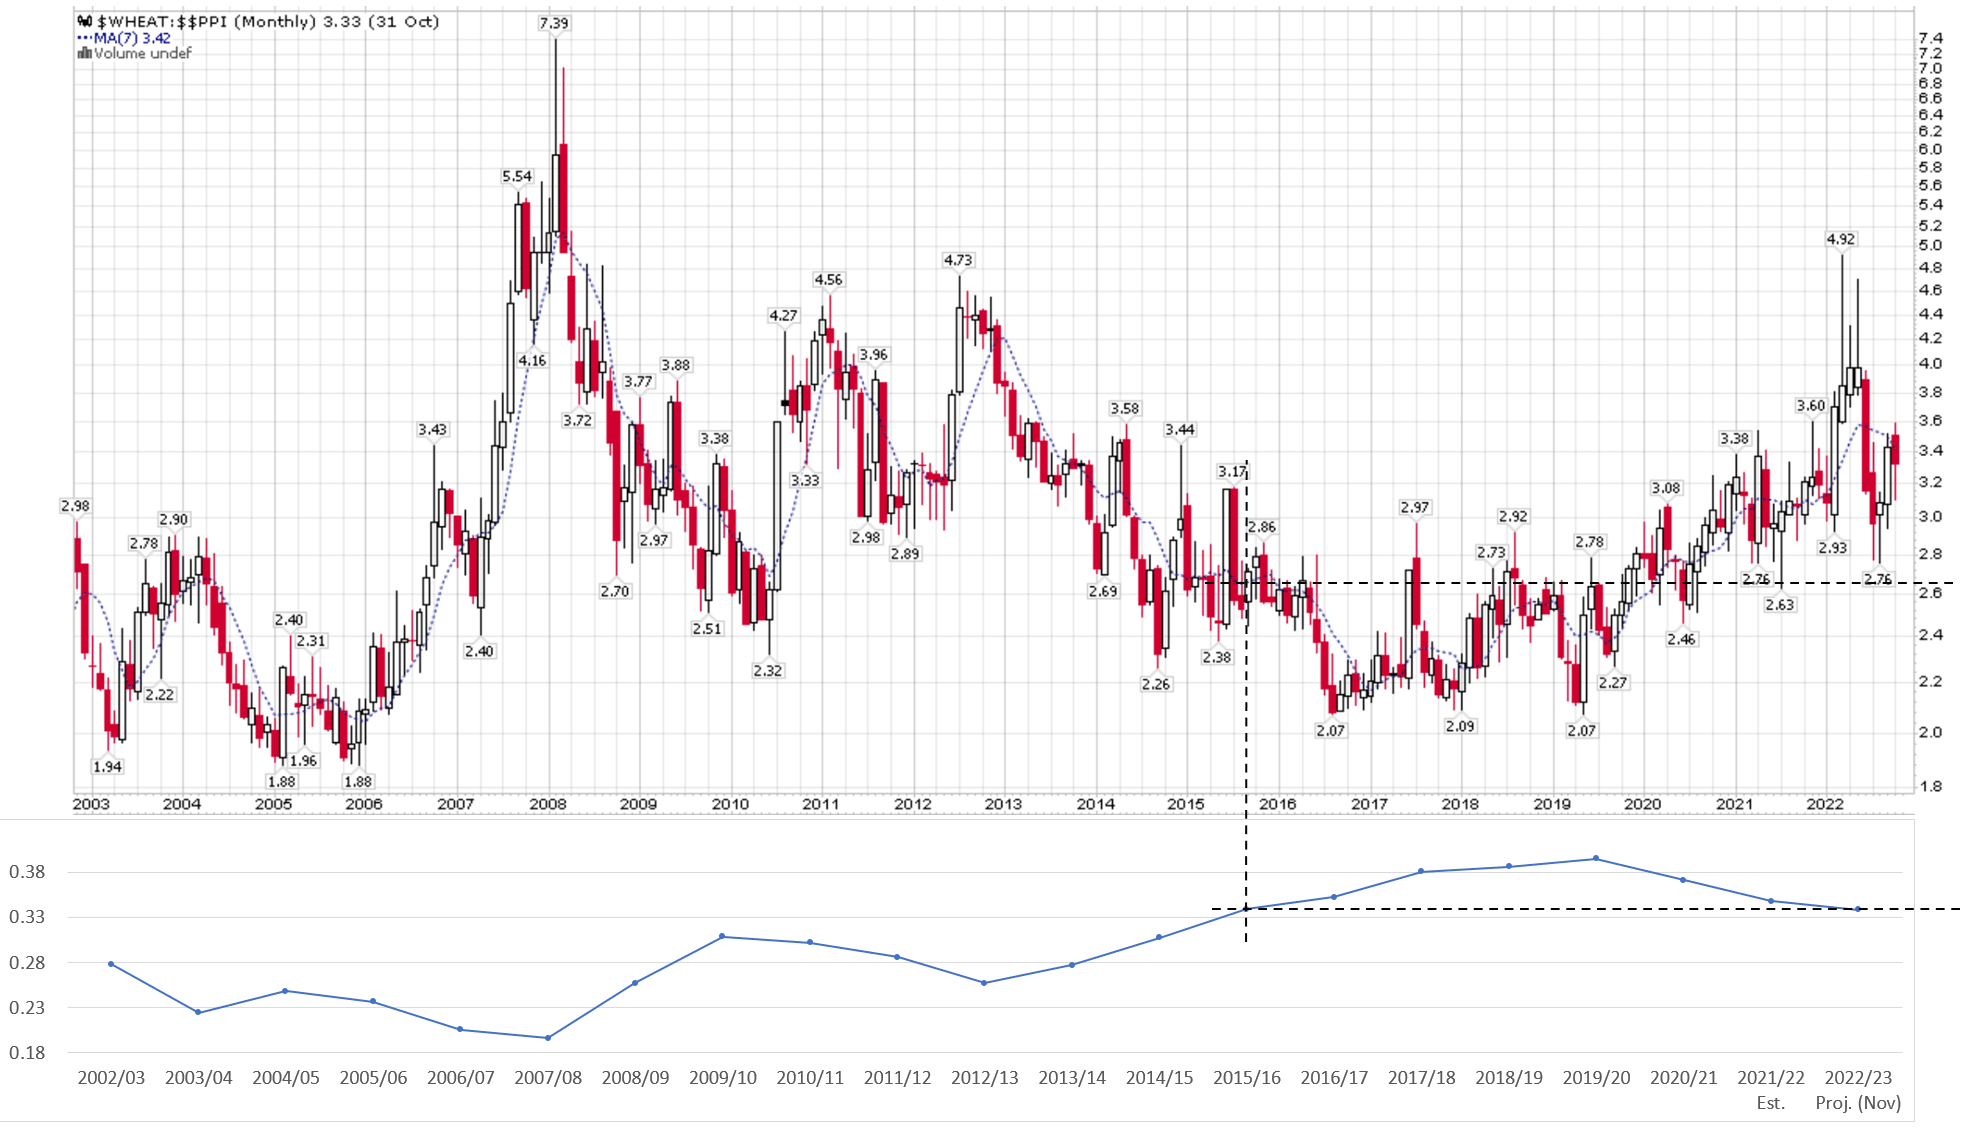
We can see that inflation-adjusted wheat prices soared to the highest level ever in 2007/2008 when the global stock/use level reached 0.20. Current stock/use level of 0.34 is consistent with circa 2015 to 2016 levels, which implies there might even be ~20% downside to wheat prices, if the war premium is removed.
Inflation Adjusted Cost Of Production Also Suggest Lower Prices
Another way to think about downside in wheat prices is to think of the cost of production. According to a recent interview with the Teucrium CEO Sal Gilbertie, the cost of production of a bushel of wheat was $4 to $4.50 in the lsat few years. However, with inflation in labour, fuel, and fertilizers, the University of Illinois estimated that the costs of production have risen 20-30%. This implies a ‘normalized’ price of $4.80 to $5.80 per bushel of wheat, versus spot prices of over $8.00.
The challenge with agricultural commodities is that price cycles tend to be short-lived, as farmers can take advantage of high prices by switching crops within a season or two.
In fact, if we look at world wheat production for major exporters, we can see that while Ukraine production has dropped significantly YoY, other regions like Canada have made up the difference (Figure 11).
Figure 11 – World wheat production of major exporters (USDA)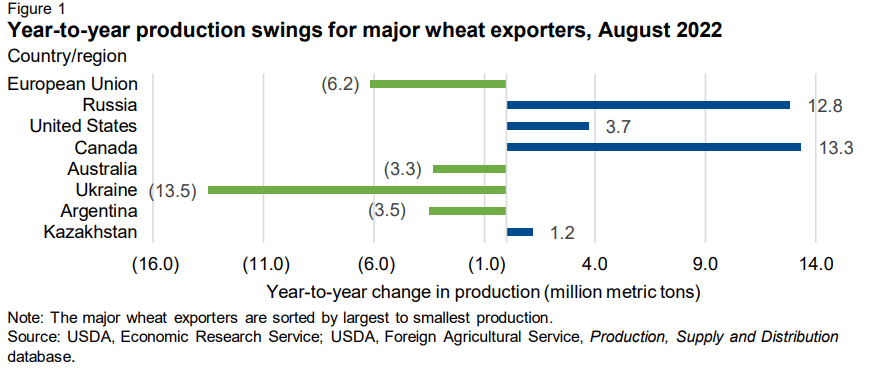
Risks To Cautious View
One of the key risks to my cautious view is that wheat prices have been very headline driven in the past few months due to the Russian/Ukraine war. For example, on November 15, when an errant missile exploded in Poland, sparking fears of an escalation in the war, wheat futures spiked by as much as 5% in a matter of hours.
Therefore, although I believe the WEAT ETF has medium-term downside as price comes back to reality with stock/use ratios, I would not recommend shorting the WEAT ETF.
Conclusion
Although headlines regarding wheat prices continue to be sensationalized by the Russia/Ukraine war and severe weather conditions in various parts of the world, global stock/use ratios suggest there might be price downside to the WEAT ETF. However, I would not recommend shorting the WEAT ETF, a bad headline in the Russia/Ukraine war can cause a massive price spike.
Be the first to comment