

Paul Morigi
This article is written in counterpoint to the recent SA article “Sir Warren Buffett Doesn’t Believe In (Or Practice) Market Timing, Nor Should You” by Second Wind Capital.
In introducing his premise that market timing does not work, the author wrote:
With that said, the purpose of today’s piece is reminder readers, that other than about perhaps once per decade, market timing doesn’t really work. Understandably, 2022 was exceptionally difficult for most 60% stocks / 40% bonds portfolios. When you experience a really nasty drawdown and defensive bonds don’t act as the cushion, I can understand why some people simply threw up their hands and want to give up. Or perhaps, others driven by recency bias and the emotionally scarring associated with living through a 2022, want to make a 180-degree shift and change tactics.
Candidly, as a proxy for short-term popularism, I’m see way too many trending articles on market timing. Within the commentary threads, of these seemingly highly popular market timing pieces, I’m seeing a lot of “all or none approaches.” People seem to think they can gracefully run between raindrops and move in and out of the market, while capturing these juicy returns and magically avoiding the nasty drawdowns.
Therefore, and notwithstanding the ridiculously warm January 2023 to-date, at least here in the Northeast, January tends to be a month of reflection, planning, and thinking about the year ahead.
To that end, my concern is that pain, experienced in 2022, was so acute, that many people’s visceral reaction might negatively impact the trajectory of their future results.
My issue with the article is that the author completely fails to substantiate his core thesis that “other than about perhaps once per decade, market timing doesn’t really work“.
I submit that Warren Buffet’s letters from 1978 through 2020, while interesting to read, do not make the author’s case. Making the case for or against market timing requires a reasonable statistical comparison and validation, which I think the author fails to provide.
This article will describe methodologies accompanied by charts and tables which provide statistical comparisons of both Strategic and Tactical Asset Allocation, which make a strong case for well-structured market timing strategies.
Let’s Start With Warren Buffett
If Warren Buffett is to be used as an authoritative source, we should examine the performance record of Berkshire Hathaway (BRK.A) (BRK.B) for use as a benchmark.
This is a performance table for BRK.B, which includes monthly performance data, annual Compound Annual Growth Rate and Maximum Monthly Drawdowns (this is the worst drawdown you would have seen across a series of monthly statements), and a statistical summary.
Berkshire BRK.B Performance 2000-2022 (Author)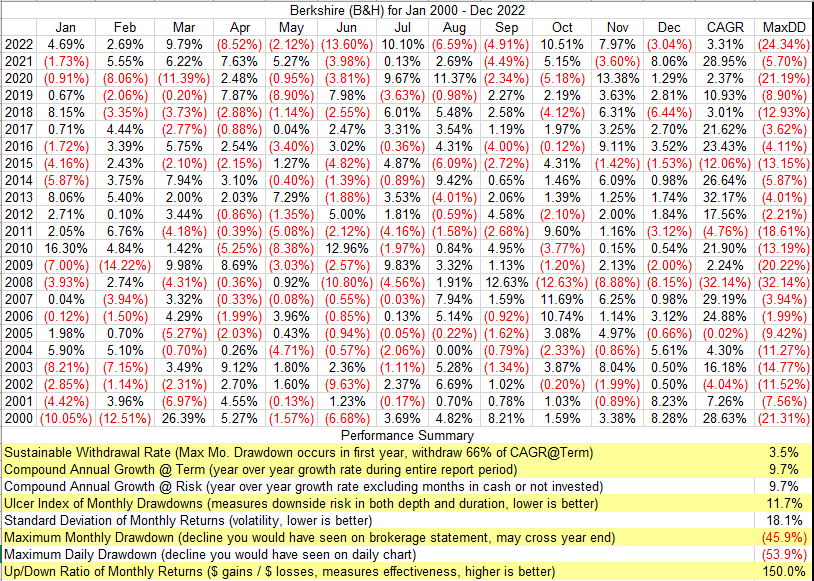
The 9.7% annualized return is very acceptable. But is it acceptable in light of the peak maximum monthly drawdown of 45.9% of the investment? Or the 13 years in which the drawdown exceeded the annualized return? There is a large body of investors who dump their investments when losses exceed 20% or 30%!
Asset Allocation Compared: Tactical versus Strategic
The Vanguard Balanced Index Fund is the poster child for Strategic Asset Allocation and is widely considered a suitable core portfolio holding for all investors. Vanguard Balanced applies a fixed 60% allocation to equities and 40% allocation to fixed income.
While Open End mutual funds provide a greater depth of history; we prefer to use Exchange Traded Funds (‘ETFs’) wherever possible. We will use two Vanguard ETFs with infill from their similarly indexed Open End Funds (‘OEF’) for depth of history.
-
VTI (inception 2001) & VTSMX: the Vanguard Total Stock Market Index Fund includes US large, small, and mid-cap stocks. Its holdings are nearly identical to those of the equity portion of the Vanguard Balanced Fund. Its OEF equivalent is VTSMX, with history back to 1992.
-
BND (inception 2007) & VBMFX: the Vanguard Total Bond Market Index Fund, invests in US government and corporate investment grade bonds. Its holdings are nearly identical to those of the fixed income portion of the Vanguard Balanced Fund. Its OEF equivalent is VBMFX, with history back to 1987.
A 60% allocation to VTI and 40% allocation to BND approximates the results of VBINX, the Vanguard Balanced Index Fund for which there is no comparable ETF.
Comparison Methodology
Our comparison consists of three setups
-
Strategic Asset Allocation is represented by holding the Vanguard Balanced Index Fund
-
Tactical Asset Allocation is represented by two sets
The Tactical Asset Allocation Model will employ two rules for Tactical Asset Allocation:
-
If one or both funds are rising, the entire portfolio is allocated to the better-performing fund.
-
If both funds are declining, the entire portfolio goes to cash.
Strategic Asset Allocation
Vanguard Balanced Fund Performance 2000-2022 (Author)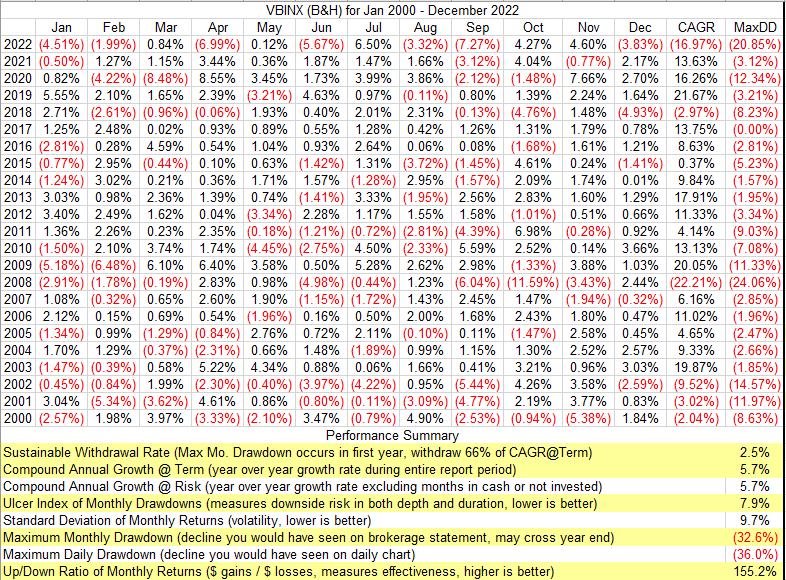
The Vanguard Balanced Index Fund CAGR of 5.7% is under Berkshire’s 9.7% but so too is the 32.6% Maximum Monthly Drawdown compared to Berkshire’s 45.9%. Overall, a win for Berkshire for those who can stomach the volatility.
Tactical Asset Allocation using Rate of Change
TAA Example #1 Performance 2000-2022 (Author)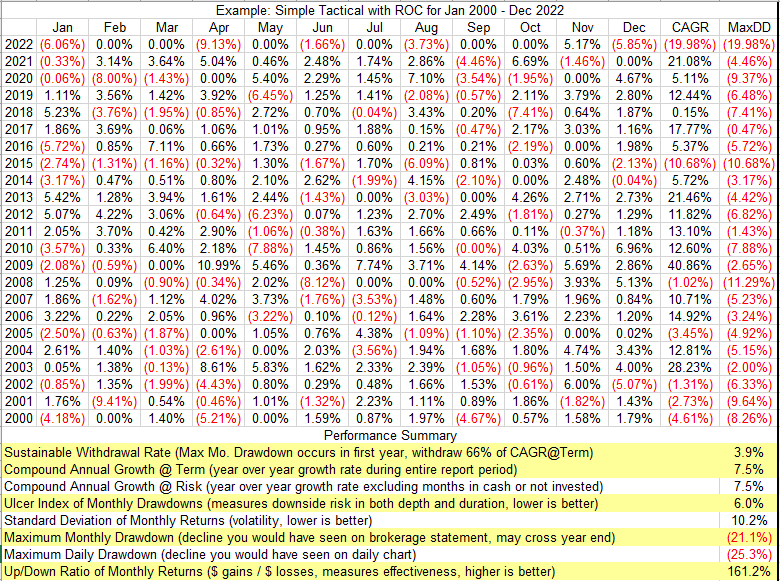
The first of our Tactical Asset Allocation (market timing) strategies improves on both the CAGR and considerably reduces the Maximum Monthly Drawdown. This one is probably getting more into the comfort zone for many investors who lose sleep over high drawdowns.
Tactical Asset Allocation using Adaptive Dynamic Momentum
TAA Example #2 Performance 2000-2022 (Author)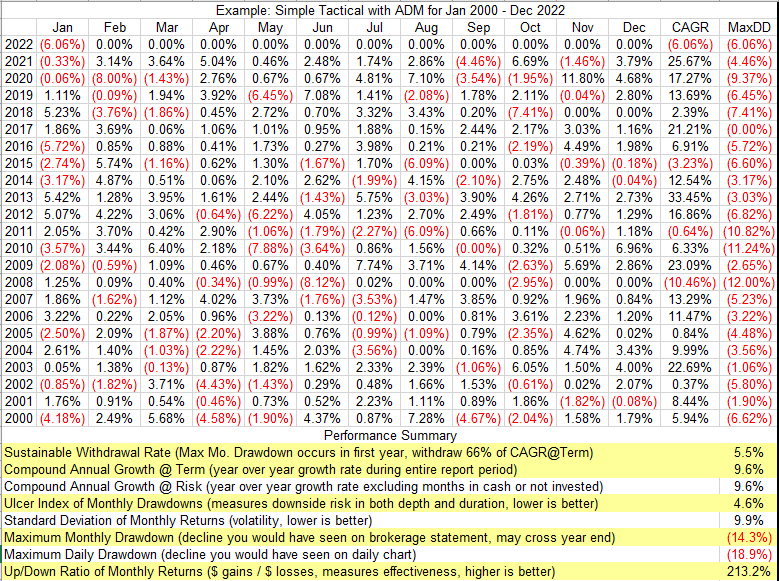
The second of our Tactical Asset Allocation examples using Adaptive Dynamic Momentum is a marked improvement over the first as well as an improvement over Berkshire. The CAGR of 9.6% is just 0.1% under Berkshire’s 9.7%; however, the Maximum Monthly Drawdown of 14.3% is a smashing improvement over Berkshire’s 45.9%. There are very few investors who would not trade 0.1% of return for a 69% reduction in risk. Talk about sleeping well at night!
A Picture Is Worth A Thousand
This chart provides a visual comparison of Strategic Asset Allocation to Tactical Asset Allocation showing the significant improvements over buy and hold made possible by “market timing”.
Chart of Strategic vs Tactical Asset Allocation 2000-2022 (Author)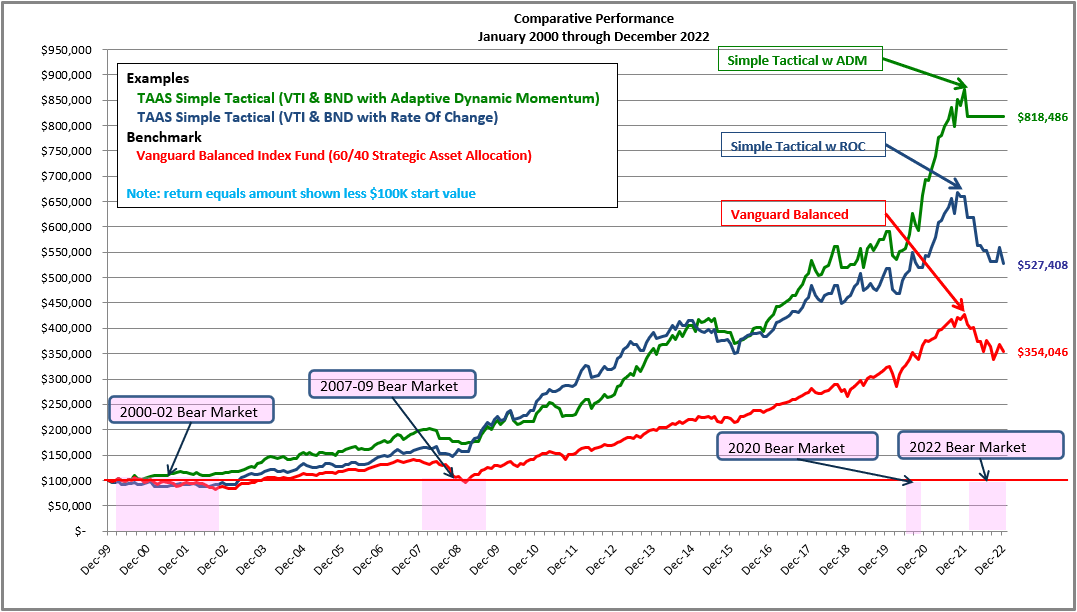
Wait, There is One More
So far, I have shown that Tactical Asset Allocation can match Berkshire’s return with less than half the drawdown. But what if we could improve on Berkshire’s return by 46% while reducing the Maximum Monthly Drawdown by 83%?
This is the performance table from our Tactical Adaptive Global strategy.
TAAStrategies Adaptive Global Performance 2000-2022 (Author)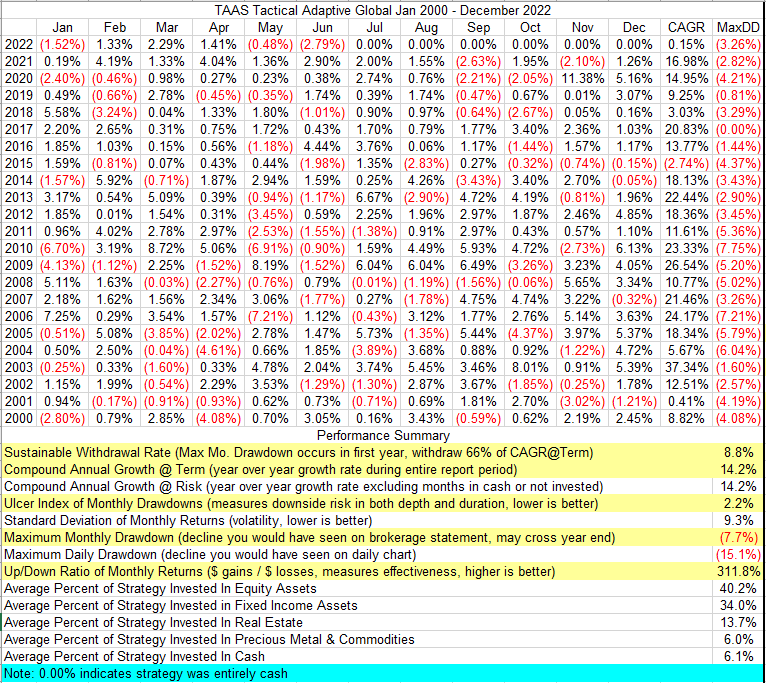
Conclusion
Let’s summarize the results in a simple table.
|
CAGR |
Max Monthly Drawdown |
|
|
Berkshire |
9.7% |
(45.9%) |
|
Vanguard Balanced B&H |
5.7% |
(32.6%) |
|
Tactical Example #1 |
7.5% |
(21.1%) |
|
Tactical Example #2 |
9.6% |
(14.3%) |
|
Tactical Global |
14.2% |
(7.7%) |
We now have in hand statistical evidence that market timing can not only improve returns but significantly reduce risk. The biggest distinction between Strategic and Tactical Asset Allocation is that Strategic seeks to reduce risk by spreading it around while Tactical seeks to reduce risk by cutting it.
Additional Reading
A number of whitepapers on Tactical Asset Allocation can be found on the Insights page of my website.
Be the first to comment