


nuchao
Public equities just had a calamitous first half of the year:
- US stocks (SPY) have had their worst first half in over 50 years.
- For the Nasdaq (QQQ), it was the worst first half ever.
Part of the sell-off was overdue after the post-COVID rally in 2020.
Between rising inflation and interest rates, the market has adjusted drastically. As a result, valuations have now retraced to their historical average or below.
However, earnings could see downward revisions in the coming quarters, leading to further downward pressure.
It’s one thing for stock prices to go down. Fundamentals (revenue, earnings) are the denominator here. If guidance gets cut, valuations may be less attractive than initially thought.
This tweet from Gavin Baker sums up the current environment ahead of earnings season very well:
The commentary provided by ServiceNow (NOW) CEO Bill McDermott seems to confirm the macro environment is affecting spending decisions for enterprise customers:
There’s one filter on all of this now. And that is fast return on investment. And if you can’t put an architecture in there that gives the customer a fast ROI, chances are, you’re going to get postponed.
Most software businesses I invest in are mission-critical or essential for companies to operate. However, we have seen household names struggle in a recession in the past.
A software company like Salesforce.com (CRM) saw revenue growth collapse from 50% to 20% Y/Y during the Great Recession. The graph below shows the drop in revenue growth from late 2008 to early 2009.
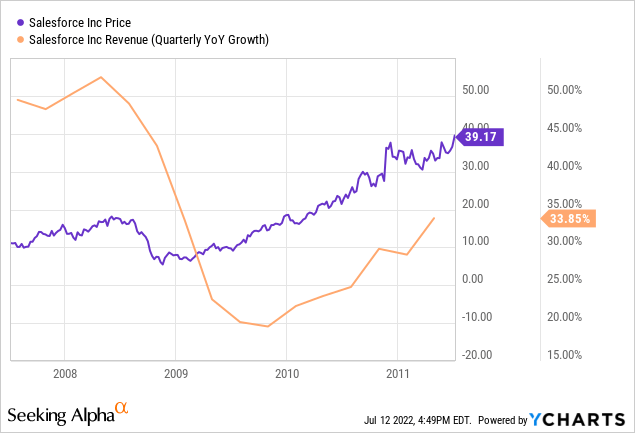
Revenue growth eventually re-accelerated after a few quarters. However, it’s important to note the stock bottomed at the end of 2008. So the best time to buy CRM was when the business faced collapsing revenue growth in a challenging economy.
By the time we could see evidence that revenue growth was re-accelerating, the stock had already hit a new all-time high in 2010.
The market is always forward looking.
Many individual stocks are beaten down today, far worse than the market.
Salesforce was one of the few public SaaS companies in 2008. So I looked at where CRM traded when the S&P 500 was down ~20% in October 2008. CRM was more than 40% down (a sell-off comparable to today).
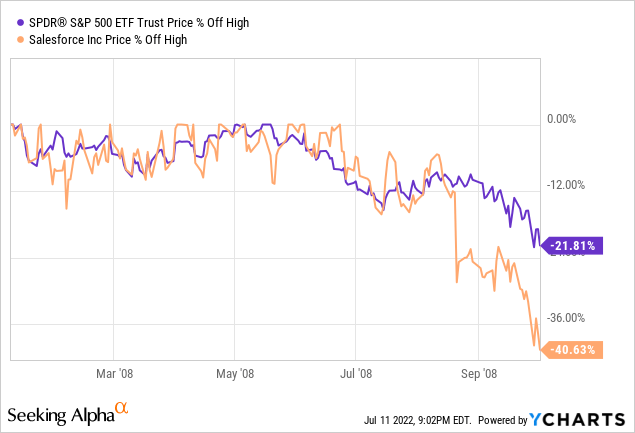
First, we must highlight that the S&P 500 dropped 48% from its previous high by March 2009. So we were far from the bottom.
Second, since there was no way to time the bottom back then (just like today), we will look at returns assuming we bought the S&P and CRM in October 2008, when the sell-off was comparable to what we are seeing today.
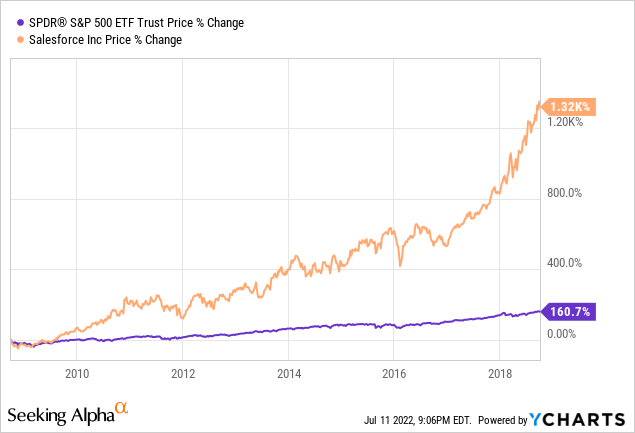
So what happened in the following 10 years?
- The S&P 500 rebounded and rose 161% from October 2008 to 2018.
- Meanwhile, CRM turned out to be a 14-bagger (up 14X).
I know I’m cherry picking. Not all stocks ended up performing like CRM. Far from it. And many stocks currently down 40% or more from their previous high will never recover.
My point is that we shouldn’t judge stocks based on how far they have fallen from their previous high as a reason to ditch them, even if they may have more to fall in the near term.
These massive market movements can be highly confusing for investors and create a sense of chaos. It’s a challenging time to be an investor, so it requires to be process focused.
For now, we must buckle up and hold on to our seats.
In this context, I would like to zoom in on three companies that have the potential to do what Salesforce did more than 14 years ago: Not only survive but thrive in the next decade.
I cover many more stocks in my portfolio, but I selected three companies that will give us a good representation of the dynamics at play this earnings season:
- Alphabet (GOOG) (GOOGL): Advertising and Cloud.
- Snowflake (SNOW): Consumption-based enterprise data software.
- HubSpot (HUBS): Subscription-based SMB CRM software.
Let’s review.
Alphabet (GOOG)

Google Logo (Company Website)
Alphabet has been a strong performer in the App Economy Portfolio for many years. It’s one of the Starter Stocks of the service.
I often mention that mega caps (companies > $400B market cap) are not discussed much in our community because they tend to be well covered elsewhere. However, the recent market sell-off has created a fantastic entry point, and Google has the features that matter in the current environment: A stellar balance sheet and strong cash flow margins.
According to eMarketer, Google is expected to remain the market leader in digital ad revenue, with market share only marginally shrinking.
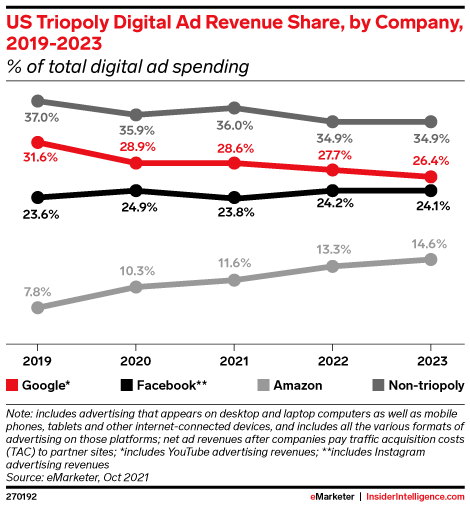
US Digital Ad Revenue Market (eMarketer)
A key reason for this dominance is Google’s lead in search. Across Google Search, Chrome, and Android OS, the company commanded about 57% of the US Search ad revenue in 2021, well ahead of No. 2 Amazon (19%).
Beyond advertising, Google builds the hardware to bring more users to its ecosystem. And we’re seeing the first signs of success in this area.
In Q1 2022, Google’s market share in smartphone sales was 2% (+1pp Y/Y). While it’s still a far cry from the leaders in the space, it’s another step in the right direction, and there’s a lot of room for growth, even for a company the size of Google.
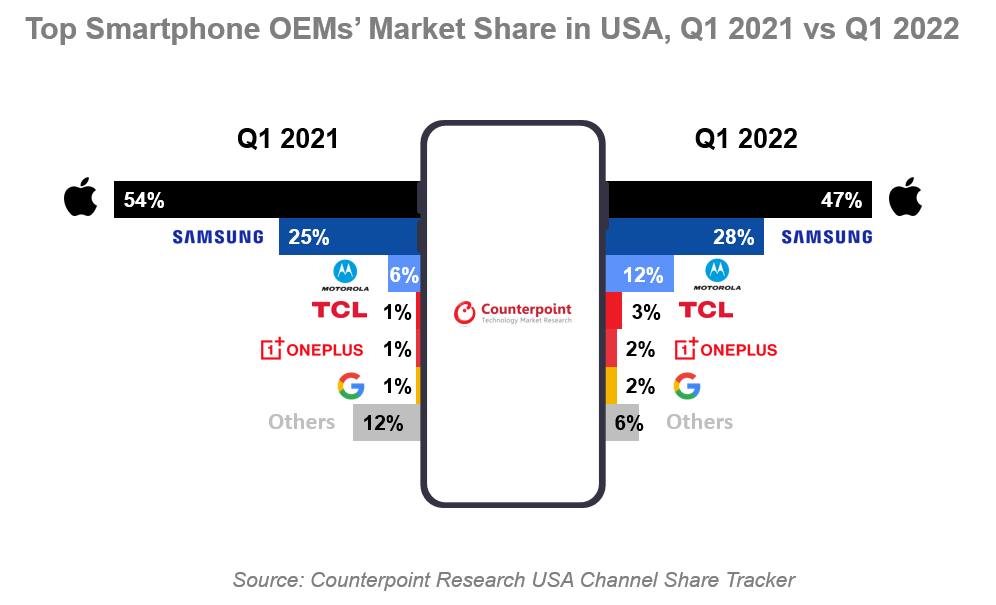
US OEM Market Share (Counterpoint research)
The company made several announcements at its I/O keynote:
- A more affordable Google Pixel smartphone (6a).
- Pixel Watch, with Fitbit integration (similar to Apple Watch).
- Pixel Buds Pro with active noise cancellation (similar to AirPods Pro).
- A new Android-powered tablet.
- AR glasses with real-time translation.
- Many AI functionalities like Google Lens.
- Google Wallet app with new features.
- Google Map with an “immersive view.
Let’s review the most recent quarter:
Q1 FY22 Highlights
- Revenue grew +23% to $68B, beating consensus by +$0.2B.
- Operating margin was 30% (flat Y/Y).
- Operating cash flow was $25B (+30% Y/Y).
- Free cash flow was $15B (+15% Y/Y).
- Balance sheet: Cash $134B and Long-term debt $29B.
Revenue by segment:
- Google Search and other $40B (+24% Y/Y).
- YouTube ads $7B (+14% Y/Y).
- Google Network $8B (+20% Y/Y).
- Google Cloud $6B (+44% Y/Y).
- Google Other $7B (+5% Y/Y).
- Other Bets $0.4M (+122% Y/Y).
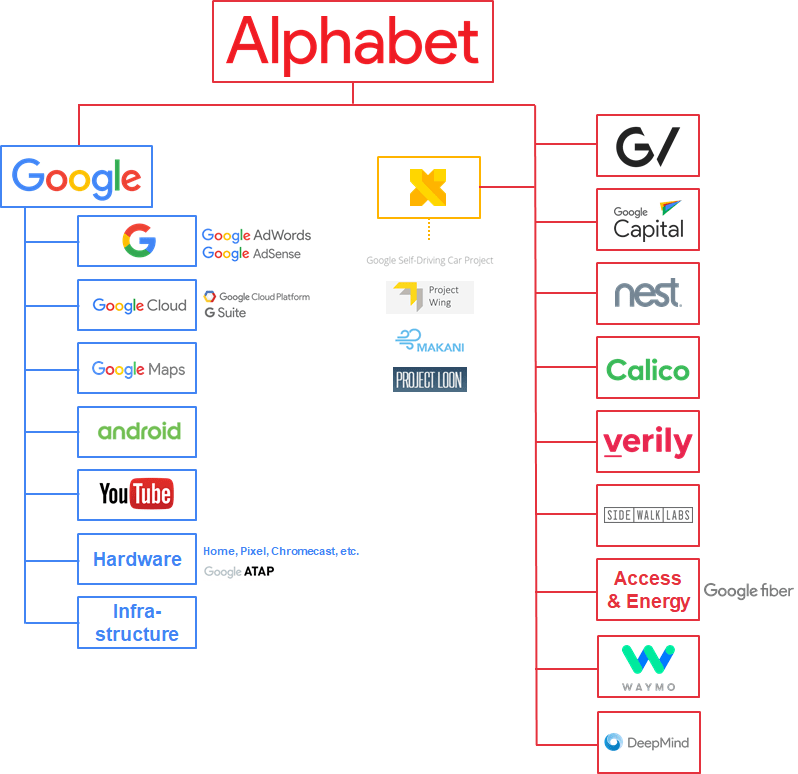
Alphabet Business (CB Insight)
Alphabet had a modest beat on the top line while maintaining high margins. The slowdown in revenue growth was due to tougher comps.
YouTube was ~10% of the company’s revenue after growing only +14% Y/Y. The relatively slower growth was attributed to the war in Ukraine during the call, with some advertising softness in Europe.
YouTube has 2 billion monthly signed-in users. Following the transition from desktop to mobile, the platform has a significant opportunity in short-form videos, a format meant to compete with TikTok and other social media apps. YouTube Shorts is now averaging 30 billion daily views (4x Y/Y). Additionally, YouTube TV recently crossed 5 million subscribers.
Google Cloud is ~9% of the top line. It was the fastest-growing segment (excluding other bets) and barely slowed from Q4 FY21. The segment also showed healthy margin improvements, with operating loss margin rising to -16% (+8pp Y/Y).
Google Cloud is gaining market share, growing +44% Y/Y, slightly faster than AWS (+37% Y/Y), but short of Microsoft Azure (+49% Y/Y) in Q1 FY22.
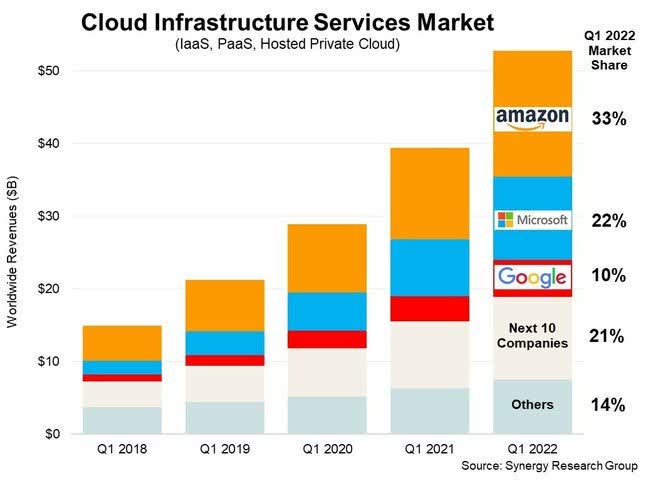
Cloud Infrastructure Service Market (Synergy Research Group)
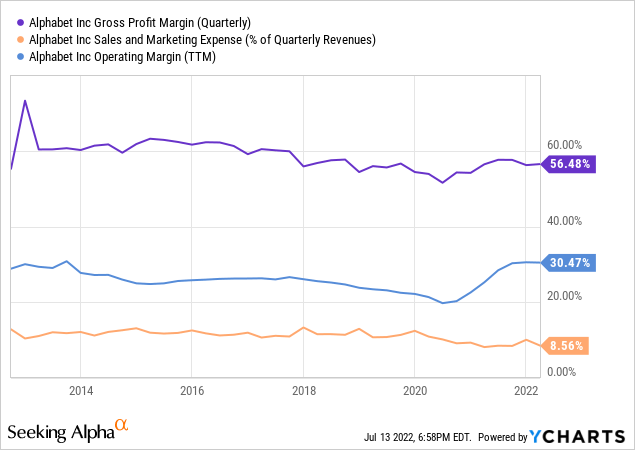
Let’s look at the margin trends:
- Gross margin has rebounded to 56%.
- Sales & Marketing costs are very low, at 9%.
- Operating margin is trending up at 30%.
The company’s most recent financial results for Q1 FY22 can be summarized as follows:
- Continued growth across all segments (+23%) – showing resiliency.
- Excellent gross margin at 56% – showing long-term potential.
- Flagging sales and marketing costs, at 9% – showing scalability.
- High operating margin of 30%, showing exceptional profitability.
- Gigantic net cash position (more than $100B) and generating $97B in cash from operations in the past year – showing sustainability.
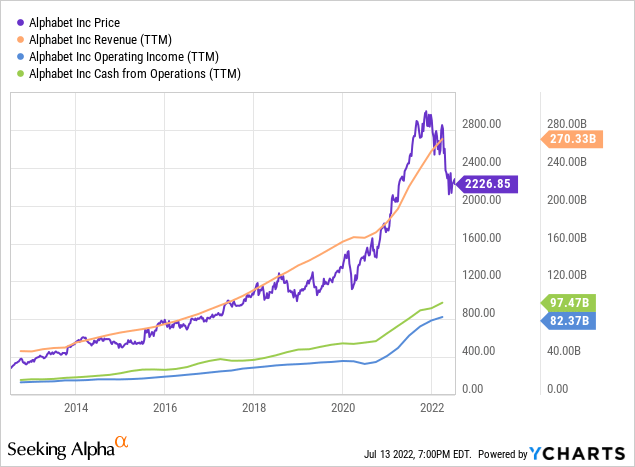
It’s not hard to see the current opportunity in the chart above.
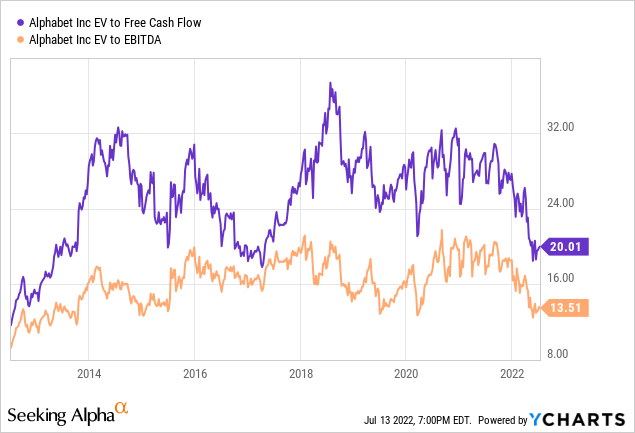
Despite maintaining a steady growth profile, GOOG is nearly the cheapest it’s been since 2014. The company is trading at about:
- 20 times FCF
- 14 times EBITDA
It was rarely ever cheaper in the past decade.
Google was No. 7 on the Glassdoor Best Places To Work in 2022, by far the best-ranked mega-cap.
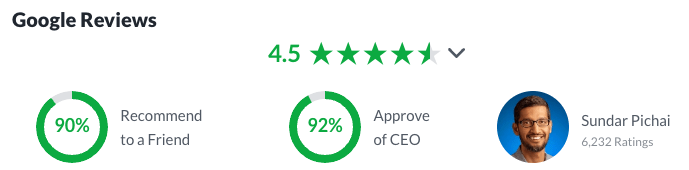
Google Employee Reviews (Glassdoor)
To wrap it up:
- Opportunities:
- Google Cloud is still in its growth phase and has yet to turn profitable.
- Other bets could unlock significant value to shareholders over time (DeepMind, Waymo, Calico, etc.).
- Risks:
- In a challenging macro environment, advertising budgets could get cut significantly. Case in point, Google saw negative revenue growth in Q2 FY20 following an ad decline due to COVID. As a result, we should expect a slowdown in the near term (at least temporary).
- Google is trying to avoid another US Justice Department lawsuit by splitting up its adtech business. Unfortunately, it’s impossible to predict regulators’ next move. Splitting parts of the company might unlock value, but it could also create new challenges.
- Google Play is facing pressure over the potentially monopolistic nature of the billing system in its Google Play store.
Snowflake (SNOW)
Snowflake Logo (Company Website)
Snowflake is a relatively recent position for me.
SNOW has been hammered like the rest of the market and is now trading close to an all-time low.
In a challenging macro environment, high-multiple stocks could continue to suffer, so I’m taking my time (I like to build positions over several quarters).
Consider this: Snowflake has beaten expectations by 7% on average over seven quarters as a public company. Yet, the stock is trading marginally up compared to the $120 IPO price (September 2020).
I was reluctant to start a position in SNOW out of the gate, especially after a red-hot September 2020 IPO that saw its price double its first day. Now it trades more than 60% down, and we have more evidence of the company’s success. That usually makes me a happy buyer.
The company’s mission is to enable every organization to be data-driven.
Snowflake is well-positioned to benefit from three secular tailwinds:
- Workload is moving to the cloud.
- Data volume is growing.
- Data is driving decision-making.
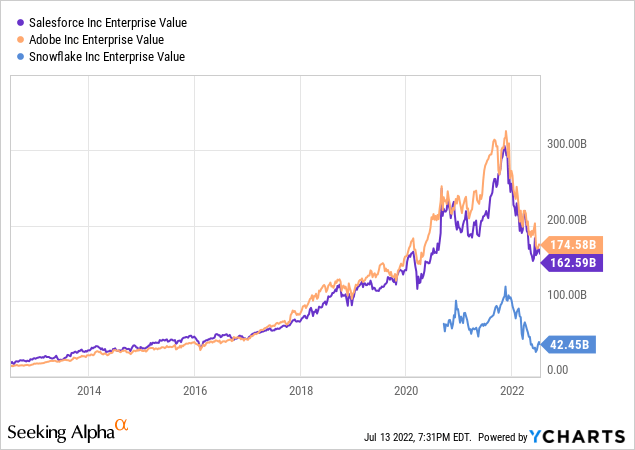
Management expects Snowflake to be the fastest cloud software business to reach $10B in annual revenue. So when I think about how big the company might become, I look at Adobe (ADBE) or Salesforce. After 10 years, these best-in-class cloud businesses have proven that they don’t have a “terminal” value, with growth suddenly becoming anemic. Instead, they have continued to grow at scale and increase their value proposition to customers, even after decades of operations.
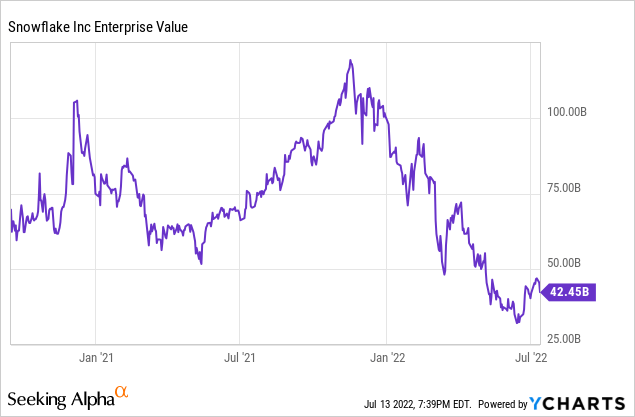
In this context, I find SNOW’s ~$42B valuation acceptable and believe it could still deliver tremendous returns in the decade ahead.
Snowflake is already profitable on an adjusted basis and has generated an 18% free cash flow margin.
Snowflake Ecosystem (Company Presentation)
At the end of the most recent quarter, Snowflake had:
- 6,322 Total customers (+40% Y/Y, +6% Q/Q).
- 206 Customers with TTM revenue > $1M (+98% Y/Y, +12% Q/Q).
- 506 Forbes Global Customers (+22% Y/Y, +3% Q/Q).
- Net revenue retention rate of 174% (+6pp Y/Y).
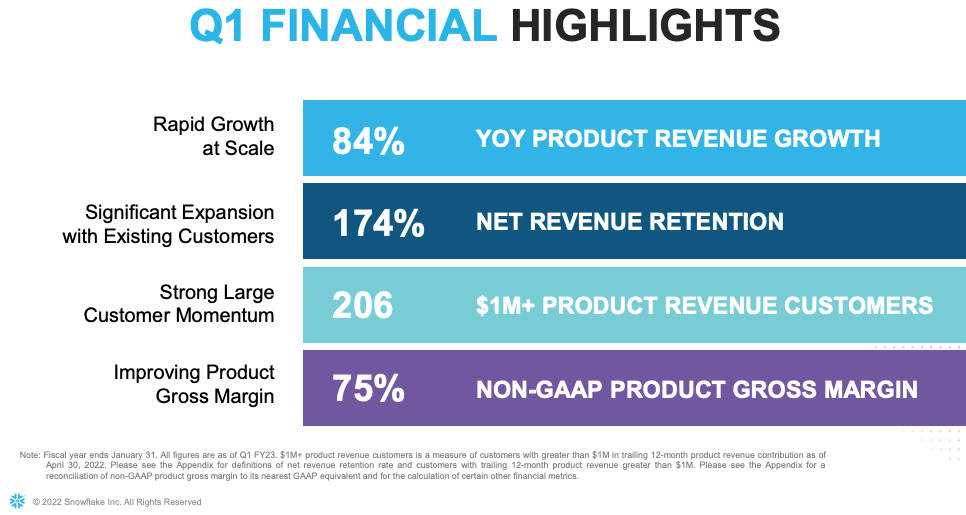
Snowflake Q1 FY23 Earnings (Company Presentation)
Q1 FY23 Highlights:
- Product Revenue was $394M (+84% Y/Y, vs. guidance of +80%).
- Product Gross margin 66% (flat Y/Y).
- GAAP operating loss margin was -45% (+45pp Y/Y).
- Non-GAAP operating margin was 0% (+66pp Y/Y), vs. guidance of -2%.
- Operating cash flow was $185M, a 44% OCF margin (+34pp Y/Y).
- Free cash flow was $172M, an 41% FCF margin (+35pp Y/Y).
- Cash and investments on the balance sheet were $3.8B.
- Long-term debt was $0.2B.
Guidance:
Q2 FY23:
- Product Revenue ~$435M-$440M (+72% Y/Y, +11% sequentially).
- Non-GAAP operating margin -2%.
Full Year FY23
- Product Revenue $1.9B (+66% Y/Y) – unchanged.
- Non-GAAP operating margin 1% – unchanged.
FY23 guidance shows growth normalization and continued margin expansion.
Let’s put the past year in context:
- FY22 Guidance (February 2021): Revenue $1B and adjusted op. margin -19%.
- FY22 Actual: Revenue $1.2B (+$0.2B) and adjusted op. margin -3% (+16pp).
Management has a history of underpromising and overdelivering. That makes the FY23 guidance even more compelling.
Now let’s look at the GAAP margin trends, which factor in stock-based compensation.
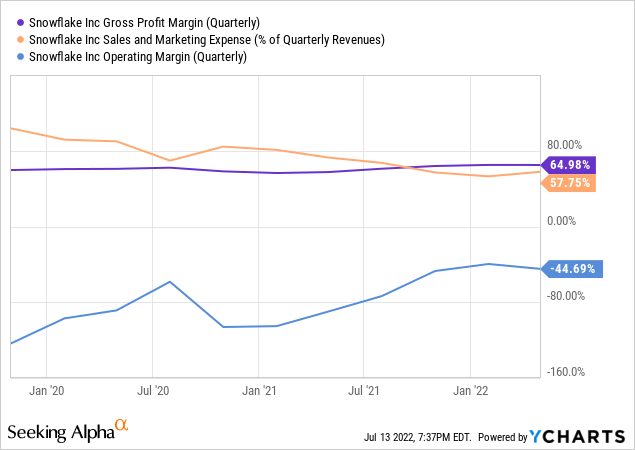
- Gross margin has been improving, at 65% in Q1 FY23.
- Sales and marketing costs remained high, at 58% of revenue in Q1 FY23.
- Operating margin is improving but deep in the red, at -45% in Q1 FY23.
Stock-based compensation is the main difference between GAAP and non-GAAP margins:
- In FY22, SBC was $675M (+114% Y/Y) or 55% of revenue in FY22.
- In Q1 FY23, SBC was $183M (+10% Y/Y) or 44% of revenue (-29pp Y/Y).
I expect SBC to represent less in % of revenue over time. From a dilution perspective, the impact is relatively small (FY22 SBC was less than 2% of the market cap).
We can summarize the recent results as follows:
- Exceptional revenue growth at +84% Y/Y – showing strength.
- High gross margin at 65% – showing long-term potential.
- Falling sales and marketing costs – showing the scalability.
- Improving adjusted operating margin – showing operating leverage.
- Positive net cash position on the balance sheet and positive cash flow from operations – showing sustainability.
What should we expect from Snowflake’s margin over time?
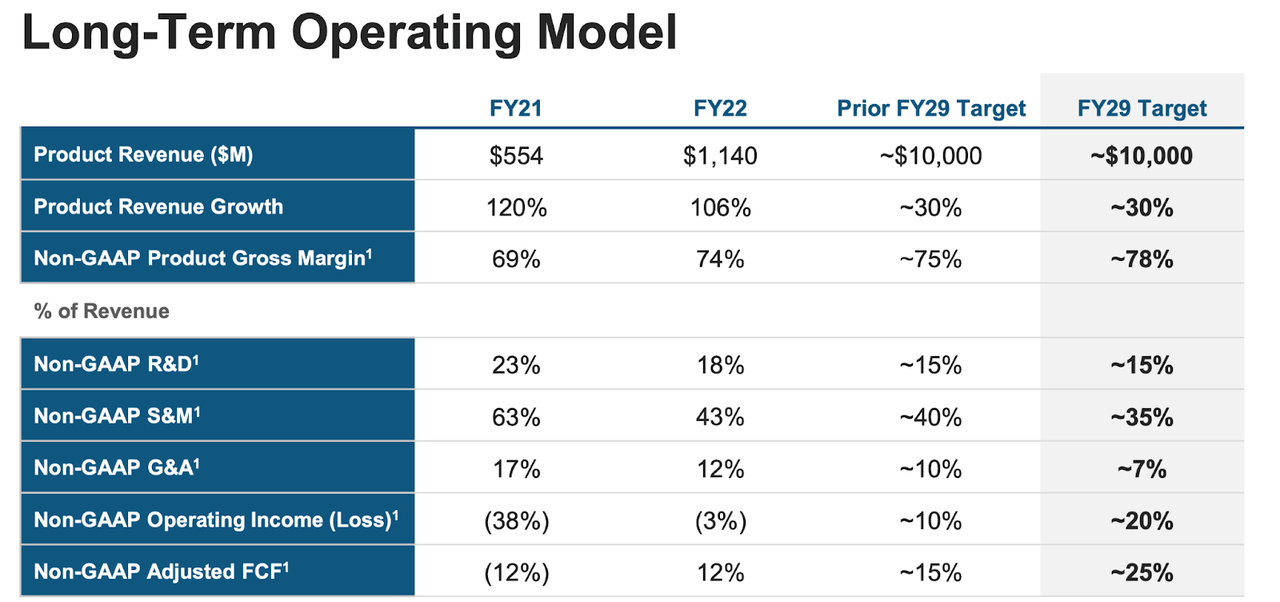
Management previously shared their long-term operating model by the time they reach $10B in annual revenue. During the recent investor day, they significantly upgraded the margin targets for FY29:
- Revenue growth around +30% Y/Y (unchanged).
- Non-GAAP gross margin around 78% (+3pp).
- Non-GAAP operating margin around 20% (+10pp).
- FCF margin is around 25% (+10pp).
In a Q&A session last year, CFO Michael Scarpelli clarified that the margin targets were worst-case scenarios. Additionally, the projection appears very conservative since Snowflake is on track to achieve an FCF margin of 16% in FY23.
Snowflake Long-Term Target (Investor Day 2022)
Snowflake raised $3.4B at a $30B valuation for its IPO in 2020. However, public investors never traded SNOW at the offering price of $120 per share. Instead, shares popped +112% on their first trading day. Unfortunately, the company left close to $4B on the table.
As soon as its first day as a public company, SNOW had a valuation north of $60B. And today, almost two years later, we can buy shares at a 30% discount. So far, SNOW has not been a great investment for public investors, but it doesn’t mean it will stay that way.
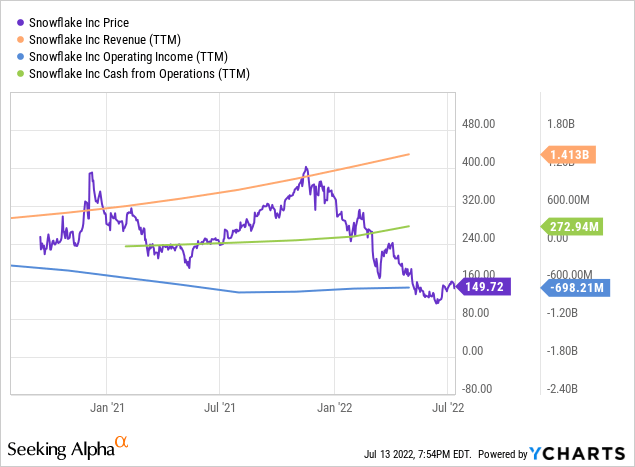
Since the IPO, SNOW has always been an expensive stock. The chart below shows how SNOW’s stock price fell 41% since IPO, while the trailing revenue multiple fell 83%.
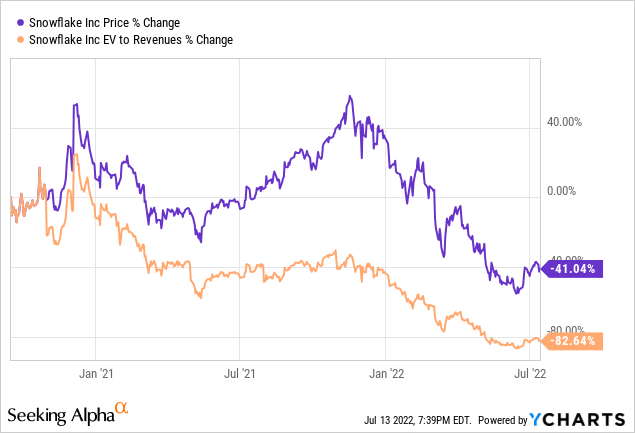
SNOW is now trading on the low-end of its valuation spectrum, at about 21 times forward sales. But let me be clear: It’s not a cheap stock—quite the opposite. My only point here is that it was never cheap since the company is public, which should be expected from a company of this scale doubling its revenue in the past year.
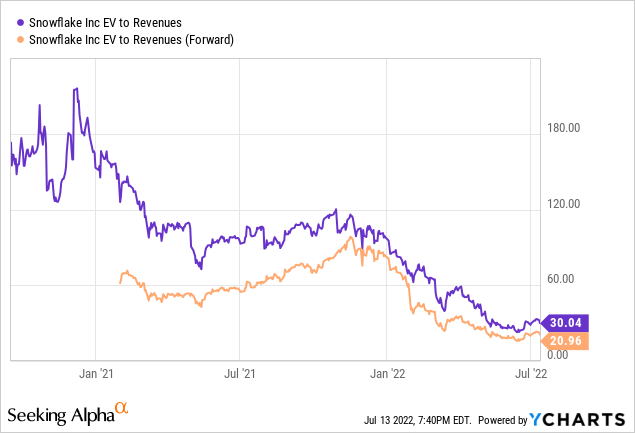
More context on Snowflake’s valuation:
- 30 times FY22 revenue (past 12 months).
- 21 times FY23 revenue estimates.
- 11 times FY24 revenue estimates.
- 9 times FY25 revenue estimates (with growth still > 40% by then).
As you can see, even assuming the company merely meets Wall Street’s expectations moving forward, it will “grow into” its valuation multiple pretty quickly. Since going public, the company has a stellar track record, beating expectations by 7% on average over six quarters.
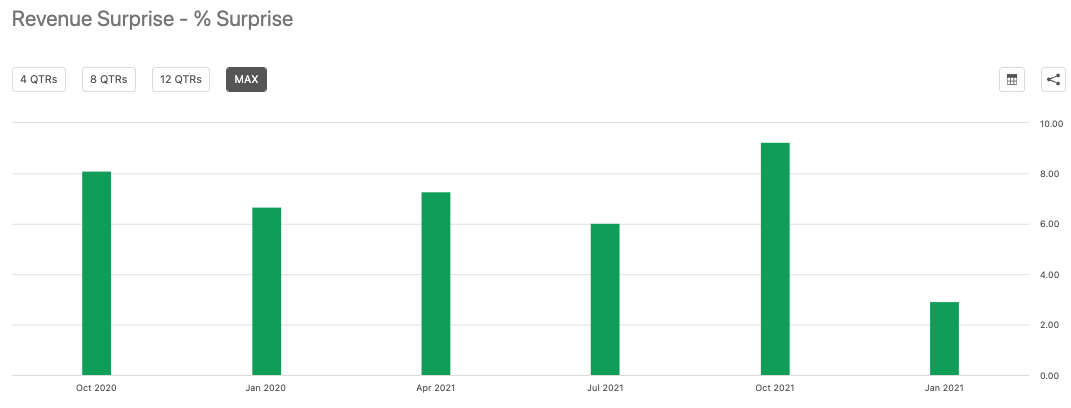
Snowflake Revenue Surprise (Seeking Alpha)
This type of outperformance can compound over time. To illustrate, Q1 FY23 estimated revenue was $350M when the company went public 22 months ago. Instead, the company just delivered $422M. So in less than two years, the difference between Wall Street’s estimates and reality was more than 20%. So when I say SNOW is trading at 9 times FY25 revenue estimates, it might be even less if the uptrend continues.

Snowflake Consensus Revision Trend (Seeking Alpha)
Snowflake’s revenue multiple will compress significantly in the coming years. But that’s beside the point. Multiple compression and strong stock performance are not mutually exclusive.
Given the dollar-based net retention rate above 170%, high revenue growth could go on for many years, even without solid customer growth.
The company has stunning reviews on Glassdoor
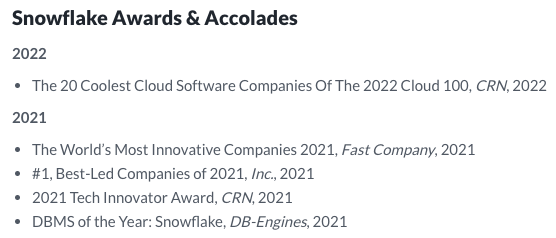
Snowflake Accolades (Glassdoor)
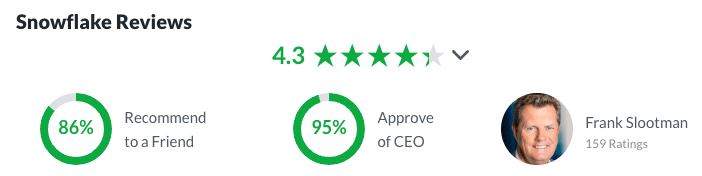
Snowflake Employee Reviews (Glassdoor)
To wrap it up:
- Opportunities:
- Snowflake’s track record of outperformance could lead to outsized returns for shareholders. I would not bet against this management team given their prior execution at ServiceNow.
- The company’s long-term margin profile has improved dramatically in the past few quarters, indicating management has been conservative.
- Risks:
- If enterprise customers start looking closely at their operating expenses, the consumption model could prove challenging, at least temporarily.
- Snowflake has turned cash flow positive. However, stock-based compensation remains very high in % of revenue. So it will be something to watch in the coming quarters (we want to see it go down).
- Valuation still has room to compress if we see a rapid revenue growth decelleration in a more challenging environment. I would not be surprised if SNOW fell another 50%. As a result, this stock is not a good fit for every portfolio and depends on an investor’s time horizon. Building a position over several quarters is a great way to alleviate this risk.
HubSpot (HUBS)
HubSpot Logo (Company Website)
HubSpot is a long-term winner of the App Economy Portfolio. I started my position in 2017, and it has become my sixth largest holding.
I previously shared my bull case here in 2019. The business has executed spectacularly since then. Meanwhile, the stock has erased the last two years of gain.
With almost 144,000 customers and 13 office locations worldwide, HubSpot helps SMBs (small-and-medium-sized businesses) create valuable experiences that attract and engage prospects and customers through relevant and helpful content. They call it “inbound marketing.”
HubSpot has all the traits I love about investing in enterprise software:
- Recurring SaaS revenue model.
- Strong underlying unit economics.
- Large and growing TAM opportunity.
- Balancing fast growth with profitability.
- An extensive ecosystem with new products over time.
Yamini Rangan stepped in as CEO in 2021. The two co-founders, Brian Halligan and Dharmesh Shah, are still involved as Chairman and CTO.

Yamini Rangan, current HubSpot CEO, alongside Brian Halligan, Chairman. (Company PR)
How well is Yamini doing at her new job? She’s absolutely crushing it! She was just named No. 1 on Comparably’s list of top-rated CEOS according to women.
Over the years, HubSpot has regularly launched new products and saw a re-acceleration of its revenue growth.

HubSpot Product Releases (Company Presentation)
To illustrate, HubSpot CMS (web content management software) launched in April 2020. And today, it’s the leader in Web Content Management (G2 Grid) in less than two years. This is what optionality looks like.
When you invest in innovative teams, your investment can flourish for reasons not included in your initial bull case. That’s what I call stacking the deck in your favor.
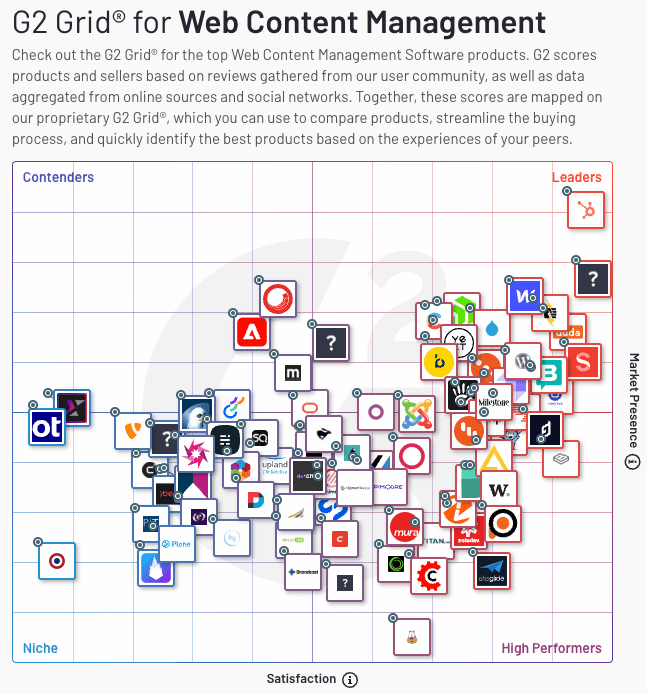
G2 Grid for Web Content Management (G2 Grid)
Let’s review the main highlights from the most recent quarter.
Q1 FY22 Highlights:
- Revenue grew +41% to $396M vs. a guidance of +36% Y/Y.
- Subscription revenue was 97% of the top line (unchanged).
- Gross margin was 82% (+2pp Y/Y).
- Operating loss margin was -3% (+2pp Y/Y).
- Adjusted margin was 9% (+2pp Y/Y).
- Total customers grew +26% to 144K (vs. +30% Y/Y in Q4).
- Average revenue per sub grew +12% $11,030 (vs. +11% Y/Y in Q4).
- Cash provided by operations was $82M (+31% Y/Y) or a 21% OCF margin.
- Cash on the balance sheet was $1.2B at the end of March.
- Guidance for Q2 FY22 is $410M or +32% Y/Y.
- Guidance for FY22 is $1,725M or +33% Y/Y (unchanged).
The average revenue per sub growth accelerated for the third consecutive quarter. In addition, the company is gaining new customers at a fast clip, all signs of a solid product-market fit.
The full-year guidance remained unchanged, but HubSpot has a history of beating its guidance by 3% to 8%.
Revenue growth is normalizing to its pre-COVID trend, though it’s still ahead of the 2018 pace. In the chart below, we can see the impact of COVID with a sharp drop in Q2 2020, followed by a great acceleration (primarily explained by the launch of many new startups, that use HubSpot to generate leads).
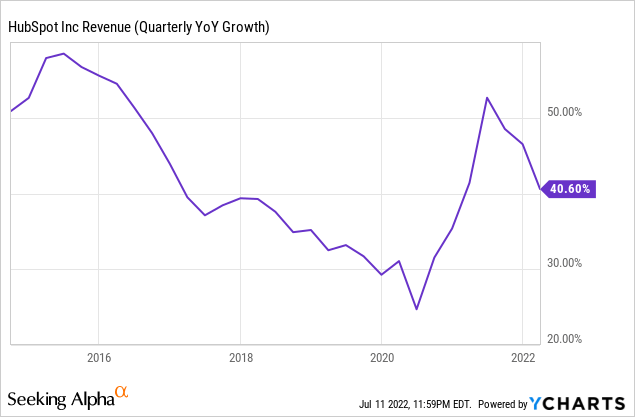
HubSpot has been an unstoppable force, growing its top line at a CAGR of 41% CAGR since 2014.

HubSpot Revenue Growth (Company Presentation)
The company has been cash flow positive for years and has been capital efficient throughout its exceptional growth phase. The margin profile of the company has steadily improved over time.

HubSpot Margin Profile (Company Presentation)
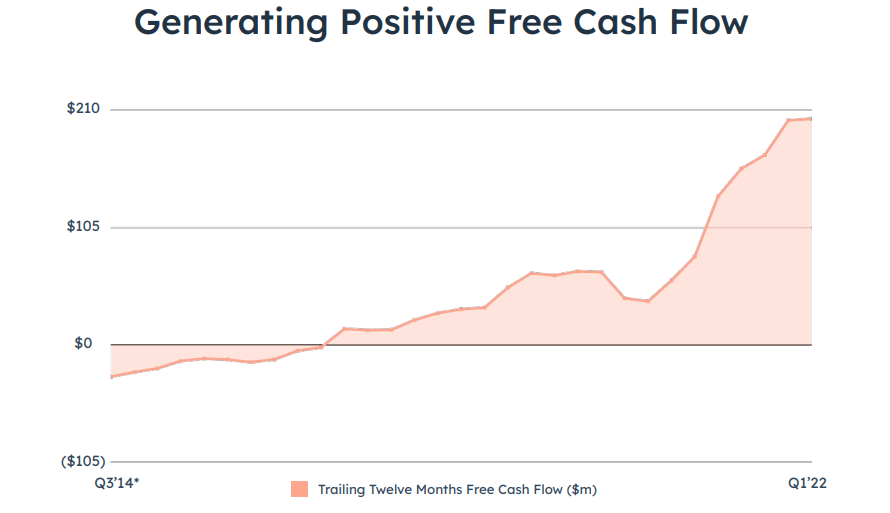
HubSpot Cash Flow Margin (Company Presentation)
Stock-based compensation was $46M in Q1 FY22, or 12% of revenue (unchanged). It was $166M in FY21, or ~1% dilution annually, which is not a concern for me.
Management provided a clear roadmap for future margin expansion. Over time, the adjusted operating margin is expected to reach 20% to 25%.
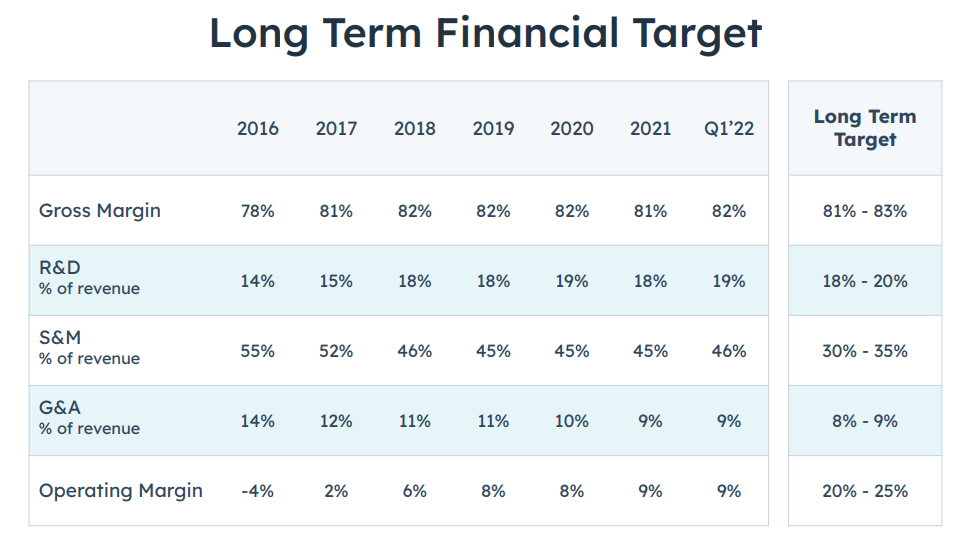
HubSpot Long-Term Target (Company Presentation)
The consistency of the execution has been something to celebrate.
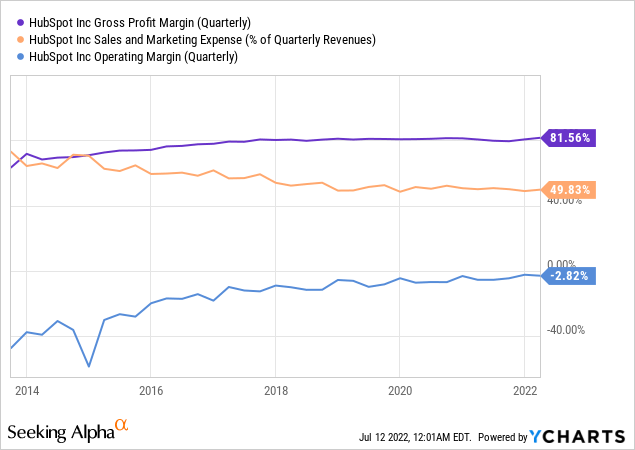
Overall, the company’s most recent financial results can be summarized as follows:
- Strong top-line growth (+47%) – showing strength.
- Stable gross margin at 83% – showing long-term potential.
- Flagging sales and marketing costs – showing scalability.
- Improving operating margin – showing operating leverage.
- Positive cash from operations – showing sustainability.
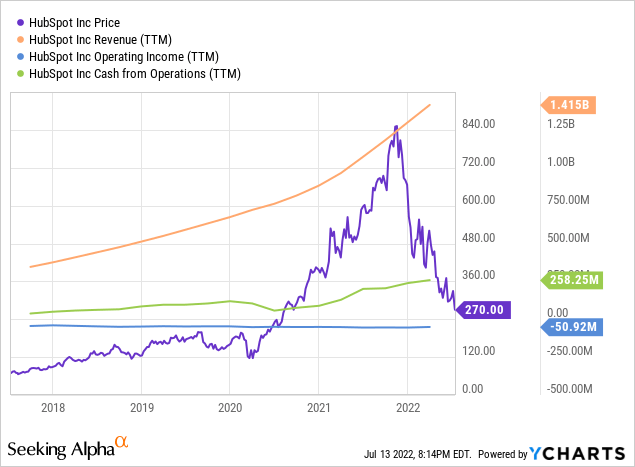
Hubspot has historically traded between 10 and 13X revenue pre-COVID (close to Salesforce), but it’s trading at ~9X today. Additionally, revenue growth has re-accelerated above 30% since mid 2020.
If a company like Salesforce trades at 6X revenue while growing in the mid-20s, it does make sense to see HUBS trade at a premium while growing in the mid-30s (based on guidance). Given the company’s track record, I believe the premium is justified, and HUBS is cheaper than companies growing at a similar pace, with continued margin improvements.
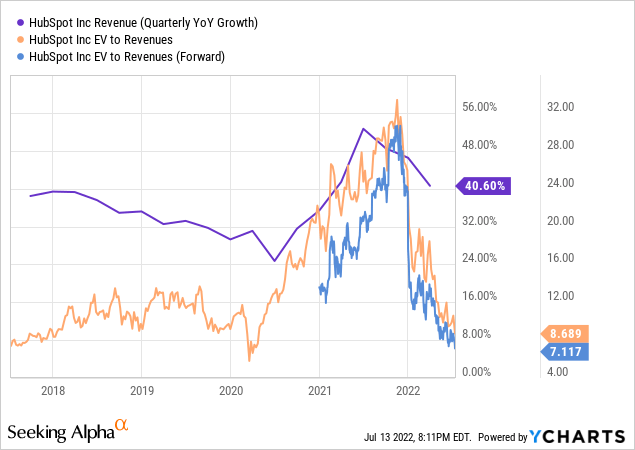
I recently pointed out that HubSpot has a financial profile and valuation similar to Salesforce 12 years ago, illustrating the opportunity at play.
HubSpot is one of the very best employers in America. The company was No. 2 in the Best Places to Work 2022 rankings.
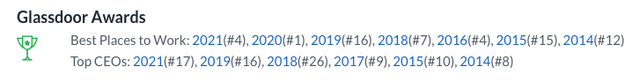
HubSpot Accolades (Glassdoor)
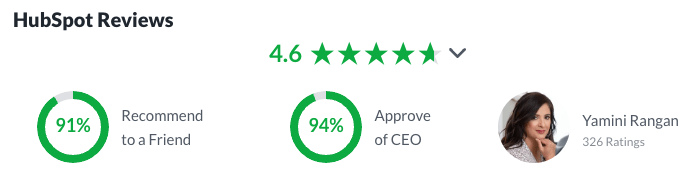
HubSpot Employee Reviews (Glassdoor)
To wrap it up:
- Opportunities:
- HubSpot has an outstanding track record of innovation, with new product launches. In addition, management already hinted at payments and commerce in the last earnings call, indicating more to come.
- International revenue has grown from 22% in 2014 to 46% in 2022, illustrating the potential for the company outside of North America.
- Risks:
- Martech is increasingly competitive, with many companies building platforms and consolidating multiple services under one roof. So while HubSpot is well positioned as a leader, it may have a smaller piece of the pie over time.
- SMBs can suffer in a challenging macro environment, leading to a higher churn.
- While the valuation is attractive from a historical standpoint, it could still compress dramatically in the near term, like CRM in late 2008.
Bottom Line
These three stocks are holdings in the App Economy Portfolio. They represent about 7% of my portfolio as of this writing (altogether).
How about you?
- Have you been accumulating beaten-down stocks in the current sell-off?
- Are you using pullbacks as a reason to build up positions or as a reason to run for the hills?
- Do you believe these stocks are overvalued or have become attractive for investors with a multi-year time horizon?
Let me know in the comments!
Be the first to comment